Download presentation
Presentation is loading. Please wait.

1
Dimacs Graph Mining (via Similarity Measures) Ye Zhu Stephanie REU-DIMACS, July 17, 2009 zzyye@eden.rutgers.edu Mentor : James Abello
 Ye Zhu Stephanie REU-DIMACS, July 17, 2009 Mentor : James Abello")
2
Talk Outline I. From Data to Graphs via Similarity Measure II. Our Research Project Input: REU participants information DIMACS Workshop Data Output: A variety of Graphs III. Main Questions a. Choose good similarity measures b. Visualize and detect “interesting” patterns

3
Original data records for building REU-Participants graphs

4
Original Data Records

5
DIMACS Workshop Abstracts

6
General Method Step 1: Compute a similarity measure among the data records shown above. Since a record can be viewed as a unweighted/weighted set of attributes we use unweighted/weighted version of an standard metric among finite sets that uses the size of the intersection over the size of the union between two sets

7
Weighted case Weighted case eat 0.7 shaggy 0.8 brown 0.9 fat 0.75 pet 0.6 hairy 0.85 fat 0.75 pet 0.6 pet fat dog cat

8
Computation Computation eat 0.7 shaggy 0.8 brown 0.9 fat 0.75 pet 0.6 hairy 0.85 fat 0.75 pet 0.6 pet fat dog cat

9
General Method Step 1: Compute a similarity measure among the data records shown above. Step 2: Deal with different types of data records respectively.

10
Computing Edge Weight To deal with different types of information, we partition the attributes into different classes according to their value types and compute a similarity measure for each class and then combine these values using a convex combination Eg. Total Weight= 0.3*Weighted Coeff+0.7*Unweighted Coeff

11
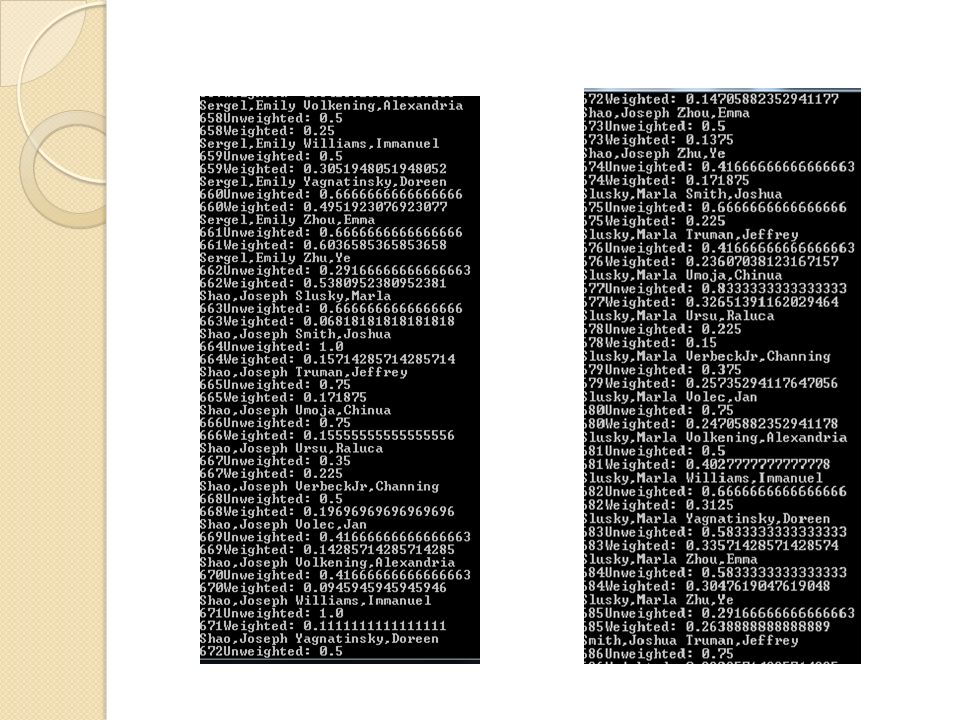
REU participants example How to calculate the Edge Weight? Unweighted Weighted

13
REU participants example How about the Vertices' Weight(ball size) We can simply convert these 3 columns to three-digit numbers !!!
 We can simply convert these 3 columns to three-digit numbers !!!")
14
General Method Step 1: Compute a similarity measure among the data records shown above. Step 2: Deal with different types of data records respectively. Step 3: Build weighted graph where each record is now treated as a vertex and two vertices are joined by an edge with weight equal to their computed similarity

15
General Method Step 1: Compute a similarity measure among the data records shown above. Step 2: Deal with different types of data records respectively. Step 3: Build weighted graph where each record is now treated as a vertex and two vertices are joined by an edge with weight equal to their computed similarity Step 4: Visualize the graph use GraphView Software and find interesting clusters

16
REU Participants Graph

17
Workshop Abstract Example Read in all workshop abstracts file Delete stop words -> unimportant words Get a count of number of appearances (freqency) of ALL words left in All workshop abstracts Compute Jaccard Coefficient
 of ALL words left in All workshop abstracts Compute Jaccard Coefficient")
18
After-delete file

19
Dimacs Workshop Abstract Graph

20
Conclusion We have shown how data set records can be transformed into a weighted graph by using a similarity measure among records This methodology allows us to use powerful graph clustering techniques to analyze and visualize data bases.

21
References [ 1 ] GraphView system [ 2 ] C Gasperin, P Gamallo, A Agustini, G Lopes, V Lima 2001- Using syntactic contexts for measuring word similarity [3] Resnik, Philip (1999) Semantic Similarity in a Taxonomy: An Information-Based Measure and its Application to Problems of Ambiguity in Natural Language. Journal of Artificial Intelligence Research
![References [ 1 ] GraphView system [ 2 ] C Gasperin, P Gamallo, A Agustini, G Lopes, V Lima Using syntactic contexts for measuring word similarity [3] Resnik, Philip (1999) Semantic Similarity in a Taxonomy: An Information-Based Measure and its Application to Problems of Ambiguity in Natural Language.](http://images.slideplayer.com/23/6919575/slides/slide_21.jpg "Journal of Artificial Intelligence Research.")
22
Thank you! The end

Similar presentations

, Eduard Hovy (USC) From Proceedings of ACL-42 Reference Resolution workshop 2004.>")


>")
. Use attribute-based distance.>")


>")
