Download presentation
Presentation is loading. Please wait.

1
Mapping Social Enterprise in Dundee Rick Rijsdijk Director, Social Value Lab

2
Why Mapping Social Enterprise Gather robust and useful information about the scope and scale of the sector Provide evidence of importance of the sector Baseline for measuring growth Enable DSEN and DCC to support the Sector better

3
Our Method Define Social Enterprise Identify the Population Survey Financial Analysis Reporting

4
Our Definition of Social Enterprise Senscot Voluntary Code of Practice Trading Asset lock Non profit distribution Dissolution clauses Aspire to financial independence Independent from public sector

5
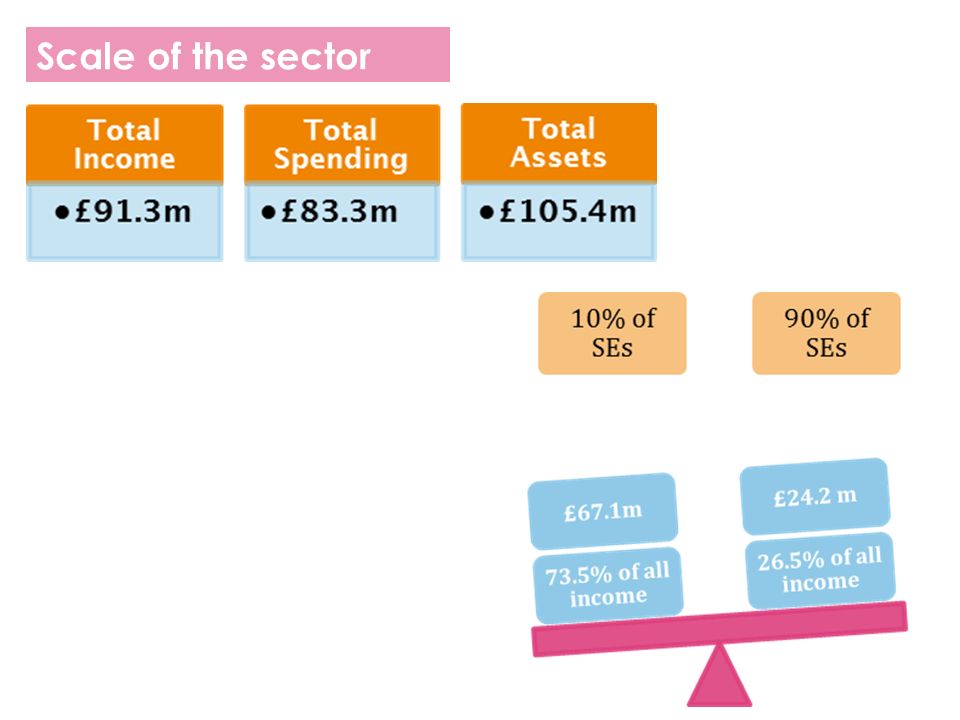
Scale of the sector

8
Structure Housing Associations Social Firms Co-operatives Credit Unions Voluntary Organisations Trading Charities Development Trusts

9
Initial Population

10
A common identity? Is ‘social enterprise’ a term that your organisation uses to describe itself?

11
Geography One part of Dundee 9% Internationally 6% All of UK 4% All of Scotland 17% Across Local Authorities 34% Across Dundee 30%

12
Geography 23.1% 40.5% 7.4% 21.5% 7.4%

13
Trading

14
MATURE 46% >50% income from trading MATURE 46% >50% income from trading ASPIRING 17% 25-49% income from trading ASPIRING 17% 25-49% income from trading START-UP 37% <25% income from trading START-UP 37% <25% income from trading

15
Trading - Contracts

16
Financial strength: Profitability Profitability Ratio The percentage of profit for each £1 income after taking account for all expenditure Formula: Net Surplus / Total Income Profitability Ratio The percentage of profit for each £1 income after taking account for all expenditure Formula: Net Surplus / Total Income 2.8%

17
Financial strength: Liquidity Current Ratio Indicator of the ability to meet short-term obligations Formula: Current Assets / Current Liabilities Current Ratio Indicator of the ability to meet short-term obligations Formula: Current Assets / Current Liabilities 3.47

18
Financial strength: Balance Sheet Fixed Assets - Current Liabilities = Net Assets £105m £263m£24m Current Assets Long Term Liabilities £42m£176m

19
Financial strength: Self-sufficiency Self-sufficient Ratio Indicator of how able the sector is to cover its cost through earned income. Formula: Earned Income / Total Expenditure Self-sufficient Ratio Indicator of how able the sector is to cover its cost through earned income. Formula: Earned Income / Total Expenditure 67.3% Grant Reliance Ratio Indicator of the reliance on grant funding. Formula: Grants / Total Income Grant Reliance Ratio Indicator of the reliance on grant funding. Formula: Grants / Total Income 28.4%

20
Financial strength: Sustainability Survival Ratio Indicator of how long social enterprises could survive with no income. Formula: Total Unrestricted Reserves / Total Income Survival Ratio Indicator of how long social enterprises could survive with no income. Formula: Total Unrestricted Reserves / Total Income 14 wks.

21
Looking Forward How has as the economic climate over the last 12 months affected your organisation's financial health?

22
Barriers to growth

23
THANK YOU! Rick Rijsdijk Director, Social Value Lab W : www.socialvaluelab.org.uk T : 0044 141 352 7419 E : rick@socialvalue.lab.org.uk

Similar presentations


 2004 Prentice Hall, Inc. The Analysis of Financial Statements This chapter will develop tools and.>")


