Download presentation
Presentation is loading. Please wait.

1
Cost Behavior Analysis
23

2
Cost Behavior and Management
OBJECTIVE 1: Define cost behavior, and identify variable, fixed, and mixed costs.

3
Figure 1: A Common Variable Cost Behavior Pattern: A Linear Relationship

4
Figure 2: Examples of Variable, Fixed, and Mixed Costs

5
Figure 3: A Common Fixed Cost Behavior Pattern

6
Figure 4: Behavior Patterns of Mixed Costs

7
Figure 5: The Relevant Range and Linear Approximation

8
Cost Behavior and Management
Cost behavior refers to the way costs respond to changes in volume or activity.

9
Cost Behavior and Management
Managers use assumptions about cost behavior in almost every decision they make. When planning, managers use cost behavior to determine how many units of products or services must be sold to generate a targeted amount of profit and how changes in planned activities will affect operating income.

10
Cost Behavior and Management
Managers use assumptions about cost behavior in almost every decision they make. (cont.) When performing their duties, managers use cost behavior to determine the impact of their decisions on operating income. When evaluating and reporting on performance, managers analyze how changes in costs and sales affect profitability.
 When performing their duties, managers use cost behavior to determine the impact of their decisions on operating income. When evaluating and reporting on performance, managers analyze how changes in costs and sales affect profitability.")
11
Cost Behavior and Management
The behavior of costs Total costs that change in direct proportion to changes in productive output (or other volume measures) are called variable costs. However, on a per unit basis, variable costs remain constant as volume changes. Operating capacity is the upper limit of an organization’s productive output capability, given its existing resources.
 are called variable costs. However, on a per unit basis, variable costs remain constant as volume changes. Operating capacity is the upper limit of an organization’s productive output capability, given its existing resources.")
12
Cost Behavior and Management
The behavior of costs (cont.) There are three common measures of operating capacity: Theoretical (ideal) capacity Practical capacity Normal capacity
 There are three common measures of operating capacity: Theoretical (ideal) capacity. Practical capacity. Normal capacity.")
13
Cost Behavior and Management
The behavior of costs (cont.) The traditional definition of variable costs assumes that a linear relationship exists between costs and the measure of capacity chosen. Many costs vary with operating activity in a nonlinear fashion; this cost behavior can be approximated within the relevant range using linear approximation.
 The traditional definition of variable costs assumes that a linear relationship exists between costs and the measure of capacity chosen. Many costs vary with operating activity in a nonlinear fashion; this cost behavior can be approximated within the relevant range using linear approximation.")
14
Cost Behavior and Management
The behavior of costs (cont.) Fixed costs are total costs that remain constant within a relevant range of volume or activity. Fixed unit costs vary inversely with changes in activity or volume. Mixed costs have both variable and fixed cost components. Many mixed costs vary with operating activity in a nonlinear fashion. Accountants use linear approximation to allow the inclusion of nonlinear costs in cost behavior analysis.
 Fixed costs are total costs that remain constant within a relevant range of volume or activity. Fixed unit costs vary inversely with changes in activity or volume. Mixed costs have both variable and fixed cost components. Many mixed costs vary with operating activity in a nonlinear fashion. Accountants use linear approximation to allow the inclusion of nonlinear costs in cost behavior analysis.")
16
Mixed Costs and the Contribution Margin Income Statement
OBJECTIVE 2: Separate mixed costs into their variable and fixed components, and prepare a contribution margin income statement.

17
Figure 6: Scatter Diagram of Machine Hours and Electricity Costs

18
Table 1: Comparison of Income Statements

19
Table 2 Contribution Margin Income Statement

20
Mixed Costs and the Contribution Margin Income Statement
Mixed costs are a combination of variable and fixed cost components. For cost planning and control purposes, mixed costs must be divided into their variable and fixed components.

21
Mixed Costs and the Contribution Margin Income Statement
Engineering method Separates costs by performing step-by-step analysis of tasks, costs and processes involved. Also called a time and motion study.

22
Mixed Costs and the Contribution Margin Income Statement
Scatter diagram method Used when there is doubt about the behavior pattern of a particular cost. If the diagram suggests a linear relationship, a cost line can be imposed.

23
Mixed Costs and the Contribution Margin Income Statement
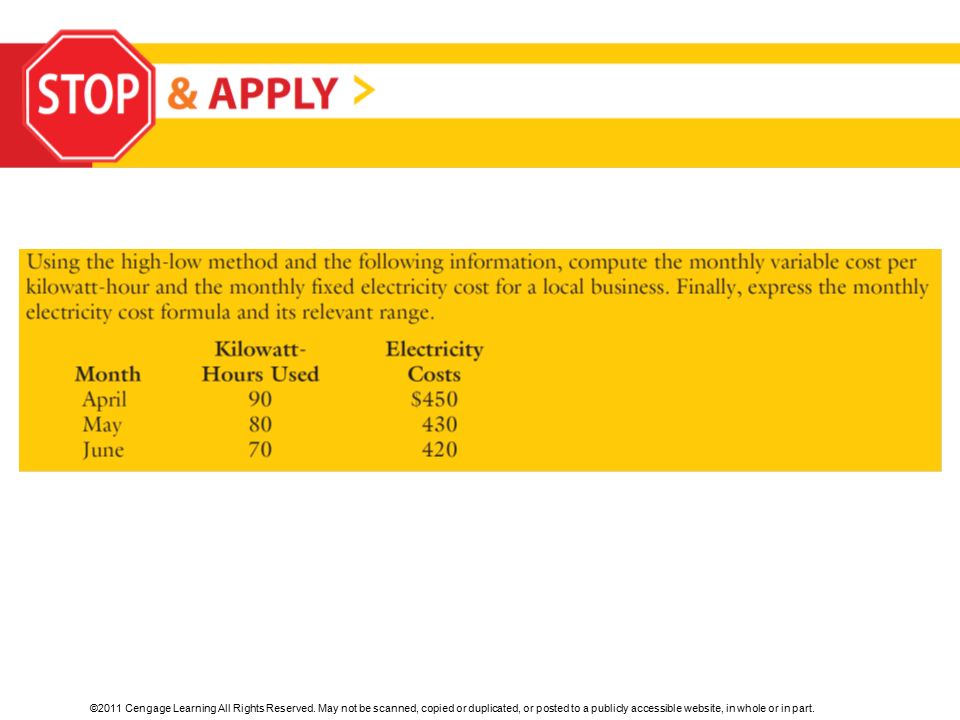
High-low method Three-step approach to determining variable and fixed components. Find the variable rate. Find the total fixed costs. Express the cost formula to estimate total costs within the relevant range.

24
Mixed Costs and the Contribution Margin Income Statement
High-low method (cont.) Its disadvantage is that if one or both data points are not representative of the remaining data set, the estimate of variable and fixed costs may not be accurate. Its advantage is that it can be used when only limited data are available.
 Its disadvantage is that if one or both data points are not representative of the remaining data set, the estimate of variable and fixed costs may not be accurate. Its advantage is that it can be used when only limited data are available.")
25
Mixed Costs and the Contribution Margin Income Statement
Statistical methods, such as regression analysis Mathematically describe the relationship between costs and activities Because all data observations are used, the resulting linear equation is more representative of cost behavior than either the high-low or scatter diagram methods.

26
Mixed Costs and the Contribution Margin Income Statement
Contribution margin income statements A contribution margin income statement is formatted to emphasize cost behavior rather than organizational functions. Contribution margin (CM) is the amount that remains after all variable costs are subtracted from sales.
 is the amount that remains after all variable costs are subtracted from sales.")
28
Cost-Volume-Profit Analysis
OBJECTIVE 3: Define cost-volume-profit (C-V-P) analysis and discuss how managers use it as a tool for planning and control.
 analysis and discuss how managers use it as a tool for planning and control.")
29
Cost-Volume-Profit Analysis
C-V-P analysis C-V-P analysis is an examination of the cost behavior patterns that underlie the relationships among cost, volume of output, and profit. Sales Revenue – Variable Costs – Fixed Costs = Profit

30
Cost-Volume-Profit Analysis
C-V-P analysis (cont.) Tool for both planning and control. Can calculate net income when sales volume is known Can determine the level of sales need to reach a targeted amount of income.
 Tool for both planning and control. Can calculate net income when sales volume is known. Can determine the level of sales need to reach a targeted amount of income.")
31
Cost-Volume-Profit Analysis
C-V-P analysis (cont.) Only used under certain conditions and when certain assumptions hold true. The behavior of variable and fixed costs can be measured accurately. Costs and revenues have a close linear approximation. Efficiency and productivity hold steady within the relevant range.
 Only used under certain conditions and when certain assumptions hold true. The behavior of variable and fixed costs can be measured accurately. Costs and revenues have a close linear approximation. Efficiency and productivity hold steady within the relevant range.")
32
Cost-Volume-Profit Analysis
C-V-P analysis (cont.) Only used under certain conditions and when certain assumptions hold true. (cont.) Cost and price variables hold steady during the period being planned. The product sales mix does not change during the period being planned. Production and sales volume are approximately equal.
 Only used under certain conditions and when certain assumptions hold true. (cont.) Cost and price variables hold steady during the period being planned. The product sales mix does not change during the period being planned. Production and sales volume are approximately equal.")
34
Breakeven Analysis OBJECTIVE 4: Define breakeven point and use contribution margin to determine a company’s breakeven point for multiple products.

35
Figure 7: Graphic Breakeven Analysis for My Media Place

36
Figure 8: Sales Mix for My Media Place

37
Breakeven Analysis The breakeven point is the point of zero profit, where S – VC – FC = 0. The margin of safety is the number of sales units or amount of sales dollars by which actual sales can fall below planned sales without resulting in a loss. A scatter graph can be used to make a rough estimate of the breakeven point.

38
Contribution margin equals sales minus total variable costs.
Breakeven Analysis Contribution margin equals sales minus total variable costs. Profit equals contribution margin minus fixed costs. Contribution margin per unit equals selling price minus variable cost per unit.

39
Contribution margin equals sales minus total variable costs. (cont.)
Breakeven Analysis Contribution margin equals sales minus total variable costs. (cont.) Breakeven point in units equals fixed costs divided by the contribution margin per unit. Breakeven point in sales dollars equals breakeven point in units times the selling price per unit. When an organization sells more than one product, a sales mix is used to calculate the breakeven point for each product.
 Breakeven point in units equals fixed costs divided by the contribution margin per unit. Breakeven point in sales dollars equals breakeven point in units times the selling price per unit. When an organization sells more than one product, a sales mix is used to calculate the breakeven point for each product.")
41
Using C-V-P Analysis to Plan Future Sales, Costs, and Profits
OBJECTIVE 5: Use C-V-P analysis to project the profitability of products and services.

42
Exhibit 1: Comparative Summary of Alternatives at My Media Place

43
Using C-V-P Analysis to Plan Future Sales, Costs, and Profits
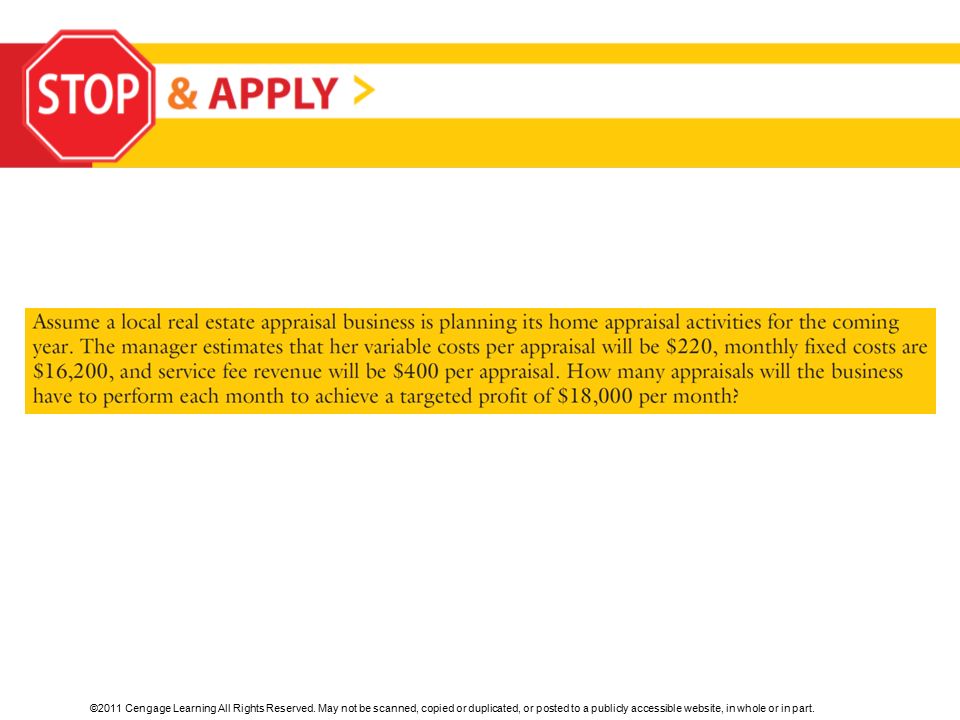
C-V-P analysis enables managers to determine how changes in volume, selling price, and costs will affect the profitability of a product. The following formula is used to determine the number of units that must be sold to produce a certain profit: Targeted sales in units = (FC + P) ÷ (CM per Unit)
 ÷ (CM per Unit)")
44
Using C-V-P Analysis to Plan Future Sales, Costs, and Profits
A service business can use C-V-P analysis to separate the mixed costs of service overhead into their variable and fixed components, calculate a breakeven point, and determine how changes in cost, volume, or price will affect the profitability of a service.

Similar presentations


 Analysis.>")


 analysis focuses on the following factors: The prices of products or services The volume of products or services.>")
