Download presentation
Presentation is loading. Please wait.

1
An Examination of the Program for the International Assessment of Adult Competencies (PIAAC) Findings in the United States National Council for Workforce Education Pittsburgh, PA October 30, 2014 Phyllis Cummins and Ryan Walker
 Findings in the United States National Council for Workforce Education Pittsburgh, PA October 30, 2014 Phyllis Cummins and Ryan Walker")
2
PIAAC Background Literacy, Numeracy, Problem Solving Skills Overview of research process Results Discussion Questions Presentation Overview

3
Coordinated by the OECD International large-scale assessment administered in 2011-12 in 23 countries Third in a series of assessments: IALS between 1994-1998 and ALL between 2003-2008 16- to 65-year-olds, non-institutionalized, residing in the country Laptop computer or paper-and-pencil Assessment subjects: Literacy, Numeracy, and Problem Solving in Technology-Rich Environments Extensive background questionnaire What is PIAAC?

4
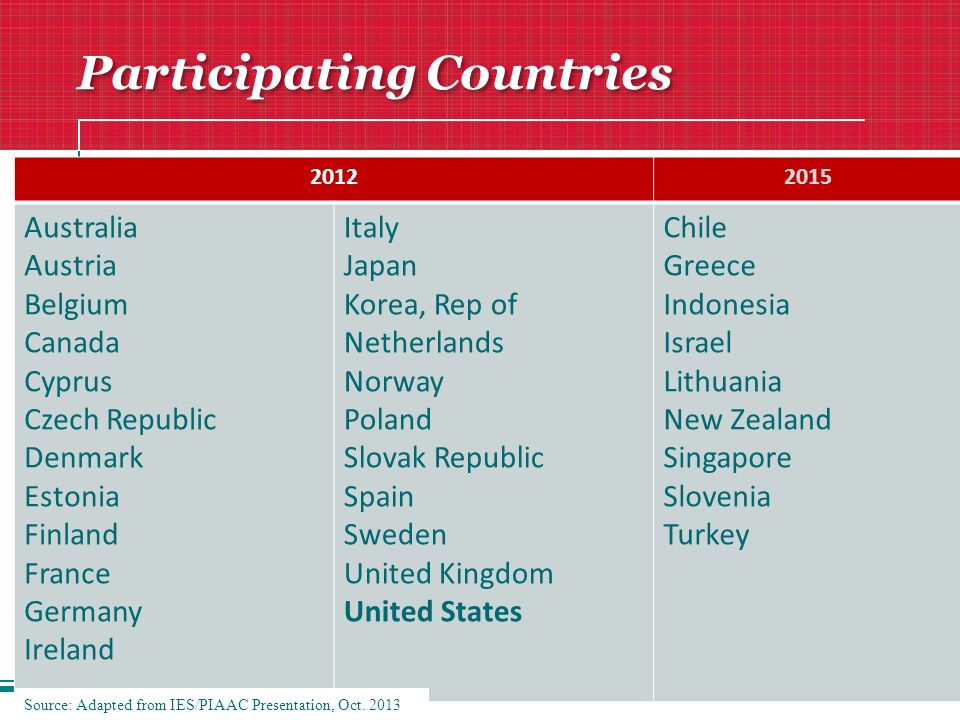
Participating Countries 20122015 Australia Austria Belgium Canada Cyprus Czech Republic Denmark Estonia Finland France Germany Ireland Italy Japan Korea, Rep of Netherlands Norway Poland Slovak Republic Spain Sweden United Kingdom United States Chile Greece Indonesia Israel Lithuania New Zealand Singapore Slovenia Turkey Source: Adapted from IES/PIAAC Presentation, Oct. 2013
5
U.S. Adults Fare Poorly in a Study of Skills By RICHARD PÉREZ-PEÑA Published: October 8, 2013 New York Times Article

6
Below the international average in all subject areas Ranked better in literacy than in numeracy or problem solving in technology-rich environments Higher percentage at low proficiency levels than international average Percentages of top performers similar to or slightly lower than international average, depending on the subject Performance gap between young and older population smaller than the average gap internationally General Patterns of U.S. Results

7
U.S. average literacy score (270) lower than the international average (273) Source: Adapted from IES/PIAAC Presentation, Oct. 2013
 lower than the international average (273) Source: Adapted from IES/PIAAC Presentation, Oct")
8
U.S. Average Literacy Score in 2012 not Significantly Different from 2003, but Lower than in 1994 *p <.05. Average score is significantly different from PIAAC. Source: Adapted from IES/PIAAC Presentation, Oct. 2013

9
Only Oldest U.S. Adults Outperformed the International Average in Literacy *p <.05. U.S. average score is significantly different from PIAAC international average. Source: Adapted from IES/PIAAC Presentation, Oct. 2013

10
Least Educated Adults Below the International Average in Literacy *p <.05. U.S. average score is significantly different from PIAAC international average. Source: Adapted from IES/PIAAC Presentation, Oct. 2013

11
Employed Adults in the U.S. Had Lower Average Literacy Scores than Their Peers Internationally *p <.05. U.S. average score is significantly different from PIAAC international average. Source: Adapted from IES/PIAAC Presentation, Oct. 2013

12
U.S. average numeracy score (253) lower than the international average (269) Source: Adapted from IES/PIAAC Presentation, Oct. 2013
 lower than the international average (269) Source: Adapted from IES/PIAAC Presentation, Oct")
13
U.S. Average Numeracy Score in 2012 Lower Than in 2003 *p <.05. Average score is significantly different from PIAAC. Source: Adapted from IES/PIAAC Presentation, Oct. 2013

14
U.S. Adults in All Age Groups Below International Average in Numeracy *p <.05. U.S. average score is significantly different from PIAAC international average. Source: Adapted from IES/PIAAC Presentation, Oct. 2013

15
U.S. Adults at Every Education Level Below the International Average in Numeracy *p <.05. U.S. average score is significantly different from PIAAC international average. Source: Adapted from IES/PIAAC Presentation, Oct. 2013

16
Employed Adults in the U.S. Had Lower Average Numeracy Scores than Their Peers Internationally *p <.05. U.S. average score is significantly different from PIAAC international average. Source: Adapted from IES/PIAAC Presentation, Oct. 2013

17
U.S. Average Problem Solving in Technology- Rich Environments Score (277) Lower Than the International Average (283) Source: Adapted from IES/PIAAC Presentation, Oct. 2013
 Lower Than the International Average (283) Source: Adapted from IES/PIAAC Presentation, Oct")
18
Only Oldest U.S. Adults Outperformed the International Average in Problem Solving in Technology-Rich Environments *p <.05. U.S. average scores are significantly different from PIAAC international average. Source: Adapted from IES/PIAAC Presentation, Oct. 2013

19
Least Educated Adults Below the International Average in Problem Solving in Technology-Rich Environments *p <.05. U.S. average scores are significantly different from PIAAC international average. Source: Adapted from IES/PIAAC Presentation, Oct. 2013

20
Employed Adults in the U.S. Had Lower Average Problem Solving in Technology-Rich Environments Scores than Their Peers Internationally *p <.05. U.S. average scores are significantly different from PIAAC international average. Source: Adapted from IES/PIAAC Presentation, Oct. 2013

21
Lower overall scores than international average in all subjects Higher percentages of low performers than internationally Larger gaps between less advantaged and more advantaged peers in literacy and numeracy, but not in problem solving in technology-rich environments Relatively lower performance of young adults and those with high school education or less Relatively higher performance of older adults in literacy and problem solving in technology-rich environments U.S. PIAAC Findings Summary: Source: Adapted from IES/PIAAC Presentation, Oct. 2013

22
The Current Research Project: Examination of the Relationship between Participation in AET and Labor Market Outcomes

23
Background Investments in human capital are becoming increasingly important in a knowledge based global economy The U.S. labor force in aging People are remaining in the labor force at older ages Older workers are important for economic growth Older adults may have a fear of returning to the classroom and test-taking PIAAC and AET Participation in the U.S.

24
U.S. Labor Force Distribution by Age Group Source: Toossi (2013 )
")
26
U. S. Male Labor Force Participation by Age Group Source: Toossi (2013

27
U. S. Female Labor Force Participation by Age Group Source: Toossi (2013 )
")
28
Purpose of research –To identify the relationship between participation in formal and non-formal adult education and training (AET) programs and labor market outcomes for ages 45 to 65 Research questions: –Does participation in formal and non-formal AET predict employment status? –Does participation in formal and non-formal AET predict labor force participation? –Does participation in formal and non-formal AET predict income quintile? Current Project

29
Similar to “Lifelong Learning” Can be formal, non-formal, and informal –Formal - learning that takes place in education and training institutions and leads to recognized credentials and diplomas –Non-formal - learning that takes place in educational and training settings, but does not typically lead to a formalized credential –Informal - learning that takes place in everyday life and is not necessarily intentional Job related and non-job related Our focus was on formal and non-formal education What is Adult Education and Training?

30
Descriptive statistics Used chi-square tests and logistic regression techniques PIAAC used a complex sample design that involved both sample weights and replication weights Methodology

31
Results

32
Descriptive Statistics: Characteristics of AET Population 45 - 5455 - 65 Age Group53.146.9 Male47.647.1 Female52.452.9 Education Lower secondary or less11.410.4 Upper secondary40.742.8 Post-secondary non-tertiary9.98.7 Tertiary professional degree9.78.0 Tertiary bachelor's degree16.515.8 Master/research degree11.814.3 Employed93.293.5 Participates in Labor Force85.969.0 Participated in AET in prior 12 months Formal and non-formal AET55.850.4 Formal and non-formal AET, job related47.139.1 Non-formal AET53.748.9 Non-formal AET, job related45.438.1

33
Descriptive Statistics: Reasons for Non-Participation by Age Group

34
Descriptive Statistics: Reasons for Non-Participation by Education

35
Descriptive Statistics: Reasons for Non- Participation by Income Quintile

36
Descriptive Statistics: Reasons for Non- Participation by Sex

37
Chi-square Test Results: Ages 45 - 54 Non-Participation Group Participation Group Significance n (%) Design Based F df, rdf p Employment Status Unemployed41 (70.1)21 (29.9)24.981, 79<.001 Employed298 (35.5)537 (64.5) Labor Force Participation Not in the labor force131 (81.4)31 (18.6)104.421, 79<.001 In the labor force339 (37.8)558 (62.2) Income Quintile Lowest57 (52.6)46 (47.4)15.363.64,<.001 Next Lowest 69 (48.0)68 (52.0) 287.83 Middle 55 (42.0)87 (58.0) Next to highest 40 (23.2)126 (76.8) Highest 32 (16.6)174 (83.4) Total n (income) 253 (33.7)501 (66.3)
 Design Based F df, rdf p Employment Status Unemployed41 (70.1)21 (29.9)24.981, 79<.001 Employed298 (35.5)537 (64.5) Labor Force Participation Not in the labor force131 (81.4)31 (18.6) , 79<.001 In the labor force339 (37.8)558 (62.2) Income Quintile Lowest57 (52.6)46 (47.4) ,<.001 Next Lowest 69 (48.0)68 (52.0) Middle 55 (42.0)87 (58.0) Next to highest 40 (23.2)126 (76.8) Highest 32 (16.6)174 (83.4) Total n (income) 253 (33.7)501 (66.3)")
38
Chi-square Test Results: Ages 55 to 65 Non-Participation Group Participation GroupSignificance n (%) Design Based F df, rdf p Employment Status Unemployed22 (43.8)27 (56.2)1.041, 440.314 Employed225 (36.0)430 (64.0) Labor Force Participation Not in the labor force264 (78.9)75 (21.1)172.701, 44<.001 In the labor force247 (35.1)457 (64.9) Income Quintiles Lowest41 (49.5)49 (50.5)4.203.67,<.05 Next lowest30 (36.6)50 (63.4) 161.35 Middle45 (40.1)74 (59.9) Next to highest37 (30.0)97 (70.0) Highest33 (22.6)111 (77.4) Total n (income)186 (34.2)381 (65.8)
 Design Based F df, rdf p Employment Status Unemployed22 (43.8)27 (56.2)1.041, Employed225 (36.0)430 (64.0) Labor Force Participation Not in the labor force264 (78.9)75 (21.1) , 44<.001 In the labor force247 (35.1)457 (64.9) Income Quintiles Lowest41 (49.5)49 (50.5) ,<.05 Next lowest30 (36.6)50 (63.4) Middle45 (40.1)74 (59.9) Next to highest37 (30.0)97 (70.0) Highest33 (22.6)111 (77.4) Total n (income)186 (34.2)381 (65.8)")
39
Regression Results Model 1 Employment Model 2 Labor Force Participation Model 3 Income Did not participate in FNFAET12 (ref. grp.) - - - Participated in FNFAET120.684***1.384***0.441*** (0.149)(0.112)(0.0840) Age (all age groups)0.262*** (0.0629) Ages 18 to 44 (ref. grp.) - Ages 45 to 65 -0.382***0.593*** (0.0989)(0.0758) Male (ref. grp.)-- - Female-0.376**-0.984*** -1.027*** (0.141)(0.103) (0.0765) Education Lower secondary or less-0.259-0.316* -0.686*** (0.221)(0.156) (0.131) Upper secondary (ref. grp.) - - - Post-secondary, non-tertiary-0.01420.196 0.211 (0.247)(0.183) (0.136) Tertiary professional degree0.219-0.0315 0.714*** (0.265)(0.182) (0.137) Tertiary bachelor's0.631**0.0894 1.331*** (0.219)(0.150) (0.109) Master’s/ research degree0.620*0.266 2.070*** (0.281)(0.193) (0.129) Observations3,5404,325 2,952
 Participated in FNFAET ***1.384***0.441*** (0.149)(0.112)(0.0840) Age (all age groups)0.262*** (0.0629) Ages 18 to 44 (ref. grp.) - Ages 45 to ***0.593*** (0.0989)(0.0758) Male (ref. grp.)-- - Female-0.376**-0.984*** *** (0.141)(0.103) (0.0765) Education Lower secondary or less * *** (0.221)(0.156) (0.131) Upper secondary (ref. grp.) Post-secondary, non-tertiary (0.247)(0.183) (0.136) Tertiary professional degree *** (0.265)(0.182) (0.137) Tertiary bachelor s0.631** *** (0.219)(0.150) (0.109) Master’s/ research degree0.620* *** (0.281)(0.193) (0.129) Observations3,5404,325 2,952.")
40
There was a significant relationship between AET and employment status There was a significant relationship between AET and labor force participation The unemployed and not-in-the labor force groups are less likely to participate in AET Could increased AET participation by the unemployed reduce long-term unemployment and early exit from the labor market? Discussion

41
AET participation increases the likelihood of moving up one income quintile Lower income quintiles less likely to participate in AET than higher income quintiles Females benefit less than males from AET participation Less than a high school diploma group benefits less than high school graduates from AET participation Discussion

42
Provide additional low-cost opportunities for AET participation by low-income groups and the unemployed Improve outreach programs to the unemployed Increase supportive services to older adults returning to the classroom Encourage participation in both formal and non- formal training opportunities Recommendations

43
Examine the relationship between literacy, numeracy, and problem solving skills with AET participation Examine outcomes for 66 – 74 age group Further examine characteristics of the unemployed Compare PIAAC outcomes with IALS and ALL for the baby boomer cohort Future Research

44
This project was commissioned by American Institutes for Research, funded through a contract with the National Center for Educational Statistics (NCES).
.")
45
Questions?

Similar presentations