Download presentation
Presentation is loading. Please wait.

2
Parts of a Financial Statement 1.Statement of Income 2.Balance Sheet 3.Statement of Cash Flow 4.Statement of Stockholders’ Equity

3
Basic Accounting Identity Assets = Liabilities + Shareholder’s Equity A = L + Sh Eq

4
4 Basic Types of Analysis 1.Operating or activity analysis 2.Liquidity analysis 3.Long Term and solvency analysis 4.Profitability analysis

5
Operating or activity analysis 1.Inventory a) Turnover b) Inventory Period (IP) 2. Receivables a) Turnover b) Collection Period (CP) 3.Payables a) Turnover b) Payment Period (PP) 4.Assets Turnover Sales Accounts Receivable 365 days Receivables Turnover Cost of goods sold Payables Cost of goods sold Inventory 365 days Inventory Turnover Sales Assets 365 days Payables Turnover 5. Cash Conversion Period IP + CP - PP
 Turnover b) Collection Period (CP) 3.Payables a) Turnover b) Payment Period (PP) 4.Assets Turnover Sales Accounts Receivable 365 days Receivables Turnover Cost of goods sold Payables Cost of goods sold Inventory 365 days Inventory Turnover Sales Assets 365 days Payables Turnover 5. Cash Conversion Period IP + CP - PP.")
6
1.Current ratio 2.Quick Ratio 3.Cash Ratio 4.Net Working Capital to Assets 5.Interval measure Current Assets Current Liabilities Current Assets - Inventory Current Liabilities Cash Current Liabilities Net working Capital Total assets Current Assets Average Daily Operating Costs Liquidity Ratios

7
Long term and solvency analysis 1.Total Debt Ratios a) Total Debt b) Debt/ Equity c) Equity Multiplier 2.Times Interest Earned 3.Cash Coverage Liabilities Total Assets Liabilities Total Equity Total Assets Total Equity Earnings before Interest and Taxes (EBIT) Interest EBIT + Depreciation Interest
 Total Debt b) Debt/ Equity c) Equity Multiplier 2.Times Interest Earned 3.Cash Coverage Liabilities Total Assets Liabilities Total Equity Total Assets Total Equity Earnings before Interest and Taxes (EBIT) Interest EBIT + Depreciation Interest")
8
Profitability Measures 1.Profit Margin 2.Return on Assets 3.Return on Equity (ROE) 4. Dupont Identity Net Income Sales Net Income Assets Net Income Equity EBIT X EBI X Net Income X Sales X Assets = EBIT EBI Net Income Sales Assets Equity Equity Tax Interest Net Margin Asset Leverage Return Burden Burden Turnover on Equity

9
Working capital – ST Assets – ST Liabilities Working capital – 1,282 – 672 = 610

11
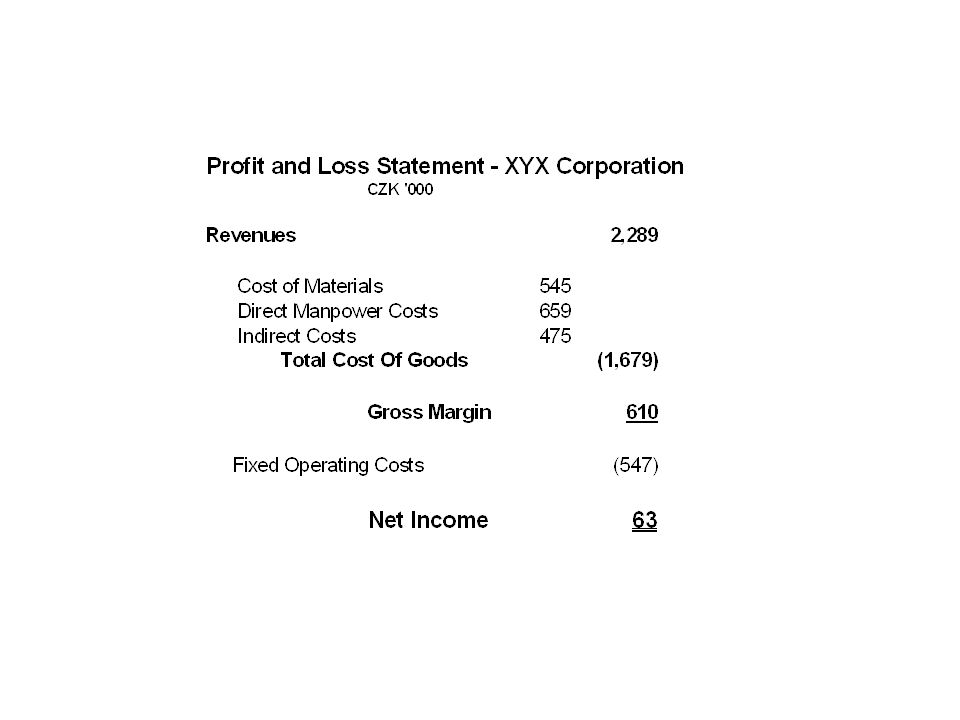
Operating or activity analysis 1.Inventory a) Turnover b) Days’ sales in Inventory 2. Receivables a) Turnover b) Collection Period 3.Payables a) Turnover b) Payment Period 4.Assets Turnover 2,289 or 345 365 days or 6.63 1,679 or 422 1,679 or 872 365 days or 1.93 2,289 or 5,589 1.93 189 days 6.63 55 days 3.97 2.44 5. Cash Conversion Period 365 days or 3.97 92 days 189 + 55 – 92 = 152 days
 Turnover b) Collection Period 3.Payables a) Turnover b) Payment Period 4.Assets Turnover 2,289 or days or ,679 or 422 1,679 or days or ,289 or 5, days days Cash Conversion Period 365 days or days – 92 = 152 days.")
12
Liquidity Ratios 1.Current ratio 2.Quick Ratio 3.Cash Ratio 4.Net Working Capital to Assets 5.Interval measure 1,282 672 445 672 100 672 1.91. 67. 14 610 5,589.11 1,282 6.09 210

13
Long term and solvency analysis 1.Total Debt Ratios a) Total Debt b) Debt/ Equity c) Equity Multiplier 2,855 5,589 2,855 2,734 5,589 2,734.51 1.04 2.04
 Total Debt b) Debt/ Equity c) Equity Multiplier 2,855 5,589 2,855 2,734 5,589 2,")
14
Profitability Measures 1.Profit Margin 2.Return on Assets 3.Return on Equity (ROE) 63 2,289 63 5589 63 2734.03.01.02
 63 2,")
Similar presentations


 / 2 = Average Total Assets n Net Income after Federal Income.>")


 2004 Prentice Hall, Inc. The Analysis of Financial Statements This chapter will develop tools and.>")


 The Balance Sheet The Income Statement Taxes Free Cash Flow/Cash Flow From Assets Ratio Analysis Financial Statement (Ch2&3)>")

