Download presentation
Presentation is loading. Please wait.

1
Gerald Morton, Director Information Department Tim Winkelmans, Manager Distributed Learning Unit Gerald Morton, Director Information Department Tim Winkelmans, Manager Distributed Learning Unit

2
Distributed Learning: Vision Distributed learning in BC will be a quality, dynamic and engaging learning environment that all students in the province can access. It will not be limited by schedules, calendars, facilities or locations. Distributed learning in BC will be a quality, dynamic and engaging learning environment that all students in the province can access. It will not be limited by schedules, calendars, facilities or locations. DL will provide equitable access to education, specifically providing choice for students who have restricted options.

5
Enrolment Growth: Headcount

6
Provincial Enrolment Profile - Public Category 2006/2007Revised 07/08 FTEHCCoursesFTEHCCourses Adults, Non- Graduated 7934,0716,3448003,2006,400 Public School- Age 6,36410,48650,9127,0008,70056,000 Cross- enrolments 3,69515,46529,5604,60023,00036,800 Total Public, Block-funded 10,85230,14086,81612,40034,90099,200 Adults, Education Guarantee not counted or funded3752,3003,000 Independent Schools 2,4863,75019,8883,5505,00028,400 Unfunded carry- over not included in original projections 06,1007,300 Total DL, Public and Independent 13,33833,022106,70416,32548,300137,900 Note: 33,022 < 30,140 + 3,750 because some students are in both

7
Choice Pattern, September 2007 +36% +270% -37% +168%

8
Grade 10-12 Choices DL students in Grades 10-12 in 06/07 (full year): 27,187 Portion of these that cross-enrolled: 15,465 (57%) DL students in Grades 10-12 in 06/07 (full year): 27,187 Portion of these that cross-enrolled: 15,465 (57%)
: 27,187 Portion of these that cross-enrolled: 15,465 (57%) DL students in Grades in 06/07 (full year): 27,187 Portion of these that cross-enrolled: 15,465 (57%)")
9
Rural/Urban Mix in DL 46 Boards of Education with DL schools: 2006/2007 13 urban 33 rural 2007/2008 15 urban 31 rural Urban DL/Rural DL student ratio Board status 60% urban, 40% rural School status 78% urban, 22% rural 46 Boards of Education with DL schools: 2006/2007 13 urban 33 rural 2007/2008 15 urban 31 rural Urban DL/Rural DL student ratio Board status 60% urban, 40% rural School status 78% urban, 22% rural

10
DL Support Block Begins Sept 2008 Neighbourhood schools claim maximum of 1 DL block per student September 1701 only Similar to Learning Assistance Regular attendance Teacher supervision and support Reported as LA on 1701 Counts as 0.125 FTE Disallowed when real course count exceeds 8 (1 FTE) Begins Sept 2008 Neighbourhood schools claim maximum of 1 DL block per student September 1701 only Similar to Learning Assistance Regular attendance Teacher supervision and support Reported as LA on 1701 Counts as 0.125 FTE Disallowed when real course count exceeds 8 (1 FTE)
 Begins Sept 2008 Neighbourhood schools claim maximum of 1 DL block per student September 1701 only Similar to Learning Assistance Regular attendance Teacher supervision and support Reported as LA on 1701 Counts as FTE Disallowed when real course count exceeds 8 (1 FTE)")
11
Summer Learning Ensures students do not pay tuition for meeting learning outcomes in summer courses DL students, Grade 10-12, full courses Report on September 1701 through DL school DL students, Grade 10-12, part courses Report through Summer Learning, July count, NOT through DL school DL students, K-9 Report through Summer Learning, July count, NOT through DL school Questions: Kathy Cordner Ensures students do not pay tuition for meeting learning outcomes in summer courses DL students, Grade 10-12, full courses Report on September 1701 through DL school DL students, Grade 10-12, part courses Report through Summer Learning, July count, NOT through DL school DL students, K-9 Report through Summer Learning, July count, NOT through DL school Questions: Kathy Cordner

12
GradeMost 5 Most Frequent LeastRange KMathSocial StudiesScienceLang ArtsPers Planning170-202 1MathScienceSocial StudiesLang ArtsPers Planning137-233 2MathSocial StudiesScienceLang ArtsPers Planning137-247 3MathScienceSocial StudiesLang ArtsPhys Ed175-241 4MathLang ArtsScienceSocial StudiesPers Planning240-259 5MathLang ArtsScienceSocial StudiesPhys Ed277-291 6MathLang ArtsScienceSocial StudiesPhys Ed284-311 7Lang ArtsSocial StudiesMathSciencePhys Ed283-313 8MathSocial StudiesLang ArtsSciencePhys Ed382-576 9MathLang ArtsScienceSocial StudiesPhys Ed420-719 10PlanningEnglishPhys EdMath (Princ)Social Studies676-1,016 11Social StudiesEnglishMath (Princ)Math (Essent)Biology227-733 12EnglishMath (Princ)BiologyCommunicationsFamily Studies241-707 Course Variety and Popularity:
Social Studies676-1,016 11Social StudiesEnglishMath (Princ)Math (Essent)Biology EnglishMath (Princ)BiologyCommunicationsFamily Studies Course Variety and Popularity:")
13
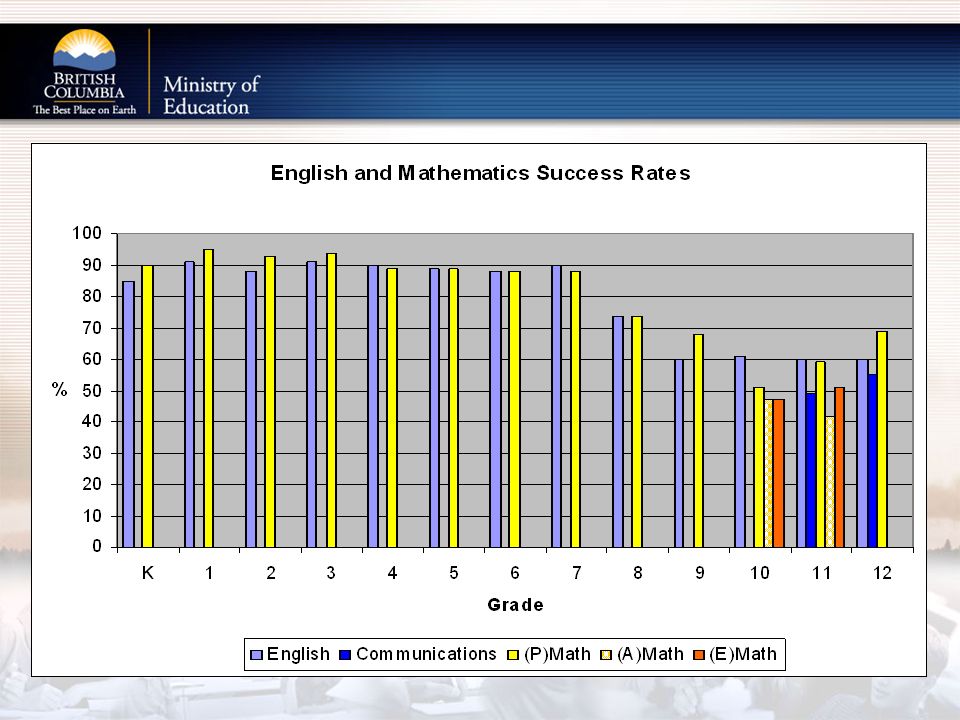
Course Variety by Course Grade

16
DL Agreements Where? 46 Boards operating 51 schools in 07/08 4 new agreements replaced 4 boards that did not renew Changes in 08/09 Agreement to participate in Quality Review School Act requirement for Board to obtain permission for all DL activity, even if not funded as DL school Boards to ensure that all schools understand that supporting DL is not just a DL school requirment. Support Education Guarantee by not charging tuition fees to Graduate Adults taking courses through LNBC Where? 46 Boards operating 51 schools in 07/08 4 new agreements replaced 4 boards that did not renew Changes in 08/09 Agreement to participate in Quality Review School Act requirement for Board to obtain permission for all DL activity, even if not funded as DL school Boards to ensure that all schools understand that supporting DL is not just a DL school requirment. Support Education Guarantee by not charging tuition fees to Graduate Adults taking courses through LNBC

17
DL Standards Part of DL Agreement Purposes Align administrative practices DL Program evaluation Professional development DL content evaluation Components Delivery Standards Content Development Standards Part of DL Agreement Purposes Align administrative practices DL Program evaluation Professional development DL content evaluation Components Delivery Standards Content Development Standards Roadmap Version 1: 2006 Version 2: 2007 Version 3: 2008 Input Quality Review leanings Emerging national and international standards BC experience with Version 2 Internal Review Toolkit to assist DL schools with self-assessment

18
DL Audits Where? 6 Districts: Qualicum (69), Southeast Kootenay (5), Nechako Lakes (91), Alberni (70), Coquitlam (43), Nicola-Similkameen (58) S.E. Kootenay a re-audit When? March 31 – April 18 Districts receive final reports in May DL Agreements for audited districts held until audit reports complete Possible Impacts FTE recovery Special considerations in DL Agreement Re-audits Where? 6 Districts: Qualicum (69), Southeast Kootenay (5), Nechako Lakes (91), Alberni (70), Coquitlam (43), Nicola-Similkameen (58) S.E. Kootenay a re-audit When? March 31 – April 18 Districts receive final reports in May DL Agreements for audited districts held until audit reports complete Possible Impacts FTE recovery Special considerations in DL Agreement Re-audits
, Southeast Kootenay (5), Nechako Lakes (91), Alberni (70), Coquitlam (43), Nicola-Similkameen (58) S.E. Kootenay a re-audit When. March 31 – April 18 Districts receive final reports in May DL Agreements for audited districts held until audit reports complete Possible Impacts FTE recovery Special considerations in DL Agreement Re-audits Where. 6 Districts: Qualicum (69), Southeast Kootenay (5), Nechako Lakes (91), Alberni (70), Coquitlam (43), Nicola-Similkameen (58) S.E. Kootenay a re-audit When. March 31 – April 18 Districts receive final reports in May DL Agreements for audited districts held until audit reports complete Possible Impacts FTE recovery Special considerations in DL Agreement Re-audits.")
19
Quality Review Pilots Quality Review Pilots Spring 2008 10 sites “volunteered” Kootenay LakeVernonCentral Okanagan AbbotsfordLangleyDelta BurnabyPeace River South Peace River NorthSaanich DL viewed differently by district offices, no longer viewed as cash cow Educational technology innovation found in the DL school and/or in the district Some old practices still around Focus on completion and satisfaction 19 April 2008

20
Interesting Quality Review Practices... Use of synchronous tools and events Development of online presence Creation of cohort groups Blending learning (F2F with online) Project-based work Portfolio assessment strategies Enhanced use of video Student-led and controlled technologies designing a game in Elluminate, e.g. 20 April 2008
 Project-based work Portfolio assessment strategies Enhanced use of video Student-led and controlled technologies designing a game in Elluminate, e.g. 20 April")
22
What’s a Cohort? July 1 06 Oct 15 06 28,000 Active Courses Dec 7 07 Data Collection

23
Cohort Success Rate Calculation

24
Withdrawal – for Reason Student deceased Serious illness or disability The student has given birth A student’s permanent residence has moved out of province. Incarcerated Family reasons (non-trivial) Student has transitioned to a different school as a result of meeting a goal articulated in an IEP or other plan Dynamic of brick and mortar school has changed. Student has recovered from illness or therapy and is ready to transition to brick and mortar school.
 Student has transitioned to a different school as a result of meeting a goal articulated in an IEP or other plan Dynamic of brick and mortar school has changed. Student has recovered from illness or therapy and is ready to transition to brick and mortar school..")
25
Student Success: September 06 Cohort Grade Range # of Schools Average Size Success Rate K-7407589% 8-124530265%

26
Secondary Success Rates: 1 st 2006 Cohort Success Rate Range # of Schools Avg School Size (Headcount) <40%379 41-50%6353 51-60%6280 61-70%9448 71-80%9423 81-90%10170 91-100%213 Provincial45302 No overall relationship between size and results.
 <40% % % % % % %213 Provincial45302 No overall relationship between size and results.")
Similar presentations


 is for an.>")


 in communities across the.>")


 August 24, 2010 TIMING OF THE RUTLAND AREA GRADE CONFIGURATION.>")


