Download presentation
Presentation is loading. Please wait.

1
A. Baldini PSI 18 July 2007 MEG Overview Cobra (W. Ootani) LXe calorimeter (S. Mihara) Calibrations (G. Signorelli) Drift Chambers (J. Egger) Timing counter (F. Gatti) Electronics and DAQ (M. Grassi) Software (R. Sawada) Schedule
 LXe calorimeter (S. Mihara) Calibrations (G. Signorelli) Drift Chambers (J. Egger) Timing counter (F. Gatti) Electronics and DAQ (M. Grassi) Software (R. Sawada) Schedule.")
2
The shielding and grounding scheme was improved after the December run. There hasn’t been no unexpected shutdown since then. No shutdown for ~10 days with SC+NC+Bypass during shutdown period. No shutdown for ~10 days with SC + (BTS) after accelerator started to run. The problem by the external noise seems fixed. Quench Problem Status (W. Ootani) A new problem happened during CW accelerator testing. COBRA was unexpectedly shutdown after 40 hrs operation. Still under investigation, but it seems there was a problem with NC power supply according to the measured waveform.
 after accelerator started to run. The problem by the external noise seems fixed. Quench Problem Status (W. Ootani) A new problem happened during CW accelerator testing. COBRA was unexpectedly shutdown after 40 hrs operation. Still under investigation, but it seems there was a problem with NC power supply according to the measured waveform..")
3
Xenon detector (S. Mihara) Honeycomb panel test completed 3 rd panel delivered to Pisa at 16:30 on 20/Feb Mounted on the text box and tested on 22, 23/Feb –3 bar –Inspection by a Plyform expert –4 bar x4 times Hold for 3 minutes at 4 bar in the last test –Panel deformation (max) 0.3 mm at 1 bar 3.4 mm at 4 bar Holes for evacuation
 Honeycomb panel test completed 3 rd panel delivered to Pisa at 16:30 on 20/Feb Mounted on the text box and tested on 22, 23/Feb –3 bar –Inspection by a Plyform expert –4 bar x4 times Hold for 3 minutes at 4 bar in the last test –Panel deformation (max) 0.3 mm at 1 bar 3.4 mm at 4 bar Holes for evacuation.")
4
Cryogenic Test at SIMIC -18/May –All nuts on the covers of the cold vessel were fastened tightly and the warm vessel was evacuated whole weekend. 21/May –He leak test. 1.8Bar He was filled and found that the leak rate was larger than 10 -4 mbarl/sec. Keep evacuation during the night. 22/May –cooling using cold gas from the LN2 tank. Cold gas in the cold vessel Most parts were cooled down to -5~-10 degree C. 23/May –liquid N2 through the cooling pipe. All parts cooled below -110 degreeC around 12:00. –Then N2 gas at 1.0Bar and He gas filled step by step with measuring leak rate. N2 1.0 bar He 0.2 bar 5x10 -7 mbarl/sec N2 1.0 bar He 0.4 bar 1.6x10 -6 mbarl/sec N2 1.0 bar He 0.6 bar 7.8x10 -6 mbarl/sec N2 1.0 bar He 0.8 bar 2.2x10 -5 mbarl/sec The leak was not fixed at SIMIC by any means. We decided to bring the cryostat to PSI and perform a leak test

5
Cryostat arrived at PSI Delivery at 7:00 am on 5/June Works to be done Cleaning Leak/pressure test Alignment –PMT installation –…

6
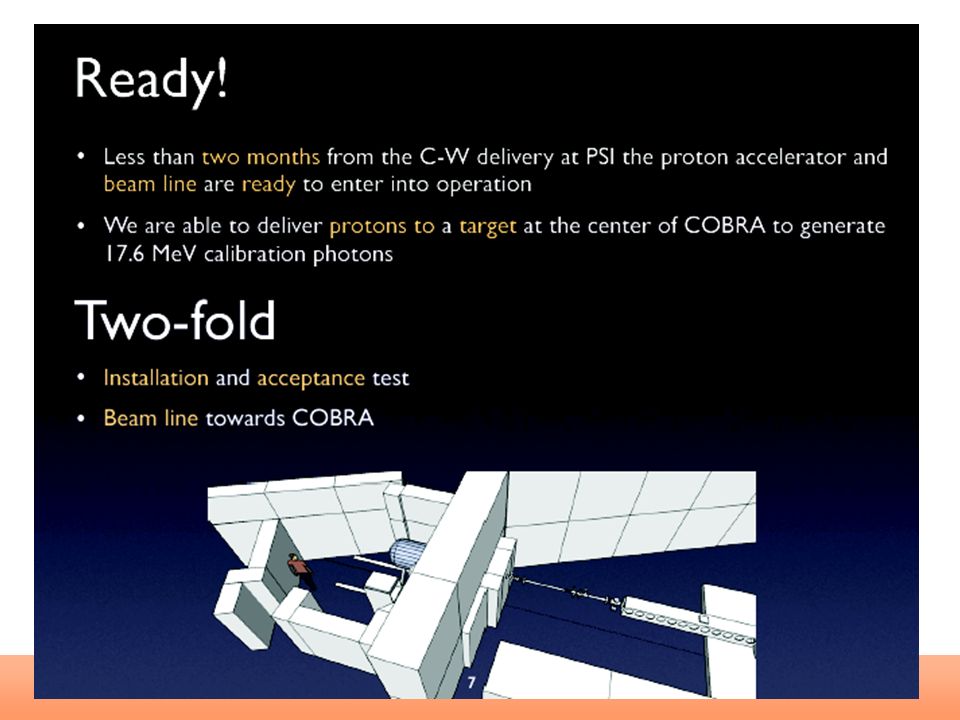
CW received on middle of may (G. Signorelli)
")
8
LED PMT Gain Higher V with light att. Can be repeated frequently alpha PMT QE & Att. L Cold GXe LXe Laser (rough) relative timing calib. < 2~3 nsec Nickel Generator 9 MeV Nickel γ-line NaI Polyethylene 0.25 cm Nickel plate 3 cm 20 cm quelle on off Illuminate Xe from the back Source (Cf) transferred by comp air on/off Proton Acc Li(p, )Be LiF target at COBRA center 17.6MeV ~daily calib. Can be used also for initial setup K Bi Tl F Li(p, 0) at 17.6 MeV Li(p, 1) at 14.6 MeV radiative decay 0 - + p 0 + n 0 (55MeV, 83MeV) - + p + n (129MeV) 10 days to scan all volume precisely (faster scan possible with less points) LH 2 target e+e+ e-e- e e Lower beam intensity < 10 7 Is necessary to reduce pile- ups Better t, makes it possible to take data with higher beam intensity A few days ~ 1 week to get enough statistics Xenon Calibration
 relative timing calib. < 2~3 nsec Nickel Generator 9 MeV Nickel γ-line NaI Polyethylene 0.25 cm Nickel plate 3 cm 20 cm quelle on off Illuminate Xe from the back Source (Cf) transferred by comp air on/off Proton Acc Li(p, )Be LiF target at COBRA center 17.6MeV ~daily calib. Can be used also for initial setup K Bi Tl F Li(p, 0) at 17.6 MeV Li(p, 1) at 14.6 MeV radiative decay 0 - + p 0 + n 0 (55MeV, 83MeV) - + p + n (129MeV) 10 days to scan all volume precisely (faster scan possible with less points) LH 2 target e+e+ e-e- e e Lower beam intensity < 10 7 Is necessary to reduce pile- ups Better t, makes it possible to take data with higher beam intensity A few days ~ 1 week to get enough statistics Xenon Calibration.")
9
DC (J. Egger)
")
10
4 Levels of test 1.Pretest HV Air + tightness 2.Aquarium : functionality + tightness 3.Cosmics Lab : other preamps + correct signal assignment inside COBRA up to panel 4.Cosmics E5, with and without COBRA

11
DC test with Cosmic ray (in Lab.)
")
12
cosmic ray counter for DC wire alignment 10 counters (10 plastic scintillators + 20 PMTs) are prepared DC wire alignment will be performed w/o COBRA field
 are prepared DC wire alignment will be performed w/o COBRA field")
13
TC: F. Gatti

14
TC: MC vs data: E loss in bars

15
6 years of operation !!

18
Positron efficiency Confirmed by a 3° calculation including PR, tracking and fitting from DC to TC

19
Trigger installation Positrons from “off-centre” -decays and hitting DCH outer frame missing hits

20
Trigger installation Where do they come from? x (cm) y (cm) Front view (x-y) of -decay vertices on the target all events 2 >50 || N 1 <5 Source of inefficiency for the TC
 y (cm) Front view (x-y) of -decay vertices on the target all events 2 >50 || N 1 <5 Source of inefficiency for the TC.")
21
Trigger installation Way(s) out? Reduction of beam spot size on the target? ( x,y 1.1 cm 0.5 cm) –is it achievable by shrinking the target (not this year) –Background ? Investigate... Increase of the magnetic field? –shrinking of the bending radius by 1 cm needed increase of B by 7% (B 0 = 1.26 T 1.35 T) distortion of hit pattern on TC? might it affect COBRA behaviour?...
 –is it achievable by shrinking the target (not this year) –Background . Investigate... Increase of the magnetic field. –shrinking of the bending radius by 1 cm needed increase of B by 7% (B 0 = 1.26 T 1.35 T) distortion of hit pattern on TC. might it affect COBRA behaviour ....")
22
Trigger installation Multi-threading model VME Transfer Thread Calibration Thread Calibration Thread Calibration Thread Calibration Thread Collector Thread VME Round-Robin distribution Network Zero-copy ring buffers Electronics and DAQ: M. Grassi

23
Trigger installation DRS Readout rate Optimal readout rate of DRS full waveforms with 4 calibration threads: 30 events/s During Dec 06 run max readout at 7 events/s –Double event readout –Code optimization –Single calibration thread

24
Trigger installation DAQ rate vs. amount of data DAQ speed is not a limiting factor The total data size needs solution: –30 Hz is maximal VME speed for full waveforms → >270 MB/sec –Data transmission limit is 20 MB/sec (=250TB/year) → need online reduction 10x (M. Grassi’s and R. Sawada’s talk) –Storage limit is 30 TB/year → need offline reduction 8x (R. Sawada’s talk)
 → need online reduction 10x (M. Grassi’s and R. Sawada’s talk) –Storage limit is 30 TB/year → need offline reduction 8x (R. Sawada’s talk).")
25
Trigger installation Conclusions Splitters: installed, operational, expected performances, test in Dec 06 Fiber preamp: problem with an IC fixed, test passed, mounted on the TC detector, installation in Aug 07 Hit registers: mezzanine boards produced, FPGA firmware ready (PSI GPVME board), installation in Aug 07 Trigger: installed, operational, built-in debugging and control tool, need tuning after detector turn on, test in Dec 06 DRS2: installed, operational, good for timing, temperature dependence, usable with DC DRS3: prototype test phase, final solution, not available in 2007 Aux digitizer: production problem solved, prototype test completed successfully, ready for 2007 run DAQ: installed, operational, good performances, test in Dec 06 run The electronics and the DAQ systems are expected to be ready for the 2007 run
, installation in Aug 07 Trigger: installed, operational, built-in debugging and control tool, need tuning after detector turn on, test in Dec 06 DRS2: installed, operational, good for timing, temperature dependence, usable with DC DRS3: prototype test phase, final solution, not available in 2007 Aux digitizer: production problem solved, prototype test completed successfully, ready for 2007 run DAQ: installed, operational, good performances, test in Dec 06 run The electronics and the DAQ systems are expected to be ready for the 2007 run")
26
A. Baldini PSI 18 July 2007 Software (R. Sawada)
")
27
A. Baldini PSI 18 July 2007

28
Pdf’s – 1) e+e+e+e+ Signal RD Accidental Signal RD Accidental All pdfs normalized to 1 and summed by relative weights of different types of events. Positron FWHM improved from 1.0 0.8 %; photon FWHM improved from 6.5 5 %. FWHM = 0.8 % FWHM = 5 %

29
A. Baldini PSI 18 July 2007 Pdf’s - 2) tttt Signal + RD Accidental (assumed flat) Signal Accidental (assumed flat in cos ) RD t assumed flat for accidental and gaussian for signal/RD (MC results predict gaussian shape, but with worse resolution); taken from MC (results close to the proposal FWHM). FWHM = 180 ps FWHM 1 o
 tttt Signal + RD Accidental (assumed flat) Signal Accidental (assumed flat in cos ) RD t assumed flat for accidental and gaussian for signal/RD (MC results predict gaussian shape, but with worse resolution); taken from MC (results close to the proposal FWHM). FWHM = 180 ps FWHM 1 o.")
30
A. Baldini PSI 18 July 2007 Sensitivity result Three different sets of windows: results do not depend on the cuts. Three different sets of windows: results do not depend on the cuts. The sensitivity limit is The sensitivity limit is 2.15 x 10 -13 2.15 x 10 -13 equivalent to the sensitivity that one obtains with a box equivalent to the sensitivity that one obtains with a box analysis assuming 0 bck. analysis assuming 0 bck. (not surprising). (not surprising). Important point: the spill-in Important point: the spill-in of bck events within the signal region is automatically of bck events within the signal region is automatically taken into account by the taken into account by the knowledge of the bck pdf. knowledge of the bck pdf. 2.15 x 10 -13 of “null” experiment N.B. Empty circles & crosses shifted by 0.05 on B.R. axis for clarity.
. (not surprising). Important point: the spill-in Important point: the spill-in of bck events within the signal region is automatically of bck events within the signal region is automatically taken into account by the taken into account by the knowledge of the bck pdf. knowledge of the bck pdf x of null experiment N.B. Empty circles & crosses shifted by 0.05 on B.R. axis for clarity..")
31
A. Baldini PSI 18 July 2007 Advantage: boundary effect Box analysis window Likelihood analysis window 0 events in box analysis Box analysis window Likelihood analysis window 1 event in box analysis Box analysis: quote a worse upper limit, with a “sudden jump”. Likelihood analysis: treated as a bck fluctuation, likelihood value only slightly changed upper limit increases by a small amount and continuously.

32
MEG status report 32 PSI: February 14th 2007 Conclusions First result: very good agreement of rates predicted by MC no significant unwanted backgrounds !!

33
A. Baldini PSI 18 July 2007 Schedule

34
A. Baldini PSI 18 July 2007

Similar presentations


 Giovanni Signorelli Istituto Nazionale di.>")


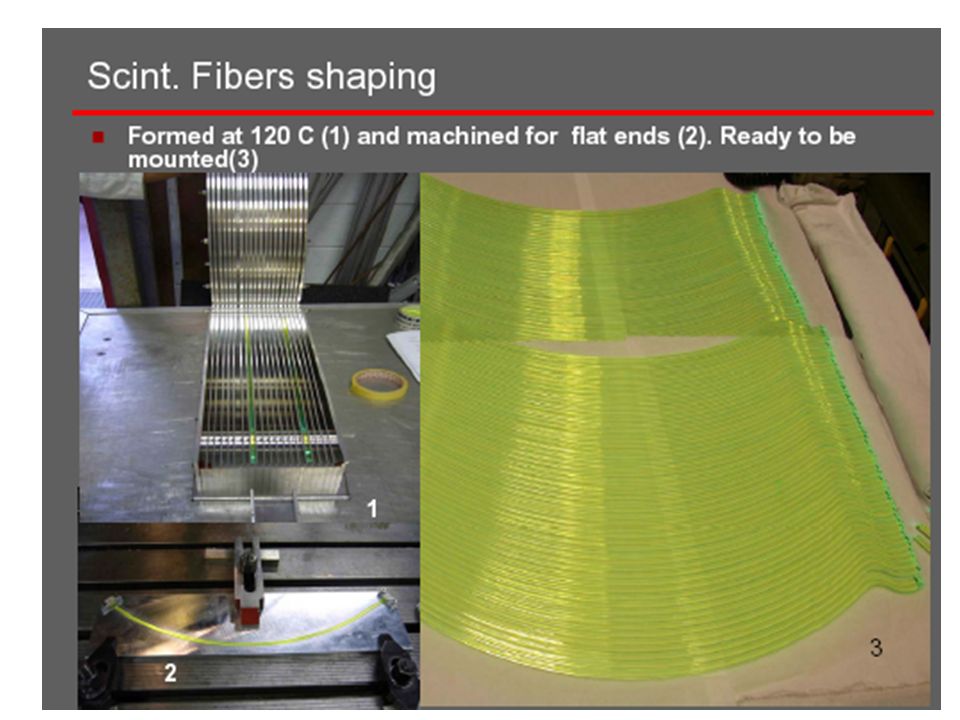
. The small size of the fibers (5X5mm) results.>")

 JPS 2010 Spring meeting, Okayama University1 MEG 実験による e 探索 Run2009 東京大学素粒子物理国際研究センター 岩本敏幸 他 MEG コラボレーション.>")


