Download presentation
Presentation is loading. Please wait.

1
The Essentials of e-asTTle 2015

2
ILPs Console Reports Marking and data input Marking and data input The SOLO Taxonomy The SOLO Taxonomy What Next Profile Rules of engagement Rules of engagement GLPs Indiv. Question Analysis Indiv. Question Analysis Assessment Misconceptions Assessment Misconceptions It’s like High Jump It’s like High Jump Creating writing tests Creating writing tests Creating adaptive tests Creating adaptive tests Creating customised tests Creating customised tests Designing tests Copying tests, similar tests Copying tests, similar tests ILP Writing Tabular Report Progress Reports Progress Reports Manage Students - Groups etc. Manage Students - Groups etc. Curr. Levels Report Curr. Levels Report Naming tests Target Setting Student Result Summary Student Result Summary Accessing e-asTTle Accessing e-asTTle

3
Seminar Overview Welcomes, Introductions Principles of e-asTTle How e-asTTle works - rules of engagement Thinking differently about testing – Item Response Theory Assessment misconceptions Test creation Customised and Adaptive Tests Copy tests and Similar tests Writing test overview Administration considerations Reports & next steps Interpreting the reports (incl Target Setting and Student Result Summary) for multiple purposes Reflection and Evaluation
 for multiple purposes Reflection and Evaluation")
4
Basic Rules of Engagement The data needs to be used to inform teaching and learning. Students should use this assessment and its reports to help understand their current skills and knowledge and inform their learning goals. In order to provide accurate results, and useful data, testing needs to be done by current achievement level, not year group. The results need to be interpreted alongside other evidence to ensure that good teaching and learning decisions are made. A student’s test score in NOT an Overall Teacher Judgment as it simply does not even come close to encompassing the broad set of skills and knowledge described in the standards.

5
Think differently about testing – changing our hardwired thinking

6
Hardwired #1 - “Everyone needs to do the same test for a fair comparison” If students of wide ability take the same test it is really only the ‘average’ sector where any useful information will be gained. Getting too many right or wrong provides us with very little information. Implication Test students on current achievement levels, not age. It may be necessary to create up to four different tests for some cohorts. Each student is then assigned to a test which is challenging for him/her.

7
Hardwired #2 - “100% is the goal?” If we want to get good information from e-asTTle, the students need to get some answers wrong. A student that gets 100% correct gives little information on his/her next learning steps and e-asTTle has to extrapolate to give an indication of achievement. This is not necessarily an accurate score. Implication We must assign a test that is challenging for each and every student.

8
Hardwired #3 - “Everyone must take the test at the same time in the same place” e-asTTle provides the opportunity/challenge to test students at different times and places, especially when taking an online test. Students can even sit a test at home if that is something you want to happen. The MAIN PURPOSE of the test will dictate when, where and how testing can take place.

9
Hardwired #4 - “e-asTTle means you take the test on the computer” In many cases computer based testing is the best way forward. However, paper based testing should also be considered depending on your situation. Paper based testing is the recommended method for areas such as Geometry or Measurement where interaction with graphics is required. Use of the reading passage booklet is a great hybrid option

11
Creating Tests The following tests can be created: A Customised Test An Onscreen Adaptive Test A Writing Prompt And the following actions can also occur: Copy an Existing Test Create a Similar test Add Numeracy Data

12
Customised Tests Customised Test This test is customised by the user and the process allows the person creating the test to select from a range of curriculum strands, different processes or time and control features, such as on-line versus paper.

13
Designing customised tests

14
Differentiating Customised Tests – the planning stage L2L3L4L5L6 Duration Easy (A) 80%20% 30 min Easy/Mid (B) 50% 30 min Mid/Diff (C) 50% 36 min Difficult (D) 50% 36 min
 80%20% 30 min Easy/Mid (B) 50% 30 min Mid/Diff (C) 50% 36 min Difficult (D) 50% 36 min")
15
Differentiated Customised Tests – Example 1 L2L3L4L5L6 Duration Easy (A) 80%20% 30 min Easy/Mid (B) 50% 30 min Mid/Diff (C) 10%60%30% 36 min Difficult (D) 10%60%30% 36 min
 80%20% 30 min Easy/Mid (B) 50% 30 min Mid/Diff (C) 10%60%30% 36 min Difficult (D) 10%60%30% 36 min")
16
Differentiating Customised Tests – the implementation stage L2L3L4L5L6 Duration Easy (A)80%20%30 min (A) Actual17530 min Easy/Mid (B) 50% 30 min ( B) Actual101230 min Mid/Diff (C) 20%60%20%36 min (C) Actual716436 min Difficult (D) 20%60%20%36 min (D) Actual617736 min
80%20%30 min (A) Actual17530 min Easy/Mid (B) 50% 30 min ( B) Actual min Mid/Diff (C) 20%60%20%36 min (C) Actual min Difficult (D) 20%60%20%36 min (D) Actual min")
17
What can you tell me about these tests? 1.“Reading test” 2.“Maths March 12” 3.“CL4PAPSIdMar12” 4.“AL23NknNOpAlgNov11”

18
Naming tests It is well worth coming up for a system of naming tests, particularly if you are making them for other teachers to use as well. For example, if I created a mainly level 3 Probability and Stats test which is the second most difficult test in a group of tests it could be named like this. BL3ProbStatsMarch12

19
Facilitator modelling Facilitator to model online the creation of the following test Name L2L3L4L5L6DurationStrandsAttitudePaper or Online CL3/4PSPAIdMar15 50 40Proc & Strat. Purpose & Aud. Ideas Interest Reading Online

20
Time to have a go… Create a customised test Think about a group of students from your school and design a test that will be challenging for them. Plan on the design page first e-asTTle Training site – Teacher login https://training.e-asttle.education.govt.nz/SCWeb/login.faces e-asTTle Training site – Student login https://training.e-asttle.education.govt.nz/StudentWeb/login.faces e-asTTle on TKI http://e-asttle.tki.org.nz/

21
Online Adaptive tests Online Adaptive Test The user can choose strands and curriculum levels and the test adapts twice during the test to give easier or harder sets of questions to the student. There is less control over the content and type of questions. It is completed online and only has closed questions.

22
Adaptive test – how it works

23
Time to have a go… - create an adaptive test Use a group of students from your school and design a test that will be suitable (challenging) for them. Again, plan on the design sheet first What’s will you have to do different this time?

24
Creating a writing prompt e-asTTle writing assesses students’ writing from Years 1 – 10 It assess their ability to write continuous texts across a variety of communicative purposes- describe, explain, recount, narrate & persuade It assesses generic writing competence rather than writing specific to any learning area Writing tests can only be completed on paper Students respond to a prompt The time given for a writing test is up to 40 minutes and is preset.

25
Creating a similar, or copying a test. Why would you do this? Copying a test allows you to use the same test with a different group of students. Copying rather than reassigning the same test allows you to keep the two sets of data separate. Creating a similar test means that you can create a test using the same settings as previously but it will result in a new set of questions. A better option if testing the same set of students again is to create a slightly harder test. This will be a better fit for the students as it acknowledges the progress they have made throughout the year.

27
Closed questions (i.e. multi choice or true/false type questions) do not require any data input or marking. The programme marks them automatically Open questions are marked by question with student responses clustered. Online tests – Marking open response questions
 do not require any data input or marking. The programme marks them automatically Open questions are marked by question with student responses clustered. Online tests – Marking open response questions.")
28
Entering Paper Tests data

29
Entering e-asTTle Writing scores

31
e-asTTle Reports

33
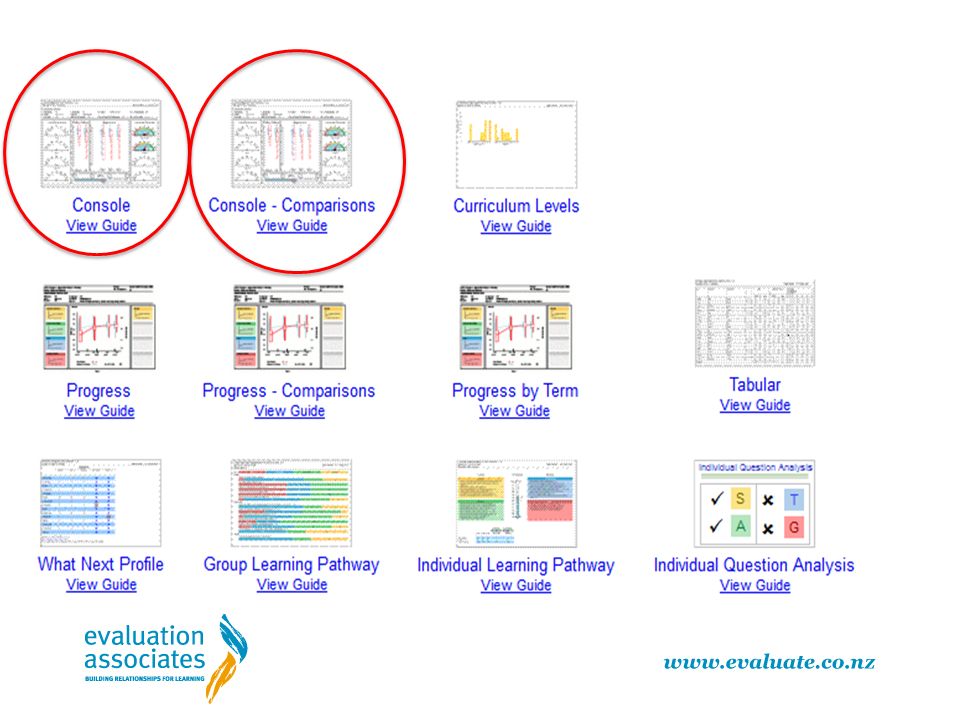
The Console Reports

34
The Console Comparisons Report (Maori)
")
35
The Console Comparisons Report (Schools like mine)
")
36
The Multi-test Console Report

37
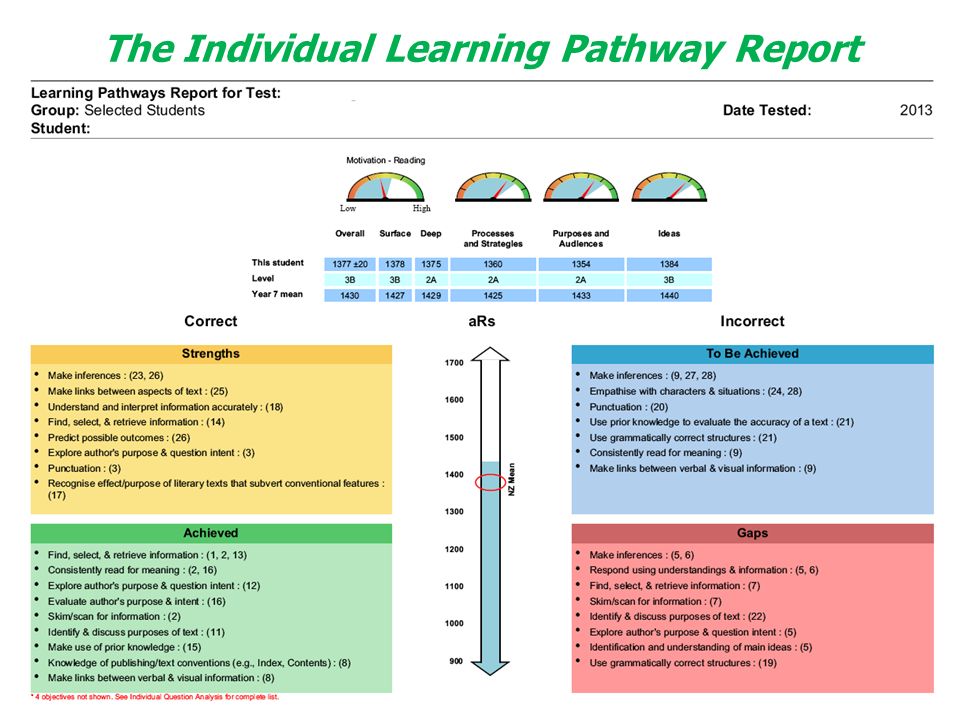
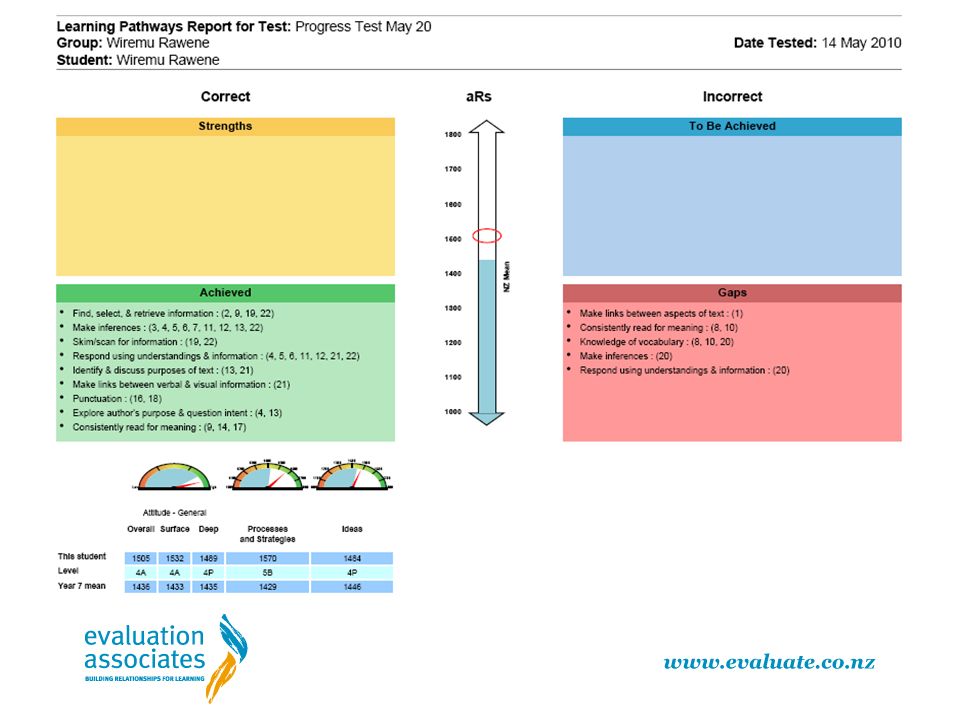
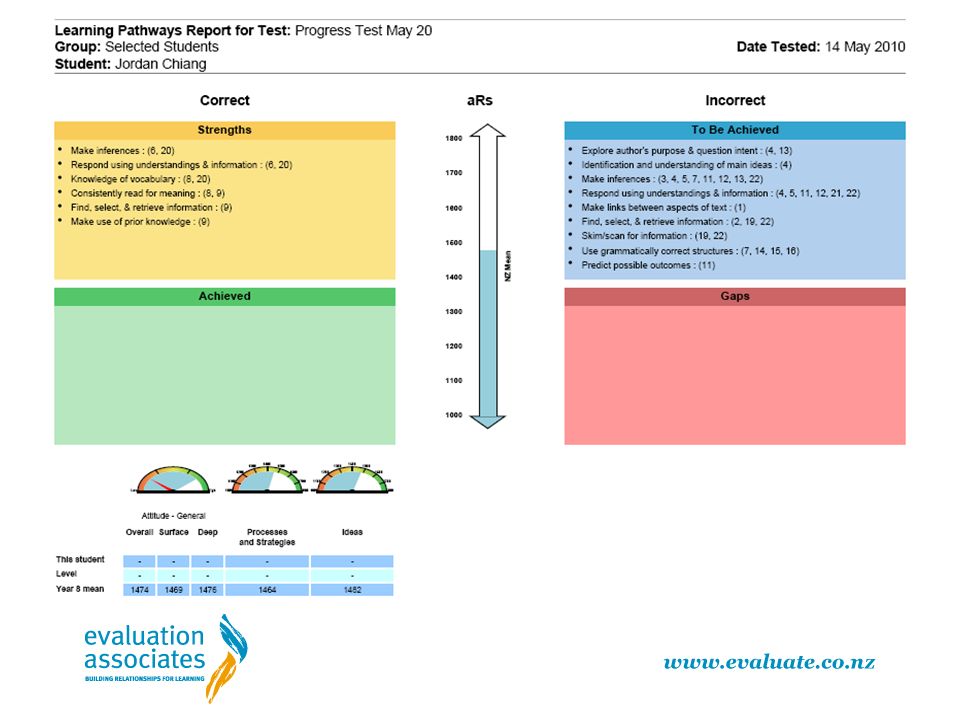
The Individual Learning Pathway Report

39
The ILP Report - Student Speak

40
One standard error of measurement around the students score (± 15) This is like the 'margin of error' reported in political polls Two out of three times the student’s true score will lie somewhere between the top and the bottom of the red circle A difference in scores needs to be >22 to be ‘statistically significant’ The Individual Learning Pathway Report - Norm information
 This is like the margin of error reported in political polls Two out of three times the student’s true score will lie somewhere between the top and the bottom of the red circle A difference in scores needs to be >22 to be ‘statistically significant’ The Individual Learning Pathway Report - Norm information")
41
The Individual Learning Pathway Report - Criterion information When a dash “ – “appears in the e-asTTle ILP it means that the student has failed to get more than 3 questions correct in that strand. If a dash appears in the overall score it means the student has not achieved three correct answers in the test.

42
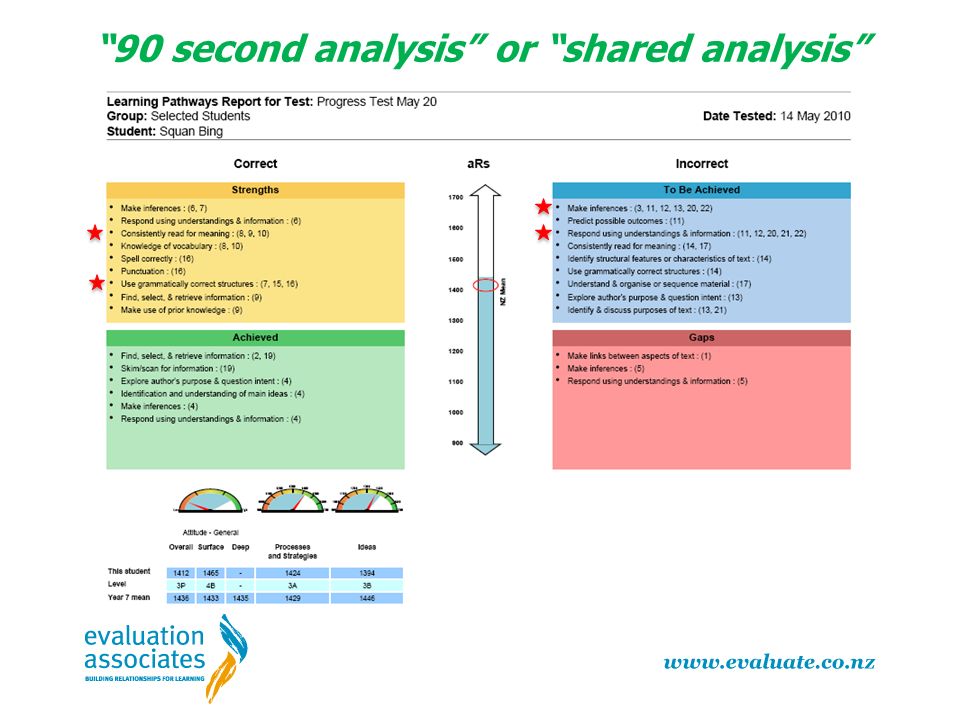
Unexpectedly correct Harder than student’s overall ability Strengths Unexpectedly wrong Easier than or equal to the student’s overall ability Gaps Correct as expected Easier than or equal to the student’s overall ability Achieved Wrong as expected Harder than student’s overall ability To Be Achieved Correct Easy Items for this student Incorrect Hard Items for this student The Individual Learning Pathway Report - Interpreting the quadrants

43
Harder than the student’s ability but unexpectedly answered correctly. Given the students’ overall asTTle score these items are more difficult than his/her overall ability. This quadrant displays the student’s unexpected strengths that should be exploited in future teaching and learning. Strengths Easier than the student’s ability but unexpectedly, answered incorrectly. The teacher needs to investigate to determine the nature of the gap e.g. carelessness, skipping items, not taught. The teacher should eliminate as a concern or put in place a remedial plan. He/she should learn quickly and fill in the gap. Gaps Easier than the student’s ability and, as expected, answered correctly. Given the student’s overall asTTle score these are the items that were expected to be answered correctly and were. “The Green Light”. The teacher can confidently give the student more challenging work in these areas. Achieved Harder than the student’s ability and, as expected, answered incorrectly. Given the students’ overall asTTle score these are the items we expected him/her not to get right and did not. These are the areas that the student still has to achieve in and which it is expected the teacher will carry out more teaching. To Be Achieved The Individual Learning Pathway Report - Interpreting the quadrants

44
The Individual Learning Pathway Report - Interpreting the quadrants

47
“90 second analysis” or “shared analysis”

49
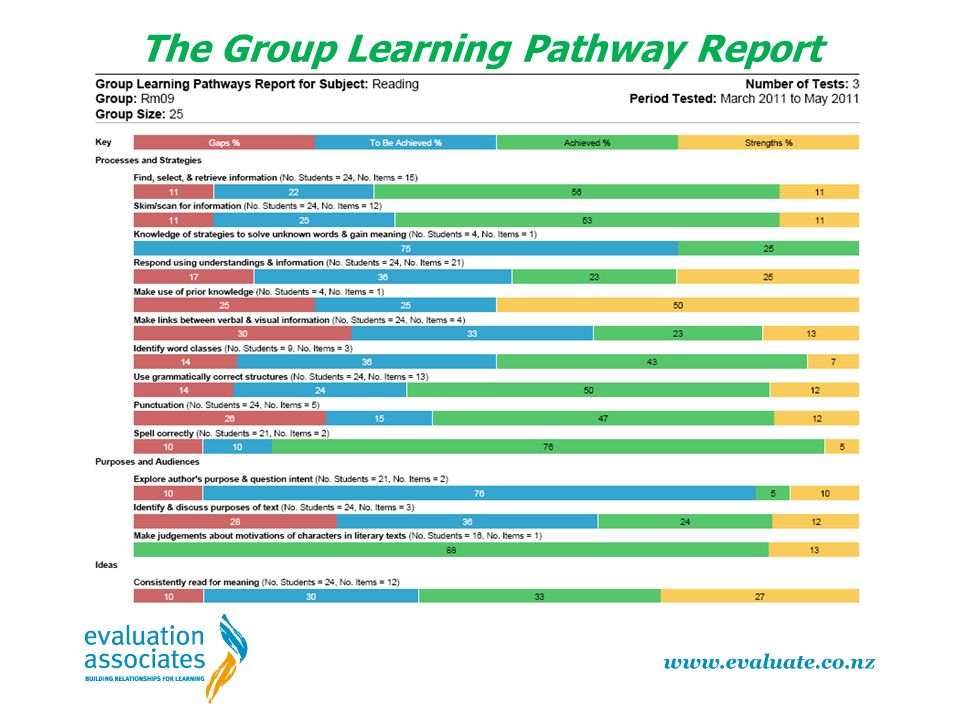
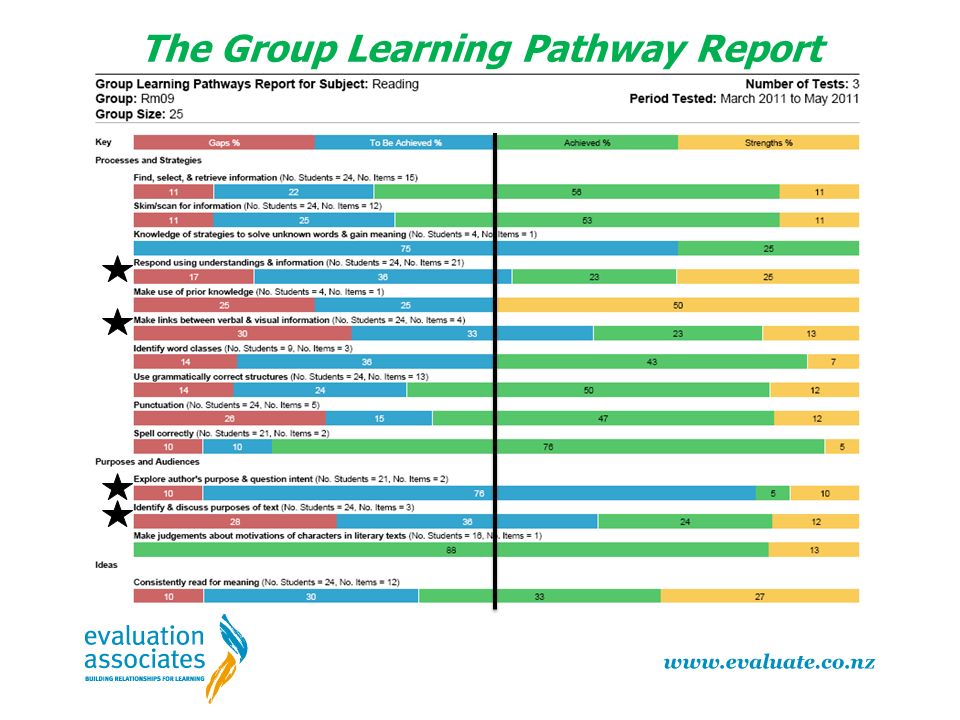
The Group Learning Pathway Report

50
Individual Question Analysis

51
Individual Question Analysis – Student Speak

52
The Group Learning Pathway Report

56
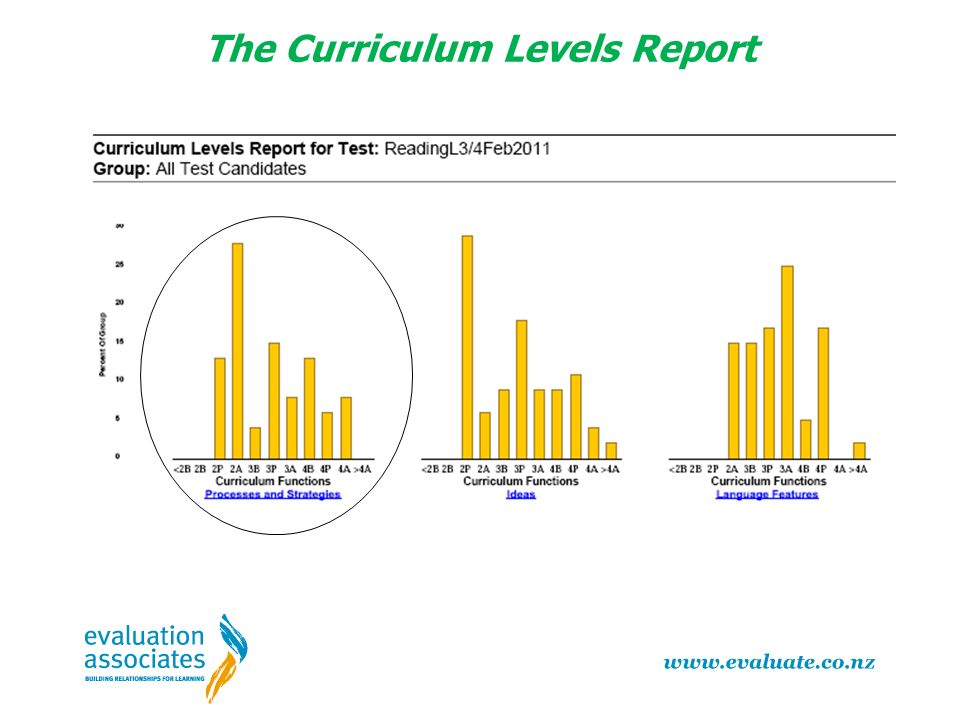
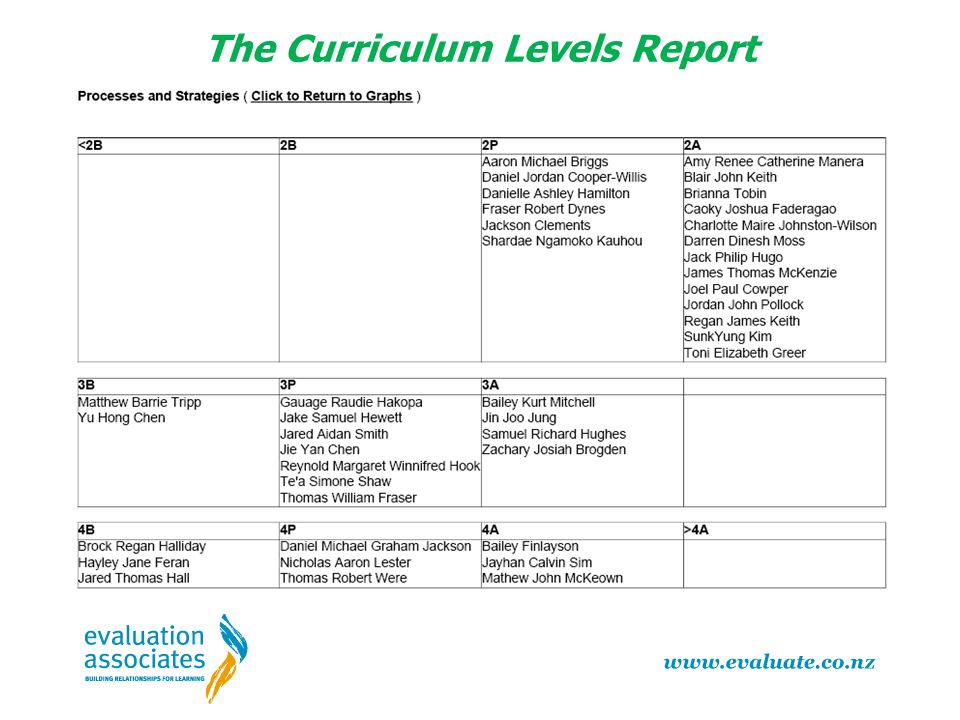
The Curriculum Levels Report

59
3P 3A 4A 2A The Curriculum Level Report (aka Skyline)
")
60
The Curriculum Levels Report

61
The What Next Profile – in e-asTTle online

62
The What Next Profile – on the TKI site http://assessment.tki.org.nz/Assessment-tools-resources/What-Next

63
The What Next Profile

64
The Curriculum Levels Report

65
The Tabular Report – Excel file (.csv)
")
66
The Tabular Report – Cut scores Use sub levels and scores Consider standard error of measurement

67
2A 3B 1374 1390 + 16 The Tabular Report – Cut scores 2P 1295 1342 + 47

68
The Progress Reports

69
The Progress Report – for 1 student

70
The Progress Report – for a group

71
The Progress Report – more than two assessments

72
Strengths Any element sublevel score two sublevels or more above the student’s overall score Gaps Any element sublevel score two sublevels or more below the student’s overall score Achieved Any element sublevel score within a sublevel of the student’s overall score Jade Battle’s overall score = 3B In Jade Battle’s case this would be scores of 3A and above In Jade Battle’s case this would be 2A, 3B or 3P. In Jade Battle’s case this would be scores of 2P and below. The Individual Learning Pathway Report - Writing

73
The Individual Learning Pathway Report - Writing

74
Manage Students Area

75
Manage students – Student details

76
Download Student Logins by PDF or csv (excel) As a PDF you can print out as a card, hand it to the student and receive back once the password has changed. To reset password go into “Manage existing students”, choose students and then click “reset password”.

77
Manage students – Using groups

78
Some groups will automatically be created when SMS data is imported. Most often Class, Year etc. However you can create custom groups that enable the viewing of reports etc. for that particular group By doing this you DO NOT need to test a certain group again. You can use existing data but just view reports for the selected students in your group Examples of custom groups could be: Your top reading group An extension or remedial group Maori boys or similar groups that need to be monitored Target students

79
Manage Students Area – Student result summary

80
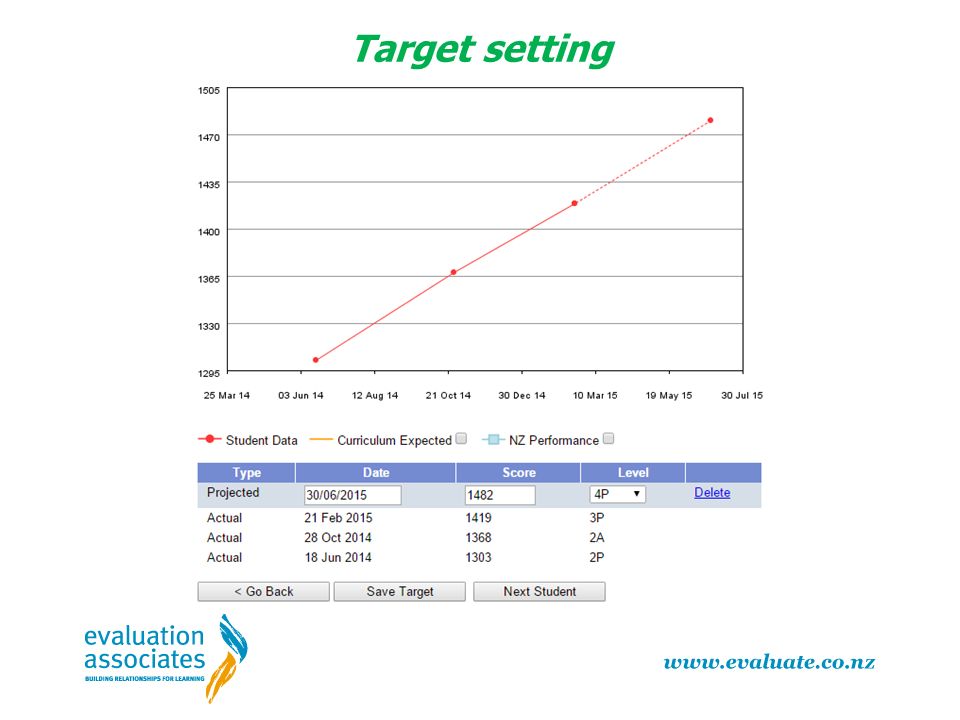
Target setting

82
The important learning conversation to be had? What do we need to focus on to help you achieve this target?

84
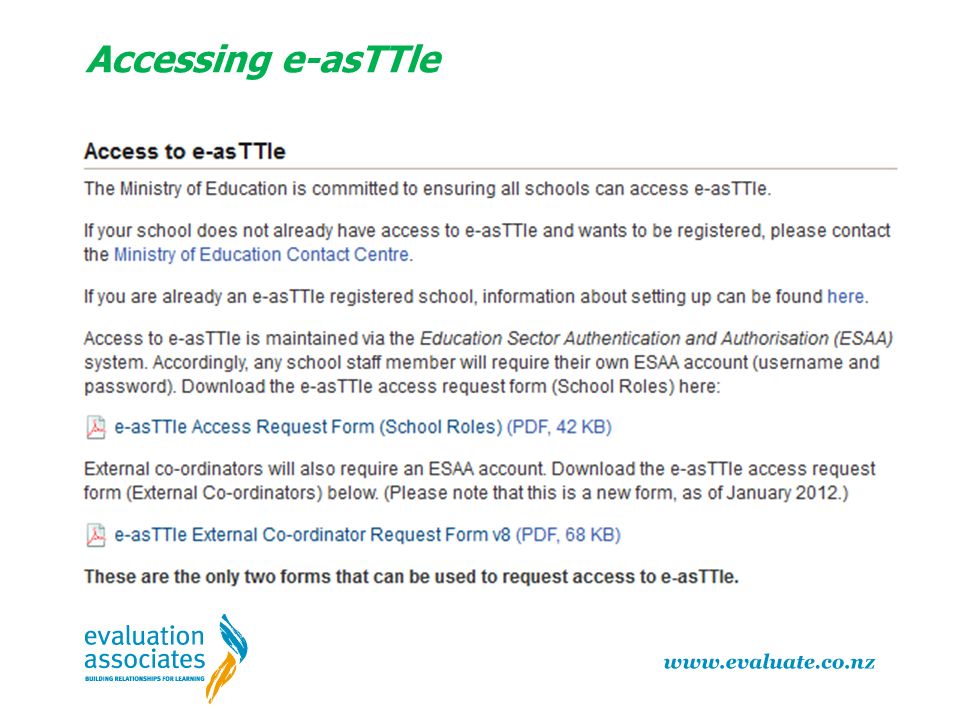
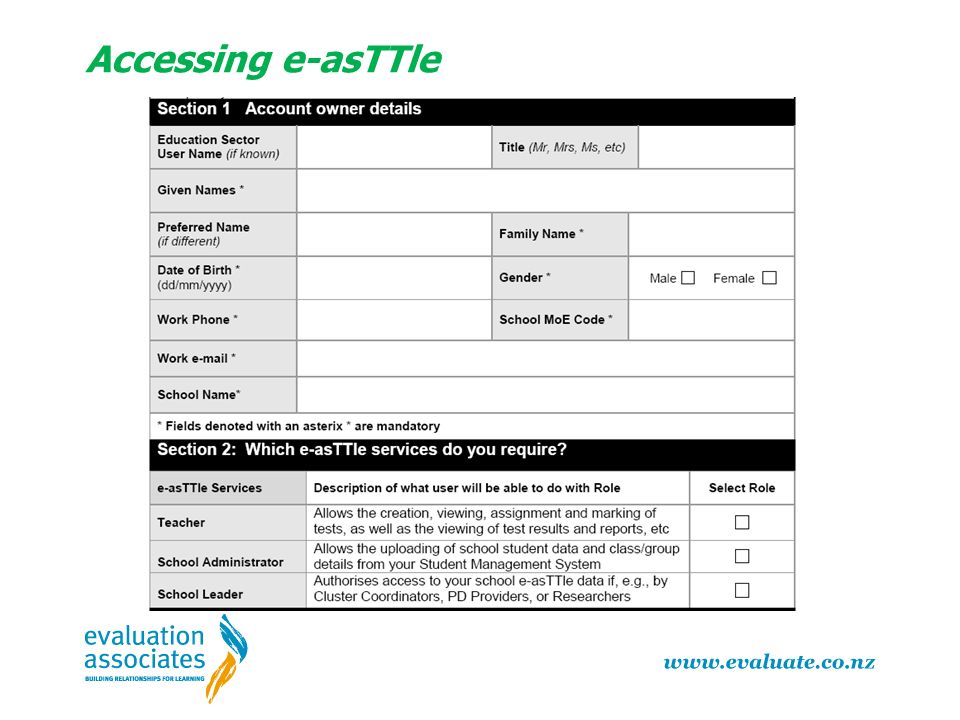
Accessing e-asTTle

88
Surface and Deep in e-asTTle The SOLO Taxonomy Structure of Observed Learning Outcomes (SOLO)
")
89
Surface and Deep in e-asTTle The SOLO Taxonomy e-asTTle uses the SOLO Taxonomy - Structure of Observed Learning Outcomes (SOLO) SURFACE(increase in quantity) Unistructural, Multistructural DEEP(change of quality) Relational, Extended Abstract
 SURFACE(increase in quantity) Unistructural, Multistructural DEEP(change of quality) Relational, Extended Abstract")
90
Surface Processes Unistructural require the knowledge or use of only one piece of given information, fact, or idea, obtained directly from the problem. Multistructural require knowledge or use of more than one piece of given information, fact, or idea, each used separately, or two or more distinct steps, with no integration of the ideas. This is fundamentally an unsorted, unorganised list.

91
Relational: integration of more than one piece of given knowledge, information, fact, or idea. at least two separate ideas are required that, working together, will solve the problem. Extended Abstract: higher level of abstraction. The items require the student to go beyond the given information, knowledge, information, or ideas and deduce a more general rule or proof that applies to all cases. Deep Processes

92
Maths Example Algebra: Patterns in Number How many sticks are needed for 3 houses? UNI How many sticks are there for 5 houses? ______ MULTI If 52 houses require 209 sticks, how many sticks do you need to be able to make 53 houses? ______ RELATIONAL Make up a rule to count how many sticks are needed for any number of houses. EXTENDED ABSTRACT Houses 123 Sticks 59__ Given:

93
Reading Example Goldilocks and the Three Bears “Whose house did Goldilocks go into?”UNI “What are three aspects about the way the bears live that tell us that the story is not a real life situation?” MULTI “Goldilocks eats thebaby bear’s food, breaks his chair, and sleeps in his bed. What does this tell us about the kind of person she is”? RELATIONAL “Why do nursery tales allow wild animals to act in human fashion?” EXTENDED ABSTRACT

94
SOLO Taxonomy Hattie, J.A.C., & Brown, G.T.L. (2004, September). Cognitive processes in asTTle: The SOLO taxonomy. asTTle Technical Report #43, University of Auckland/Ministry of Education.

96
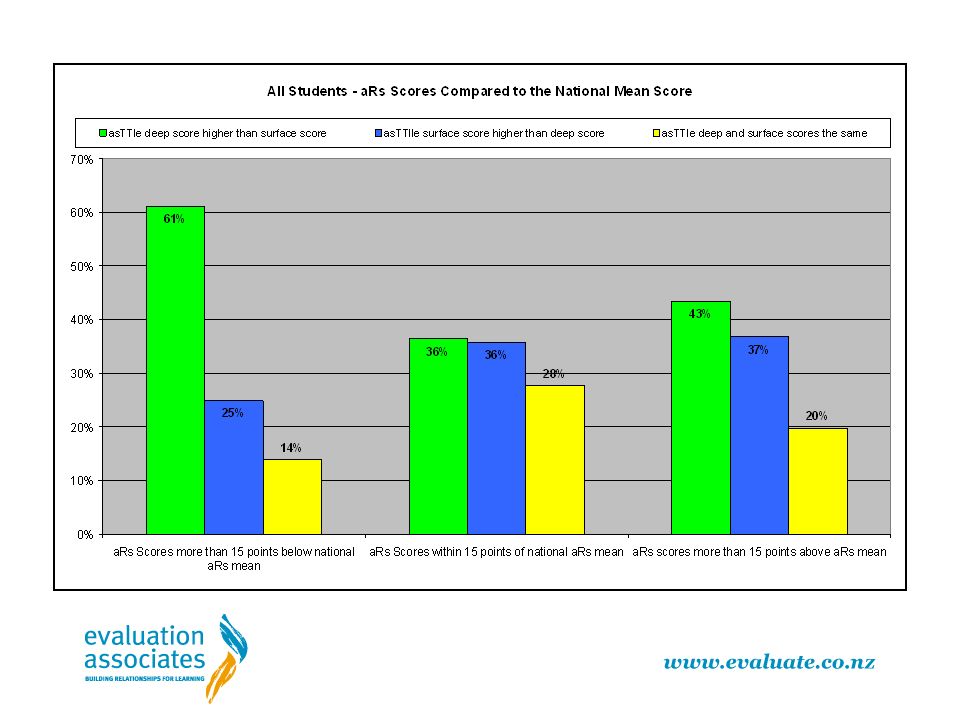
the curriculum sublevel score does not seem to change the likelihood of scoring higher in surface or deep thinking. there appears to be a link between the performance of a student against the relative mean of his/her year group and depth of thinking score. If his/her score is significantly below the national norm they have a greater likelihood of having a higher deep score than surface score. Surface vs Deep

97
QuestionSOLO taxonomy classification e-asTTle classification “Whose house did Goldilocks go into?” UnistructuralSurface “What are three aspects about the way the bears live that tell us that the story is not a real life situation?” MultistructuralSurface “Goldilocks eats the baby bear’s food, breaks his chair, and sleeps in his bed. What does this tell us about the kind of person she is”? RelationalDeep “Why do nursery tales allow wild animals to act in human fashion?” Extended AbstractDeep

98
What this suggests is that while surface questions are cognitively less demanding they may often require more involvement with the text than their deeper counterparts. This could explain why students scoring below the mean score for reading achievement do poorly with surface questions in comparison to deep questions. It could be that they simply do not have the reading comprehension and processing skills needed to consistently answer questions directly related to text.

99
Summary of student year group data Year groupNo. of students Year 4220 Year 5242 Year 6244 Year 7253 Year 8225 Year 9164 Year 10139 Total students1487

100
Year aRs Score Surface Score Deep Score Difference between Surface and Deep 4466448492 (448-492) -44
 -44")
102
The analyses of the asTTle reading test data point toward a number of key trends. Some concern must be raised at the nature of the Year 10 data given its enormous skew towards higher deep scores, but given that the rest of the data is representative of normal asTTle results we can observe that: In depth of thinking within asTTle, a student has a far greater likelihood of scoring higher in deep thinking than surface thinking

Similar presentations


>")


