Download presentation
Presentation is loading. Please wait.

2
Misleading Data Displays Lesson 10

3
1. What type of graph is shown? 2. Estimate the number of people participating in each activity. 3. Which two activities are done by the most people per month? 4. Which two activities are done by the fewest people per month? 5. Which activity is more popular? a.baseball or bowling b.reading or tennis c.swimming or bowling d.movies or reading

4
ANSWERS 1. What type of graph is shown? Bar graph 2. Estimate the number of people participating in each activity. Tennis ≈ 1,500Live Theatre ≈ 2,000 Movies ≈ 5,000 Baseball ≈ 3,000Bowling ≈ 2,500Reading ≈ 4,000 Swimming ≈ 3,000 3.Which two activities are done by the most people per month? Movies and Reading 4.Which two activities are done by the fewest people per month? Tennis and Live Theatre 5.Which activity is more popular? a.baseball or bowling b.reading or tennis c.swimming or bowling d.movies or reading

5
1.Which category of waste is the largest? 2.Which category of waste is the smallest? 3.If the total waste for a year is 200 tons, how many tons would be made up of each type? 4.What percentage of the total year’s waste comes from… a.glass, metal & plastic? b.furniture, cans, and metal? c.paper, food, and plastic? d.glass and metal? Percentage is by weight.

6
ANSWERS 1.Which category of waste is the largest? Paper 2.Which category of waste is the smallest? Cans 3.If the total waste for a year is 200 tons, how many tons would be made up of each type? Paper = 80 tons Yard waste = 34 tons Food = 18 tons Glass = 18 tons Metal = 20 tons Plastic = 14 tons Furniture = 12 tons Cans = 4 tons 4. What percentage of the total year’s waste comes from… a.glass, metal & plastic? 26% b.furniture, cans, and metal? 18% c.paper, food, and plastic? 56% d.glass and metal? 19% Percentage is by weight.

7
1. What is the total spent on pet items? 2. What is the mean of the 3 amounts? 3. How much more is spent on food than veterinary care? 4. How much less is spent on veterinary care than supplies and medicine?

8
ANSWERS 1. What is the total spent on pet items? $33.9 billion 2. What is the mean of the 3 amounts? $11.3 billion 3. How much more is spent on food than veterinary care? $6.2 billion 4. How much less is spent on veterinary care than supplies and medicine? $100 million ($0.1 billion)
.")
9
1.What type of graph is shown? 2.Estimate the number of pets registered for each year. 3.When was the maximum number of registrations done? 4.When was the minimum number of pets registered? 5.What is the range of pet registered? 6.What is the mean of the number of pets registered shown? 7.What is the median of the number of pets registered? 8.What is the mode of the number of pets registered?

10
ANSWERS 1.What type of graph is shown? Line graph 2.Estimate the number of pets registered for each year. 2003 ≈ 120 pets 2004 ≈ 60 pets 2005 ≈ 20 pets 2006 ≈ 80 pets 2007 ≈ 20 pets 3.When was the maximum number of registrations done? 2003 4.When was the minimum number of pets registered? 2005 and 2007 5.What is the range of pet registered? 100 pets 6. What is the mean of the number of pets registered shown? 60 pets 7. What is the median of the number of pets registered? 60 pets 8. What is the mode of the number of pets registered? 20 pets

11
2002 2003 2004 2005 2006 1.What is the maximum rainfall and in what year did it occur? 2.What is the minimum rainfall and in what year did it occur? 3.Between which two years did the amount of rainfall decrease the most? 4.Between which two years did the amount of rainfall increase the most?

12
2002 2003 2004 2005 2006 1.What is the maximum rainfall and in what year did it occur? 51.5 inches, 2003 2.What is the minimum rainfall and in what year did it occur? 26.3 inches, 2005 3.Between which two years did the amount of rainfall decrease the most? 2004 and 2005 4.Between which two years did the amount of rainfall increase the most? 2002 and 2003

13
Median Weekly Income (in dollars) by Educational Level Attained - 2004 1.Estimate the weekly amount earned by each level of education. 2.Between which two levels is the difference greatest? 3.Between which two levels is the difference the least? 4.What is the range of incomes? 5.If a person works 40 years, what will be the lifetime difference between having no high school diploma and having a bachelor’s degree?

14
ANSWERS Median Weekly Income (in dollars) by Educational Level Attained - 2004 1.Estimate the weekly amount earned by each level of education. Professional degree ≈ $1,050 Master’s degree ≈ $950 Bachelor’s degree ≈ $800 Associate’s degree ≈ $600 Postsecondary voc trning ≈ $550 High Sch graduate,no col ≈ $500 No High School diploma ≈ $350 2. Between which two levels is the difference greatest? Associate’s degree and Bachelor’s degree 3. Between which two levels is the difference the least? Associate’s degree, Postsecondary vocational training, and High School graduate, no college 4. What is the range of incomes? $700 5. If a person works 40 years, what will be the lifetime difference between having no high school diploma and having a bachelor’s degree? $936,000 1.

15
1. Determine the median weekly salary for workers with no high school diploma. 2. Which levels of education earn a median weekly salary of at least $700?

16
1. How many gold medals have been won by the six countries listed? 2. Which country has won the most medals? 3. How many medals has Spain won?

17
1. How many students have earned 10 or more credits? 2. How many students have earned less than 15 credits?

18
1. What is the tax for a single person earning $14,760? 2. What is the tax for a head of household earning $14,925? 3. What is the tax for a married person filing jointly earning $14,900? 4. What is the tax for a married person filing separately earning $14,600?

19
1. What is the average height of a 14-year old male? 2. How much has the average female grown from age 8 to age 16? 3. At what age is the difference between the average height for males and females the greatest?

20
1. What is the average intelligence quotient (IQ)? 2. What percentage of people are above the average? 3. What percentage of people are below the average? 4. What is type of curve is pictured in this graph?

21
1. How much was spent on eating out in 1990? 2. How much has eating out increased from 1950 to 2007?

22
1. What is the average weekly cost of feeding a 15-year old female? 2. What is the average monthly cost of feeding a 16-year old male? 3. What is the monthly difference between feeding males and females at age 14?

23
1. In what month was the temperature the highest? 2. What is the difference between the high and low average temperatures? 3. Between what two consecutive months was the greatest increase in temperature?

24
Distortions and Misrepresentations in Graphs

25
Tables and Graphs Explain why the bar graph could be misleading. Because it starts at 1000…not 0.

26
1.6 Tables and Graphs Does this graph appear to have the same dramatic increase as the previous one? Previous Chart:

27
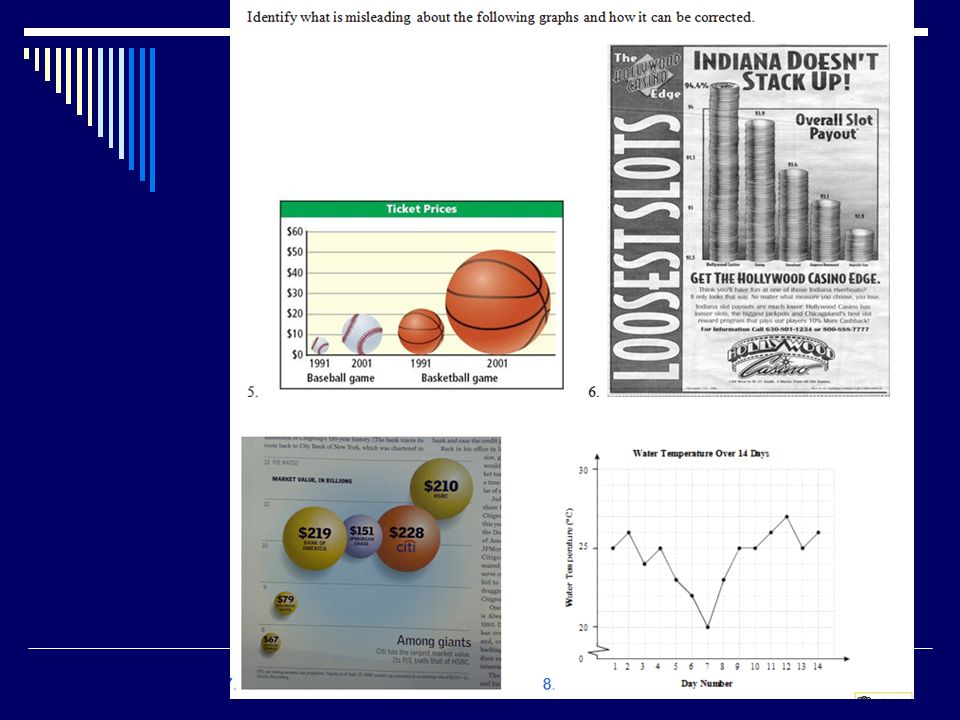
1. What is the diameter of each circle? 2. What is the area formula for a circle? 3. Does the graph show that the sales doubled from 1997 to 1998? Why or why not? Sales Increase Over Last Year

29
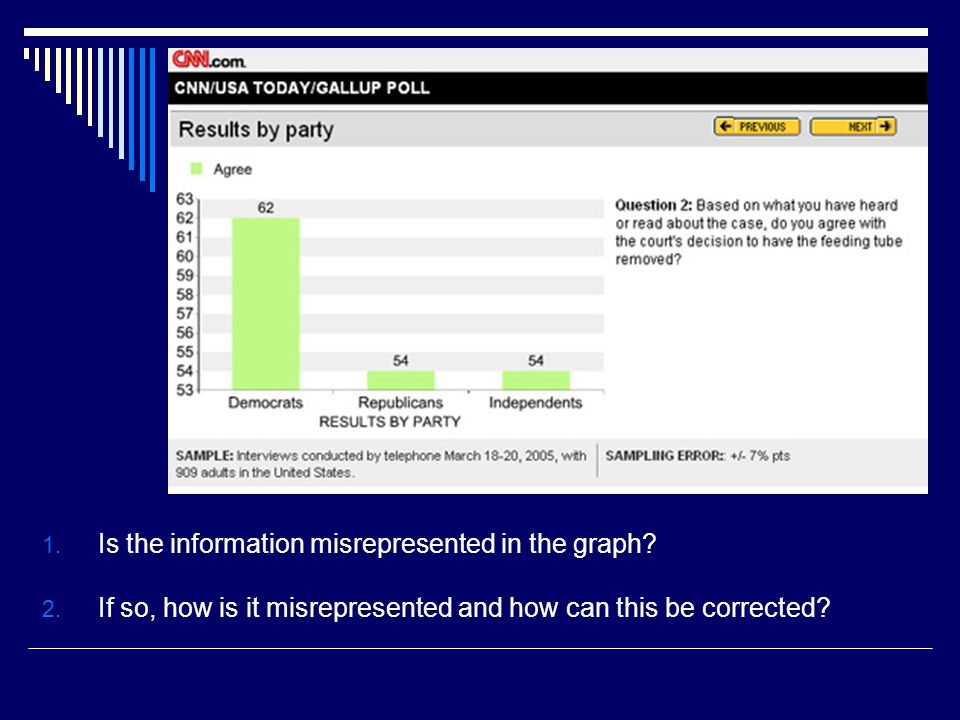
1. Is the information misrepresented in the graph? 2. If so, how is it misrepresented and how can this be corrected?

30
1. Which graph more accurately represents the data? 2. What situation would utilize the less accurate graphical representation? versus Customers in Store C spend less time at the Checkout Counter.

Similar presentations


line plots, stem-and-leaf plots, double-bar graphs, line graphs, (box.>")


