Download presentation
Presentation is loading. Please wait.

2
KCM Divided into Three Sections

4
NAR 8/2013 Real Estate Recovery Sales Started Sustained Recovery September 2011 Prices Started Sustained Recovery June 2012 Inventory Started Sustained Recovery January 2013

5
“The forces pulling the home ownership rate lower are past their apex…House prices are rising, but remain affordable at 21% below peak, even as rents rise. Some who lost homes early in the crisis can now qualify again for mortgage loans. As housing recovers and consumers again see prices rising steadily, perceptions will swing back to favor home ownership.” Moody’s Analyitics 8/2013 Celia Chen Senior Director - Moody's Analytics A Swing Back Toward Ownership

6
KCM Blog 8/2013 Boomerang Buyers “HUD recently announced that people who lost their home through a foreclosure, short sale or bankruptcy, may be eligible to finance a home again in as little as 12 months. This is a reduction from the previously required minimum of 36 months from the date of the “most recent event.” Released August 15, HUD provided guidelines under “Back to Work: Extenuating Circumstances” meant to ease the path for home ownership for many.”

7
Joint Center for Housing Studies Harvard University 8/2013 “Even after the dramatic loss of equity and the high foreclosure rates, the early evidence suggests that people seem to believe that, over the long run, owning is still preferable to renting... Reexamining the Social Benefits of Homeownership after the Housing Crisis The long term cultural preference for owning seems to have weathered the recent housing crisis.”

8
Joint Center for Housing Studies Harvard University 8/2013 “The research on home-buying expectations supports the conclusion that very large percentages of Americans still expect to buy a home at some time in the future… Moreover, the finding that younger renters and owners are more likely than their older counterparts to expect to own bodes well for the future of the housing market.” Reexamining the Social Benefits of Homeownership after the Housing Crisis

9
FHFA Regional Home Prices (year-over-year) FHFA 2013 2Q HPI Report
 FHFA Q HPI Report")
10
2012 3Q2012 4Q 2013 1Q2013 2Q

11
FHFA State Home Prices (year-over-year) FHFA 2013 2Q HPI Report
 FHFA Q HPI Report")
12
35% Loss in Price, then 35% Gain Still 12% off Peak

13
MonthsMarketPricing 1- 5SellersAppreciation 5 - 6EvenThe Norm 6+BuyersDepreciation Months Supply & Impact on Price

14
Months Inventory of Homes for Sale NAR 8/2013 5-6 Months = Normal Market Inventory

15
NAR 8/2013 Year-over-Year Inventory Levels

16
S&P Case Shiller 8/2013 Year-over-Year Change in Prices

17
Zillow 8/2013 3.2 million homeowners have been freed from negative equity in the last twelve months. million additional are expected to be freed in the next twelve months. 1.9

18
Cost vs. Price

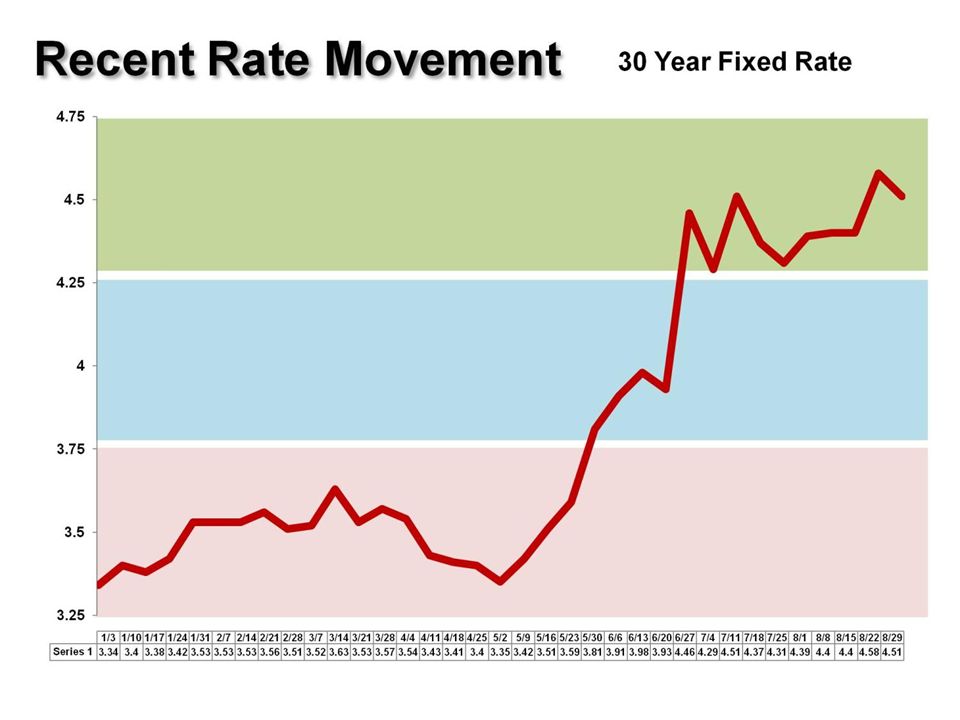
20
Mortgage Rate Projections Analyst Projected Rate 3Q 2014 Fannie Mae 5.0% National Assoc. of Realtors 5.1% Freddie Mac 5.1% Mortgage Bankers Assoc 4.9% 8/2013

21
Home Prices Next Year In the recent Home Price Expectation Survey, over 100 leading housing analysts called for an approximate 5% increase in home values over the next twelve months. Home Price Expectation Survey 8/2013

22
Thinking about moving up to the home of your dreams?

23
Comparison – Next YearCurrent HomeMove-Up Home Current Price$240,000$360,000 Future Price (+5%) $252,000$378,000 Future Gain$12,000$18,000 Total Gain$6,000 The Move-Up Seller
 $252,000$378,000 Future Gain$12,000$18,000 Total Gain$6,000 The Move-Up Seller")
24
PriceRateP&I Today $360,0004.5%$1,824.07 End of Year $378,0005%$2,029.19 Monthly Savings $205.12 The Move-Up Seller

26
January 2000 – August 2013 MSN Money, Case Shiller Return on Investment

27
Pending Home Sales NAR 8/2013 100 = Historically Healthy Level

28
Pending Home Sales NAR 8/2013

29
Months Inventory of Homes for Sale NAR 8/2013 5-6 Months = Normal Market Inventory

30
NAR 8/2013 Percentage of Distressed Property Sales 35% 15%

31
S&P Case-Shiller Home Price Indices S&P Case Shiller 8/2013

33
Reasons to Hire a Real Estate Professional 5 They help with all disclosures and paperwork necessary in today’s heavily regulated environment. They are well educated in and experienced with the entire sales process. They act as a ‘buffer’ in negotiations with all parties throughout the entire transaction. They help understand today’s real estate values when setting the price on a listing or on an offer to purchase. They simply and effectively explain today’s real estate headlines and decipher what they mean to you.

34
NAR 8/2013 Found sixty eight percent of those surveyed responded that now is a good time to buy a home Found over 50% of renters say that eventually owning a home is one of their highest personal priorities 68 % 51 % NAR’s 2013 HOUSING PULSE Survey Found eight in 10 Americans believe buying a home is a good financial decision

35
Year-over-Year Change in Prices S&P Case Shiller 8/2013

36
30 Year Fixed Rate Mortgage History January 2012 - September 2013 Federal Reserve 9/2013

37
Price Money Down Mortgage Interest Rate Payment (P&I) Last Year*$187,800$37,560$150,2403.5%$674.64 This Year*$213,500$42,700$170,8004.5%$865.42 Next Year**$224,175$44,835$179,3405%$962.74 *For the first two examples, we used the NAR’s Existing Home Sales Report to establish median price and Freddie Mac’s Primary Mortgage Market Survey to establish mortgage rate. We also assumed a 20% down payment in all examples. **To establish next year’s pricing, we depended on the over 100 housing experts surveyed for the Home Price Expectation Survey who called for an approximate appreciation rate of 5% over the next twelve months. For the interest rate, we took the average of the projections from the Mortgage Bankers’ Association, Freddie Mac and Fannie Mae. The Cost of Waiting

39
Resources KEEPINGCURRENTMATTERS.COM SlideSlide TitleLink 4Real Estate Recoveryhttp://www.realtor.org 5A Swing Back Toward OwnershipPAID: http://www.economy.com/dismal/pro/article.asp?cid=241831http://www.economy.com/dismal/pro/article.asp?cid=241831 6Boomerang Buyers http://www.kcmblog.com/2013/08/22/boomerang-homebuyers-get-a-shorter-ride-home/ http://portal.hud.gov/hudportal/HUD?src=/program_offices/administration/hudclips/letters/mort gagee 7, 8Social Benefits of Homeownershiphttp://www.jchs.harvard.edu/sites/jchs.harvard.edu/files/hbtl-04.pdf 9, 10, 11 FHFA Regional Home Prices, FHFA State Prices http://www.fhfa.gov/webfiles/25483/2013Q2HPI82213Final.pdf 14Months Inventory of Home Saleshttp://www.realtor.org 17Negative Equity Graphichttp://zillow.mediaroom.com/index.php?s=159&item=373 20Mortgage Rate Projections http://www.mortgagebankers.org/files/Bulletin/InternalResource/84813_.pdf http://www.freddiemac.com/news/finance/docs/Jun_2013_public_outlook.pdf http://www.realtor.org/sites/default/files/reports/2013/embargoes/phs-6-27-hgbfjnv/july-2013- outlook-2013-6-27.pdf http://www.fanniemae.com/resources/file/research/emma/pdf/Housing_Forecast_061313.pdf 21Home Prices Next Yearhttps://pulsenomics.com/Q2_2013_HPE_Survey.php 26Return on Investmenthttp://www.spindices.com/index-family/real-estate/sp-case-shiller

40
Resources SlideSlide TitleLink 27, 28, 29, 30 Pending Home Sales, Months Inventory of Homes for Sale, Percentage of Distressed Property Sales http://www.realtor.org 31S&P Case-Shiller Home Price Indices https://www.spice-indices.com/idpfiles/spice- assets/resources/public/documents/19529_cshomeprice-release-0730.pdf 34Housing Pulse Survey http://www.realtor.org/news-releases/2013/07/renters-thinking-more-about-owning-a-home- say-homeownership-is-a-top-priority 3630 Year Fixed Rate Mortgage Historyhttp://www.freddiemac.com/pmms 34S&P Case-Shiller Home Price Indices https://www.spice-indices.com/idpfiles/spice- assets/resources/public/documents/19529_cshomeprice-release-0730.pdf 41Stephen Phillips Quote http://www.businesswire.com/news/home/20130812005934/en/Prudential-Real-Estate-Q2- Outlook-Survey-Millennials 42Home Affordability Index http://www.realtor.org/topics/housing-affordability-index/data http://www.realtor.org/topics/housing-affordability-index/methodology 43Family Wealthhttp://economistsoutlook.blogs.realtor.org/2013/07/30/the-latest-homeownership-rate/ KEEPINGCURRENTMATTERS.COM

41
“Home buyers are more informed than ever with their Internet searches and ongoing research; however, there’s a critical need to transform that information into analysis and advice that helps consumers make the best home-buying and selling decisions.” Stephen Phillips Chief Operating Officer for HSF Affiliates LLC

42
To interpret the indices, a value of 100 means that a family with the median income has exactly enough income to qualify for a mortgage on a median-priced home. An index above 100 signifies that family earning the median income has more than enough income to qualify for a mortgage loan on a median- priced home, assuming a 20 percent down payment. Home Affordability Index 127.4 172.2 206.5 155.2 NAR 8/2013

43
“The rise in the renter population with no net increase in the owner population at a time of housing recovery automatically means greater unequal distribution of wealth. Housing wealth is rising because of price increases, but the wealth is going to the fewer and fewer households who happen to be homeowners and those who own more than one home.” Lawrence Yun, Chief Economist of the National Association of Realtors NAR 8/2013 Family Wealth

Similar presentations


 Program Contact Brent at The Arlington Bank for more information Contact Brent at The Arlington.>")


