Download presentation
Presentation is loading. Please wait.

1
Journal Club 埼玉医科大学 総合医療センター 内分泌・糖尿病内科 Department of Endocrinology and Diabetes, Saitama Medical Center, Saitama Medical University 松田 昌文 Matsuda, Masafumi 2011 年 2 月 17 日 8:30-8:55 8階 医局 Hirvonen J, Virtanen KA, Nummenmaa L, Hannukainen JC, Honka MJ, Bucci M, Nesterov SV, Parkkola R, Rinne J, Iozzo P, Nuutila P. Effects of insulin on brain glucose metabolism in impaired glucose tolerance. Diabetes. 2011 Feb;60(2):443-7. Smith SM, Paul G, Kelly A, Whitford DL, O'Shea E, O'Dowd T. Peer support for patients with type 2 diabetes: cluster randomised controlled trial. BMJ. 2011 Feb 15;342:d715. doi: 10.1136/bmj.d715.
: Smith SM, Paul G, Kelly A, Whitford DL, O Shea E, O Dowd T. Peer support for patients with type 2 diabetes: cluster randomised controlled trial. BMJ Feb 15;342:d715. doi: /bmj.d715..")
2
Nature. 1979 Nov 29;282(5738):503-5. Chronic intracerebroventricular infusion of insulin reduces food intake and body weight of baboons. Woods SC, Lotter EC, McKay LD, Porte D Jr. Body adiposity is normally maintained within rigid limits 1–3. Although it is not clear that this regulation fits a strict negative feedback pattern, animals do maintain a relatively constant body adiposity 4. It has been postulated that this regulation is mediated by some signal which informs centres controlling food intake, probably located in the brain, as to the present state of adiposity 5,6. The identity of the signal is unknown, but the direct correlation between body adiposity and basal insulin levels in the plasma 7–9, suggests insulin as a possible candidate. This hormone is present in the cerebrospinal fluid (CSF) of many species 10–13, and is a slow integral over time of the level within the plasma 14. Thus, the level of insulin in the CSF is relatively resistant to short-term plasma fluctuations of insulin. Obese humans have higher levels of CSF insulin than lean controls and the CSF insulin level of both obese and lean humans is reduced proportionately after a prolonged fast 15. We have therefore postulated 16 that the feedback system responding to body adiposity uses the concentration of insulin in the CSF as a major signal. Additional support for such a role is found in recent reports that insulin receptors are present in several regions of the brain and spinal cord 17–20. We now present additional evidence for our hypothesis by showing that in baboons the infusion of exogenous insulin into the CSF elicits a reliable and predictable decrease in food intake and body weight.
 of many species 10–13, and is a slow integral over time of the level within the plasma 14. Thus, the level of insulin in the CSF is relatively resistant to short-term plasma fluctuations of insulin. Obese humans have higher levels of CSF insulin than lean controls and the CSF insulin level of both obese and lean humans is reduced proportionately after a prolonged fast 15. We have therefore postulated 16 that the feedback system responding to body adiposity uses the concentration of insulin in the CSF as a major signal. Additional support for such a role is found in recent reports that insulin receptors are present in several regions of the brain and spinal cord 17–20. We now present additional evidence for our hypothesis by showing that in baboons the infusion of exogenous insulin into the CSF elicits a reliable and predictable decrease in food intake and body weight..")
3
Description of the Original HOMA Metabolism 28:1086-1096, 1979 BRAIN PERIPHERALTISSUE

4
Insulin resistance Homeostasis model analysis (HOMA) First description in 1979 Turner et al. Turner R, Holman RR, Matthews D, Hockaday TR, Peto J : Insulin deficiency and insulin resistance interaction in diabetes : estimation of relative contribution by feedback analysis from basal plasma insulin and glucose concentrations. (Metabolism 28:1086-1096, 1979.) HOMA INDEX()=rl=rp During basal steady state: This is converted to the below formula. The unit of PG is mmol/min. 0= HGP & Splanchnic ( f PG,fIRI,rl) - Brain (fPG) - Muscle (fPG,fIRI, rp) Where fIRI : fasting insulin conc. [mU/L], fPG : fasting PG [mmol/L] rl : liver insulin resistance, rp : peripheral (or muscle) insulin resistance Assuming that rl=rp(=R), the above formula can be solved for R after substituting fPG and fIRI for actual measured values. rp rl fIRI 1+ 0.4 0.1 fPG 1+ 14 fIRI +2 1.2 1 1 0.4 1+ 1 1 6 6 fPG 0= 3-1.86 ×log × -1.5×log(fPG) -1.5×log(fPG) - - - - × × × × NOTE: the function above is in steady state.
 HOMA INDEX()=rl=rp During basal steady state: This is converted to the below formula. The unit of PG is mmol/min. 0= HGP & Splanchnic ( f PG,fIRI,rl) - Brain (fPG) - Muscle (fPG,fIRI, rp) Where fIRI : fasting insulin conc. [mU/L], fPG : fasting PG [mmol/L] rl : liver insulin resistance, rp : peripheral (or muscle) insulin resistance Assuming that rl=rp(=R), the above formula can be solved for R after substituting fPG and fIRI for actual measured values. rp rl fIRI fPG fIRI fPG 0= ×log × -1.5×log(fPG) -1.5×log(fPG) × × × × NOTE: the function above is in steady state..")
5
Calculation of HOMA-IR (example) rl=rp(=R) , fIRI=8 [ U/ml], fPG=6 [mmol/L] rp rl fIRI 1+ 0.4 0.1 fPG 1+ 14 fIRI +2 1.2 1 1 0.4 1+ 1 1 6 6 fPG 0= 3-1.86 ×log × -1.5×log(fPG) -1.5×log(fPG) - - - - × × × × Then,R R 8 1+ 0.4 0.1 6 1+ 14 8 +2 1.2 1 0.4 1+ 1 6 6 0= 3-1.86 × log -1.5 -1.5 × log(6) - - × × Note: this calculation was estimated from the figures found in the original Metabolism paper published in 1979. Dr. Turner may used a different formuola. It was possible to solve this equation by a large frame computer in 1979. Now it is easy to solve this equation by an EXCEL file. R=2.1 (when fIRI=8 U/ml, fPG=108mg/dl(=6mmol/L))Thus, M. Matsuda: index of insulin secretion and insulin resistance, Internal Medicine [Japanese] 105:39-44, 2010.
![Calculation of HOMA-IR (example) rl=rp(=R) , fIRI=8 [ U/ml], fPG=6 [mmol/L] rp rl fIRI fPG fIRI fPG 0= ×log × -1.5×log(fPG) -1.5×log(fPG) × × × × Then,R R = × log × log(6) - - × × Note: this calculation was estimated from the figures found in the original Metabolism paper published in 1979.](http://images.slideplayer.com/23/6831543/slides/slide_5.jpg "Dr. Turner may used a different formuola. It was possible to solve this equation by a large frame computer in Now it is easy to solve this equation by an EXCEL file. R=2.1 (when fIRI=8 U/ml, fPG=108mg/dl(=6mmol/L))Thus, M. Matsuda: index of insulin secretion and insulin resistance, Internal Medicine [Japanese] 105:39-44,")
6
Methods 50 mCi IV bolus of 15 O-water Algorithms : Transform PET images into spatial coordinates of a standard brain atlas Generate normalized t-value (z-score, p<0.005) Superimpose the statistical maps on MRI images Regional cerebral blood flow
 Superimpose the statistical maps on MRI images Regional cerebral blood flow")
7
36-h fast MRIPET 2 ml water PET 2 ml water Meal 1/2 RMR 25 min Study Design 22 right-handed Caucasian men : Lean : BMI 25 kg/m 2, n=11 35±8 years, 73±9kg, 19±6% body fat Obese : BMI 35 kg/m 2, n=11 27±5 years, 115±11kg, 38±7% body fat

8
Hunger Obese Subjects Lean Subjects

9
Obese vs Lean Subjects Hunger Insula/Temporal Cortex Occipital Cortex Temporal Cortex

10
Obese Subjects Lean Subjects Hunger

11
Obese vs Lean Subjects Hunger Occipital Cortex Temporal Cortex Temporofrontal Cortex

12
Hunger Obese Subjects Lean Subjects

13
Obese vs Lean Subjects Hunger Cerebellum Orbitofrontal Cortex

14
Satiation Obese Subjects Lean Subjects

15
Obese vs Lean Subjects Satiation Dorsolateral PCDorsomedial PC Ventromedial PC

16
Obese Subjects Satiation Lean Subjects

17
Obese vs Lean Subjects Satiation Dorsolateral PC Dorsomedial PC Ventromedial PC

18
Satiation Obese Subjects Lean Subjects

19
Obese vs Lean Subjects Satiation Dorsomedial PC Anterior Cingulate Ventromedial PC

20
fMRI Response Matsuda, M. et al Diabetes 48:1801-1806, 1999 Nature 405:1058-1062, 2000

23
1 Turku PET Centre, University of Turku and Turku University Hospital, Turku, Finland; the 2 Department of Radiology, University of Turku, Turku, Finland; the 3 Brain Research Unit, Low Temperature Laboratory, Aalto University School of Science and Technology, Helsinki, Finland; the 4 Department of Biomedical Engineering and Computational Science, Aalto University School of Science and Technology, Helsinki, Finland; the 5 I.M. Sechenov Institute of Evolutionary Physiology and Biochemistry, RAS, St. Petersburg, Russia; and the 6 Institute of Clinical Physiology, National Research Council, Pisa, Italy. Diabetes 60:443–447, 2011

24
OBJECTIVE—Insulin stimulates brain glucose metabolism, but this effect of insulin is already maximal at fasting concentrations in healthy subjects. It is not known whether insulin is able to stimulate glucose metabolism above fasting concentrations in patients with impaired glucose tolerance.

25
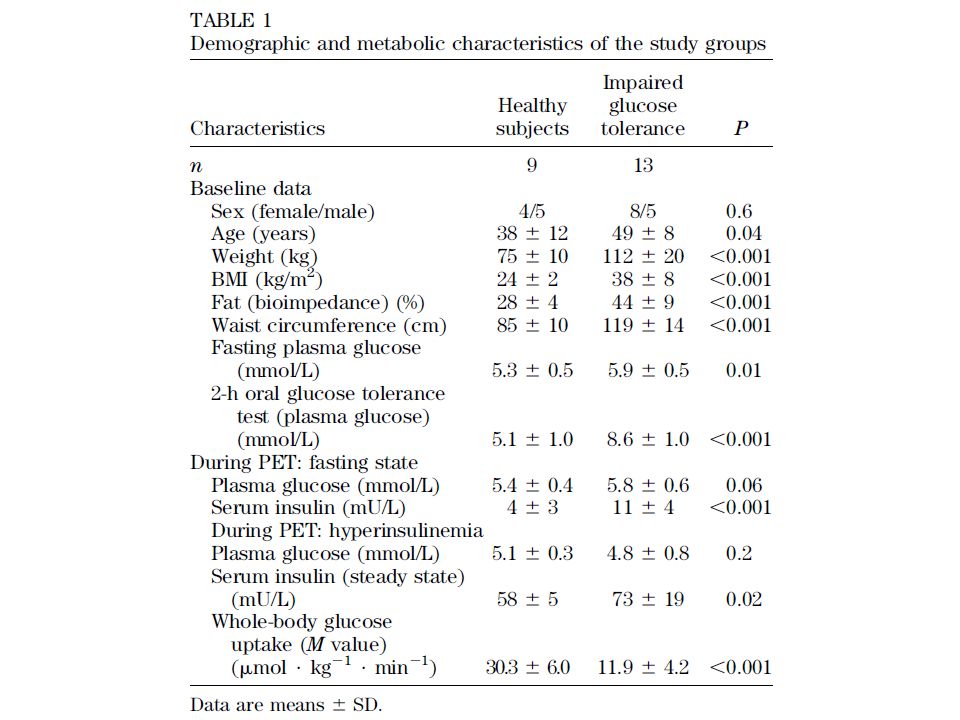
RESEARCH DESIGN AND METHODS—We studied the effects of insulin on brain glucose metabolism and cerebral blood flow in 13 patients with impaired glucose tolerance and nine healthy subjects using positron emission tomography (PET). All subjects underwent PET with both [ 18 F]fluorodeoxyglucose (for brain glucose metabolism) and [ 15 O]H 2 O (for cerebral blood flow) in two separate conditions (in the fasting state and during a euglycemic- hyperinsulinemic clamp). Arterial blood samples were acquired during the PET scans to allow fully quantitative modeling.
 and [ 15 O]H 2 O (for cerebral blood flow) in two separate conditions (in the fasting state and during a euglycemic- hyperinsulinemic clamp). Arterial blood samples were acquired during the PET scans to allow fully quantitative modeling..")
29
The highest insulin-stimulated increase in glucose metabolism was seen in the posterior insula, a region that monitors bodily states and is implicated in reward functions. A recent study found increased functional responses to gastric distention in obese subjects in the posterior insula. Thus, the posterior insula may be one of the regions where insulin reduces feeding behavior in humans.

30
RESULTS—The hyperinsulinemic clamp increased brain glucose metabolism only in patients with impaired glucose tolerance (whole brain: +18%, P = 0.001) but not in healthy subjects (whole brain: +3.9%, P = 0.373). The hyperinsulinemic clamp did not alter cerebral blood flow in either group.

31
CONCLUSIONS—We found that insulin stimulates brain glucose metabolism at physiological postprandial levels in patients with impaired glucose tolerance but not in healthy subjects. These results suggest that insulin stimulation of brain glucose metabolism is maximal at fasting concentrations in healthy subjects but not in patients with impaired glucose tolerance.

32
Message/Comments IGT の人の脳はインスリン投与でブドウ糖 を何に利用しているのか? 聞いたことがない現象でちょっとびっく り!

34
1 Department of Public Health and Primary Care, Trinity College, Dublin, Republic of Ireland 2 Department of Family and Community Medicine, Royal College of Surgeons in Ireland- Medical University of Bahrain, PO Box 15503, Adliya, Bahrain 3 Irish Centre for Social Gerontology, National University of Ireland, Galway BMJ 2011;342:d715

35
Objective To test the effectiveness of peer support for patients with type 2 diabetes.

36
Design Cluster randomised controlled. Setting 20 general practices in the east of the Republic of Ireland. Participants 395 patients (192 in intervention group, 203 in control group) and 29 peer supporters with type 2 diabetes. Intervention All practices introduced a standardised diabetes care system. The peer support intervention ran over a two year period and contained four elements: the recruitment and training of peer supporters, nine group meetings led by peer supporters in participant’s own general practice, and a retention plan for the peer supporters. Main outcome measures HbA1c; cholesterol concentration; systolic blood pressure; and wellbeing score.
 and 29 peer supporters with type 2 diabetes. Intervention All practices introduced a standardised diabetes care system. The peer support intervention ran over a two year period and contained four elements: the recruitment and training of peer supporters, nine group meetings led by peer supporters in participant’s own general practice, and a retention plan for the peer supporters. Main outcome measures HbA1c; cholesterol concentration; systolic blood pressure; and wellbeing score..")
37
The peer support intervention The peer support intervention had the following components: Peer supporters Peer supporters were identified by general practitioners and practice nurses and were trained at a ratio of about one peer supporter to seven or eight patients with type 2 diabetes. The criteria for eligibility were: _ Having had type 2 diabetes for at least one year _ Participation in preventive treatments and judged by the practice team as being generally adherent to treatment and behaviour change regimens _ Capacity and commitment to undergo the training required _ A full understanding of the importance of patients’ confidentiality _ Undertaking to liaise with the practice nurse or general practitioner if unanticipated problems arose during the course of their peer support activity Peer supporter training The peer supporters attended two evening training sessions, which were conducted by the research team. These sessions focused on the basics of type 2 diabetes and issues relating to working with groups and confidentiality.

38
Peer support meetings Peer support meetings were held in the general practice premises at a convenient time for practice staff, peer supporters, and participants. Practices offered various daytime or early evening sessions, depending on patients’ preference. There were nine peer support sessions over two years; at month one, month two, and every three months thereafter. Each meeting was facilitated by the peer supporter, and there were no health professionals present in the meeting room though they were available on site, if needed. Each meeting had a suggested theme and a small structured component. The contents of the meetings were recorded (see appendix 2 on bmj.com). There was also a “frequently asked questions” (FAQs) system—that is, at the end of each session the group fed back questions to the research team who compiled written answers based on the feedback from all groups. The FAQs from all groups were combined and sent back to the groups for the next session. Retention and support of peer supporters Formal structures were put in place to ensure peer support workers were supported in their role, including telephone calls from the project manager before and after meetings; a course handbook and resource pack; an annual social or educational event; a protocol to follow if a peer supporter resigned; and travel and related expenses (this was given in the form of a general shopping voucher at the end of each year with a value of €300).
. There was also a frequently asked questions (FAQs) system—that is, at the end of each session the group fed back questions to the research team who compiled written answers based on the feedback from all groups. The FAQs from all groups were combined and sent back to the groups for the next session. Retention and support of peer supporters Formal structures were put in place to ensure peer support workers were supported in their role, including telephone calls from the project manager before and after meetings; a course handbook and resource pack; an annual social or educational event; a protocol to follow if a peer supporter resigned; and travel and related expenses (this was given in the form of a general shopping voucher at the end of each year with a value of €300)..")
40
Peer supporter training [posted as supplied by author] The peer supporters attended two evening training sessions, which were conducted by GMP and KK. The training sessions were held in four different venues to facilitate the peer supporters. The content of these sessions is outlined below: Session 1 Introduction to the project Role of the peer supporter Basics of type 2 diabetes Complications of type 2 diabetes Session 2 Lifestyle and medication issues Communication skills and working with groups Role play Confidentiality Support for the peer supporters The two sessions focused on the materials used during the group meetings and peer supporters each received a Peer Supporter Handbook and resource material to support these training sessions
![Peer supporter training [posted as supplied by author] The peer supporters attended two evening training sessions, which were conducted by GMP and KK.](http://images.slideplayer.com/23/6831543/slides/slide_40.jpg "The training sessions were held in four different venues to facilitate the peer supporters. The content of these sessions is outlined below: Session 1 Introduction to the project Role of the peer supporter Basics of type 2 diabetes Complications of type 2 diabetes Session 2 Lifestyle and medication issues Communication skills and working with groups Role play Confidentiality Support for the peer supporters The two sessions focused on the materials used during the group meetings and peer supporters each received a Peer Supporter Handbook and resource material to support these training sessions.")
41
Specific topics discussed in the peer support meetings [posted as supplied by author]
![Specific topics discussed in the peer support meetings [posted as supplied by author]](http://images.slideplayer.com/23/6831543/slides/slide_41.jpg "Specific topics discussed in the peer support meetings [posted as supplied by author]")
47
Results There was no difference between intervention and control patients at baseline. All practices and 85% (337) of patients were followed up. At two year follow-up, there were no significant differences in HbA1c (mean difference −0.08%, 95% confidence interval −0.35% to 0.18%), systolic blood pressure (−3.9mmHg, −8.9 to 1.1mmHg), total cholesterol concentration (−0.03 mmol/L, −0.28 to 0.22 mmol/L), or wellbeing scores (−0.7, −2.3 to 0.8). While there was a trend towards decreases in the proportion of patients with poorly controlled risk factors at follow-up, particularly for systolic blood pressure (52% (87/166) >130 mmHg in intervention v 61% (103/169) >130 mmHg in control), these changes were not significant. The process evaluation indicated that the intervention was generally delivered as intended, though 18% (35) of patients in the intervention group never attended any group meetings.
 of patients were followed up. At two year follow-up, there were no significant differences in HbA1c (mean difference −0.08%, 95% confidence interval −0.35% to 0.18%), systolic blood pressure (−3.9mmHg, −8.9 to 1.1mmHg), total cholesterol concentration (−0.03 mmol/L, −0.28 to 0.22 mmol/L), or wellbeing scores (−0.7, −2.3 to 0.8). While there was a trend towards decreases in the proportion of patients with poorly controlled risk factors at follow-up, particularly for systolic blood pressure (52% (87/166) >130 mmHg in intervention v 61% (103/169) >130 mmHg in control), these changes were not significant. The process evaluation indicated that the intervention was generally delivered as intended, though 18% (35) of patients in the intervention group never attended any group meetings..")
48
Conclusions A group based peer support intervention is feasible in general practice settings, but the intervention was not effective when targeted at all patients with type 2 diabetes. While there was a trend towards improvements of clinical outcomes, the results do not support the widespread adoption of peer support.

49
Message/Comments 2型糖尿病患者の管理をよくする介入は難しい。 患者同士でのグループアプローチは効果がない ことが示唆された。 まず、参加しない者が多い! 教育的といってもいろいろ方法がある。 ティーチング、コーチング、チームアプロー チなど。 人的資源と時間がかかる割に成果が乏しいのが 現状なのかもしれない。

Similar presentations


>")
>")
及び経済産業省に帰属します。>")


