Download presentation
Presentation is loading. Please wait.

3
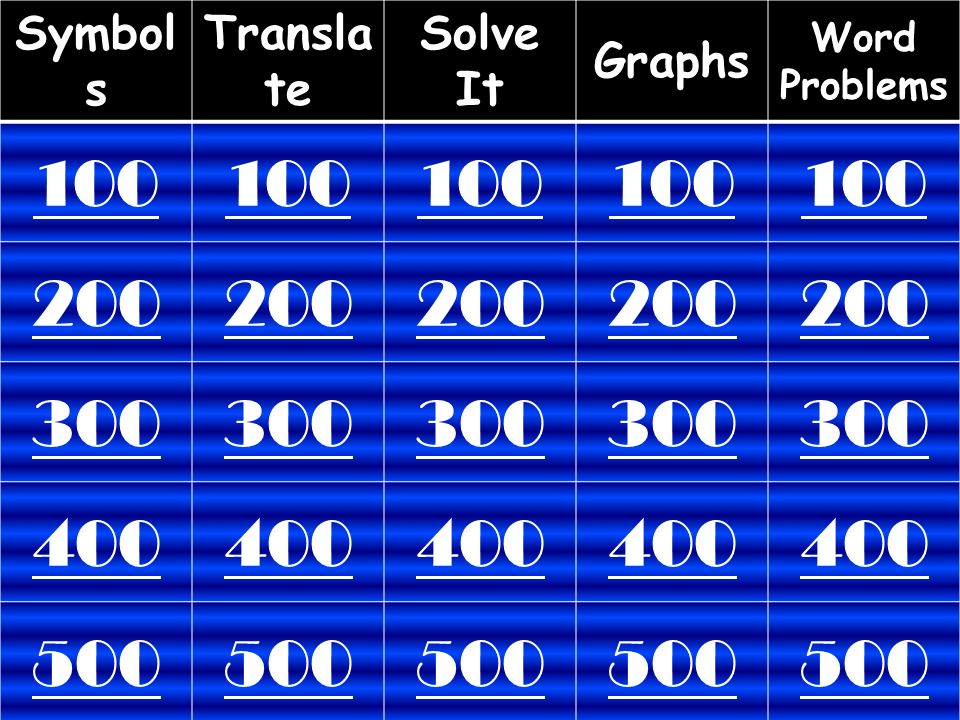
Symbol s Transla te Solve It Graphs Word Problems 100 200 300 400 500

4
This symbol represents “is no more than.”

5
≤ “less than or equal to” 100

6
This symbol represents “is at least.”

7
≥ “greater than or equal to” 20 0

8
This symbol represents “is a minimum of.”

9
≥ “greater than or equal to” 30 0

10
This symbol represents “is fewer than.”

11
≥ “fewer than” 40 0

12
This symbol represents “does not exceed.”

13
≤ “less than or equal to” 50 0

14
Translate into a number sentence: A number times five is less than thirty-seven.

15
5n < 37 100

16
Translate into a number sentence: Eight less than a number cut in half is at most sixty- two.

17
20 0

18
Translate into a number sentence: A number increased by fifteen, divided by thirteen.

19
30 0

20
Translate into a number sentence: Fred has $321 dollars in his bank account. He is going to save $42 a month for an unknown number of months. After how many months will Fred have no less than $657?

21
321 + 42n ≥ 657 40 0

22
Translate into a number sentence: Reggie owns a copying business. For copies that will total more than 100 pages Reggie charges a flat rate of $5. He then adds a charge of $0.08 per page. How many pages can a client copy if they want the cost to not exceed $14.84?

23
5 +.08p ≤ 14.84 50 0

24
Solve: n + 8 > 45

25
n > 37 100

26
Solve: n - 8 ≥ 32

27
n ≥ 40 20 0

28
What color socks is Mr. Frommann wearing today? Daily Double

29
Let’s take a look and see!!!! 30 0

30
b – 13.2 ≤ 123.36

31
n ≤ 110.16 40 0

32
Solve: b + 4.98 > 79

33
n > 74.02 50 0

34
Write an inequality to represent the graph below.

35
n ≥ 0 100

36
Write an inequality to represent the graph below.

37
n < -1 20 0

38
Write an inequality to represent the graph below.

39
n > 6 30 0

40
Write an inequality to represent the graph below.

41
n ≥ 0 40 0

42
Write an inequality to represent the graph below.

43
n < 2.5 50 0

44
Buddy must have a maximum of 20 candy canes on his Christmas tree. If c represents candy canes, write an inequality to represent this scenario.

45
C ≤ 20 100

46
Ted must eat at least 15 peanut butter cookies to win the cookie eating contest. Write an inequality to represent the scenario AND name a value that would make Ted lose the cookie eating contest.

47
C ≥ 15, if he ate LESS THAN 15 cookies he would lose 20 0

48
Riley the elf has c candy canes. Riley got into a scuffle with his sister. He ended up breaking 6 of the candy canes. He needs a minimum of 25 unbroken candy canes for his Christmas party. Write an inequality for the scenario

49
c - 6 ≥ 25 30 0

50
Julia has $20 to spend on ice cream. Each ice cream cone is $1.75. Julia buys ice cream for her friends, f. She wants to have a minimum of $5 left in her wallet after she buys all of her friends ice cream. Write an inequality for this scenario. If she buys ice cream for 5 friends will she have enough money left in her wallet?

51
20 – 1.75f ≥ 5 40 0

52
Evergreen Farms are selling Christmas trees. They must sell at least 100 trees to stay in business this year. The first week they sold 30 trees. The second week they sold 60 trees. The next week they sell t trees. Write an inequality. If t = 10 will they meet their goal?

53
50 0 30 + 60 + t ≥ 100 Yes they will meet their goal

Similar presentations


? < < ≤ ≥>")


Cost (dollars)>")
 Suppose that the function: f(x) = 3 x + 14 represents the cost to rent x video games from a local store. Jack has $ 19 in his wallet. How much more.>")
