Download presentation
Presentation is loading. Please wait.

1
Solid Waste Coordinator mailto: aakrause@ufl.edu
University of Florida Solid Waste Management Office Albert A. Krause Solid Waste Coordinator Bldg. 809 SW Radio Road P.O. Box Gainesville, FL TEL (352) FAX (352) mailto:
 FAX (352) mailto:")
2
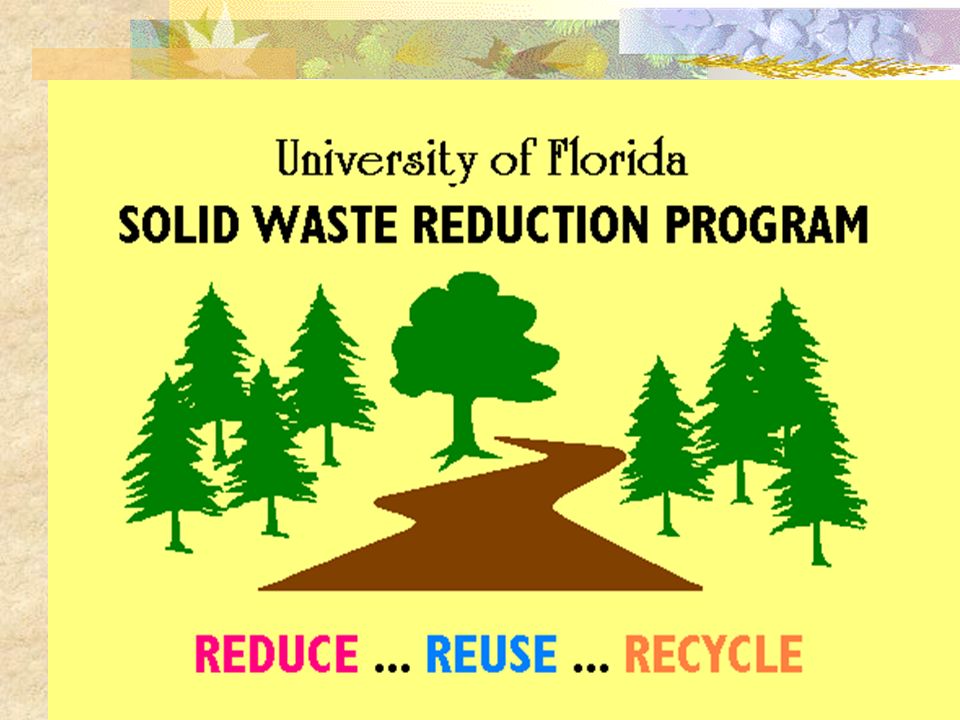
Solid Waste Reduction Program
University of Florida Solid Waste Reduction Program As of: July 1, 2005

3
Decreasing Solid Waste
Reduce Consumption of Materials Conservation pays Up front and afterward. Repair/Reuse Products Consider both replacement and disposal costs. Buy Repairable/Recyclable Products We can’t reuse the unusable. Recycle Used Products and Materials Recycling, where practical, can reduce our need for raw material, reduce energy needs by 30 to 90% and cut down on pollution and the demand for disposal sites.

4
State Goal (1988) Reduce landfill disposals by over 30% through recycling. Include paper, OCC, cans. University Objective Minimize operating costs through waste reduction and improved efficiency. Solid Waste Mission Minimize overall waste disposal costs while maintaining a recycling rate of at least 30%. Note: Initially, the objective was to totally minimize costs and recycling was largely limited to products that could be recycled more cheaply than if landfilled. To expand recycling, this tasking was modified to permit recycling of products provided the average cost of recycling, per ton, did not exceed the average cost of alternative disposal. This allowed the program to expand into less “profitable” products and areas. Further impetus to recycling has been provided by environmental regulations which raised the ante on the costs of disposing of many sensitive materials, like electronics.

5
Enrollment vs. Waste Production (Waste Includes Health Center/Shands)
48765 36243 During past 15 years: Enrollment grew 34.5% Gross Square Footage grew 45.3%, mostly for medical & research facilities Total Solid Waste grew only 17.7%, thanks to waste reduction initiatives Landfilled Waste grew by only 1.5%, thanks to recycling efforts NOTE: figures for total waste in FY are adjusted to discount 2500 tons of hurricane debris. 15013 19428 13396 17667 11404 11571

6
Annual Recycling Rate 34.4% 17% Adjusted for Hurricane Debris
Reduced Construction Activity 34.4% Generally, recycling tonnages increase as in-house construction/renovation activity increases. Demolition products are heavy, and contribute disproportionately to the recycling rate. Secondarily, construction and faculty relocations force office cleanouts, with a major impact on paper disposals (along with furniture disposals). Overall, recovery from the 2004 hurricanes added 2500 tons of yard debris and reduced our normal construction recycling by about 500 tons, neither of which is reflected above. If hurricane debris is included, UF’s recycling rate for FY was actually 42.7%, but UF’s real “normalized” recycling rate remains about 37%. GOAL= >30% 17%
. Overall, recovery from the 2004 hurricanes added 2500 tons of yard debris and reduced our normal construction recycling by about 500 tons, neither of which is reflected above. If hurricane debris is included, UF’s recycling rate for FY was actually 42.7%, but UF’s real normalized recycling rate remains about 37%. GOAL= >30% 17%")
7
UF Recycling Includes:
Office Paper (all kinds) Newsprint Cardboard Phone Books Magazines Junk Mail Soft-Cover Books Cotton Goods Cans (all types) Glass & Plastic Jars & Bottles Auto Batteries Ni-Cd, Li & Hg Batteries Used Oil & Filters Used Antifreeze Toner Cartridges Chemicals & Solvents White Goods Scrap Metal Precious Metals Wastewater Solids Used Pallets Yard Debris Masonry & Concrete Fluorescent Tubes Used Lumber Recycling activity is a mixture of centralized programs administered by the University Physical Plant, Environmental Health and Safety, and Surplus Property staff and de-centralized programs run by individual departments and activities. Centralized programs focus on products that constitute major portions of our waste stream and products that require central controls due to legal or environmental concerns. Decentralized programs handle unique or low-density materials like toner cartridges, used student furnishings and clothing, and used cotton goods (from laundry).
 Newsprint. Cardboard. Phone Books. Magazines. Junk Mail. Soft-Cover Books Cotton Goods. Cans (all types) Glass & Plastic. Jars & Bottles. Auto Batteries. Ni-Cd, Li & Hg. Batteries. Used Oil & Filters. Used Antifreeze. Toner Cartridges. Chemicals & Solvents. White Goods. Scrap Metal. Precious Metals Wastewater Solids. Used Pallets. Yard Debris. Masonry & Concrete. Fluorescent Tubes. Used Lumber. Recycling activity is a mixture of centralized programs administered by the University Physical Plant, Environmental Health and Safety, and Surplus Property staff and de-centralized programs run by individual departments and activities. Centralized programs focus on products that constitute major portions of our waste stream and products that require central controls due to legal or environmental concerns. Decentralized programs handle unique or low-density materials like toner cartridges, used student furnishings and clothing, and used cotton goods (from laundry).")
8
Scope of Recycling On-site support at over 350 major buildings and complexes. Over 1800 scheduled services per week at locations for paper products and beverage containers alone. Central drop-offs for scrap metal, white goods, beverage containers, and used shipping pallets. Central drop-off plus curbside collection of yard waste. Central drop-off facility supplemented by on-site collections for hazardous/environmentally sensitive recyclables (operated by Environmental Health &Safety Division). Central drop-off facility supplemented by on-site collections for electronics (operated by Surplus Property Office). Dispersed departmental collections of low-density/low frequency products (toner cartridges, clothing, etc.). Overall, over 100,000 collection service/year to manage. Over 1800 scheduled services per week at locations for paper and beverage containers alone. 800+ indoor paper collection sites. 400+ exterior collection sites for paper, cans & bottles
. Central drop-off facility supplemented by on-site collections for. electronics (operated by Surplus Property Office). Dispersed departmental collections of low-density/low frequency products (toner cartridges, clothing, etc.). Overall, over 100,000 collection service/year to manage. Over 1800 scheduled services per week at locations for paper and beverage containers alone indoor paper collection sites exterior collection sites for paper, cans & bottles.")
9
(Adjusted for ~ 2500 tons Hurricane Yard Debris)
Recycling (FY 2004): 6,096 + tons (Adjusted for ~ 2500 tons Hurricane Yard Debris) tons Yard Waste: ,224 Paper Products: ,936 Masonry/Concrete: Scrap Metal: Sludge: Cans, Bottles & Jars: (About 200 tons of other products were recycled, but were not centrally tracked.) Overall, hurricane recovery added 2500 tons of yard debris which is not reflected above. At the same time, hurricane recovery diverted many in-house projects, reducing our normal recycling activity by about 500 tons for the year. A more representative recycling figure would be about tons for the year.
: 6,096 + tons. (Adjusted for ~ 2500 tons Hurricane Yard Debris) tons. Yard Waste: 3,224. Paper Products: 1,936. Masonry/Concrete: 485. Scrap Metal: 351. Sludge: 272. Cans, Bottles & Jars: 128. (About 200 tons of other products were recycled, but were not centrally tracked.) Overall, hurricane recovery added 2500 tons of yard debris which is not reflected above. At the same time, hurricane recovery diverted many in-house projects, reducing our normal recycling activity by about 500 tons for the year. A more representative recycling figure would be about tons for the year.")
10
Waste Costs Facilities / Space Containers and Equipment Maintenance
Processing Collection Transport Disposal Several iterations may be involved, e.g., user to recycle bin, custodian to area dumpster, collector to processor, hauler to buyer, buyer to manufacturer.

11
Approx. Costs Per Ton – FY2003/04 (to Refuse Account)
Product Collection Cost Disposal Total Cost* General Refuse (Loose - Dumpsters) 71.50 43.50 115.00 Compacted Refuse (Compactors) 49.00 92.50 Construction Debris (Rolloffs) 40.00 80.00 Yard Waste - 22.50 Paper Products* 177.50 -22.50 155.00 Concrete/Masonry -- 7.00 Scrap Metal* 14.00 -30.00 -16.00 Pallets 56.00 Beverage Containers (Metal, Glass, Plastic) 2,000.00 25.00 2,025.00 Due to changes in University financial software, discrete financial costs for refuse & recycling were not available for July 2004-December This problem has been corrected and more current information will be available in July 2006. * Excludes external (e.g., custodian, client) costs and savings.
 Compacted Refuse (Compactors) Construction Debris (Rolloffs) Yard Waste Paper Products* Concrete/Masonry Scrap Metal* Pallets Beverage Containers (Metal, Glass, Plastic) 2, , Due to changes in University financial software, discrete financial costs for refuse & recycling were not available for July 2004-December This problem has been corrected and more current information will be available in July * Excludes external (e.g., custodian, client) costs and savings.")
12
General Observations The greater the amount of a product in your waste stream, the more likely it is that separation and recovery or diversion will be cost effective. Costs increase dramatically for separating and managing low density and mixed-component materials. Often the difference between #1 and #2 is dependent on the level at which waste is managed. It’s a factor of scale.

13
Reducing Solid Waste Costs
1. Reduce Waste Reduce consumption: buy less, discard less. Reuse, repair, re-sell or donate used items. Recycle waste materials into useful products. 2. Improve Efficiency Consolidate collection sites. Reduce waste volume through compaction. Reduce waste weight by pre-processing. Separate wastes of different classification or handling characteristics.

14
Recycling Benefits to UF
Smaller environmental footprint. Lower overall disposal costs. Smaller custodial workload. Secure document destruction. Enhanced public image. Improved morale.

15
Major Recycling Problems:
Composite end items. Irregular production rates. Container placement/space. Contamination of products. High colIection costs. Lack of local markets. Composite products are nearly impossible to separate and market – engineered wood products, laminates, paper-plastic mixes, and multi-material manufactured goods. Irregular production rates make it difficult and expensive to efficiently equip and routinely collect materials – especially under service contracts. Contamination of Products hurts recovery efforts, including: garbage in recycling bins recyclables into wrong bins food/beverage residues, packing materials Low-density products and dispersed products mean high colIection costs Un-flattened boxes, un-crushed bottles & cans, fluffy shredded paper require more container and transport space, more trips. Widely-dispersed products entail more travel time & fuel per service.

16
Recycling and Sustainability Issues
Landfill space is cheap and virtually unlimited. We are victims of our own technologic success. Waste reduction is inseparable from local, national, and global economics. Eventually, resource constraints and population growth will make goods expensive and services cheap – but it will require drastic changes in lifestyles. Despite claims to the contrary, landfill space is plentiful and cheap. This makes the extra costs of material separation, processing and recovery difficult to surmount as long as fuel and raw materials remain cheap. Our complex, multi-material construction and consumer products are made for low initial cost and one-time use. They are difficult, if not impossible, to repair, disassemble, or recycle without huge expenditures of time and energy. Even wood products (plywood, particle board, laminates, and treated lumber) have impractical to re-use or compost. Our economy is increasingly dependent on cheap goods and expensive labor, while most of the world is geared toward cheap labor and expensive goods (though ever more of the population is working toward the American model). In the short run, the pursuit of cheap goods favors local consumption and weighs against local recycling activity – but the balance is shifting in the competition for jobs and resources. The great socio-economic shift will come when resources become scarcer and people are more willing to spend money on re-use, repair, and recovery than on consumption and retailing. That day is pretty much at hand.
 have impractical to re-use or compost. Our economy is increasingly dependent on cheap goods and expensive labor, while most of the world is geared toward cheap labor and expensive goods (though ever more of the population is working toward the American model). In the short run, the pursuit of cheap goods favors local consumption and weighs against local recycling activity – but the balance is shifting in the competition for jobs and resources. The great socio-economic shift will come when resources become scarcer and people are more willing to spend money on re-use, repair, and recovery than on consumption and retailing. That day is pretty much at hand.")
17
Directions for the Future
Think long-term, think total life-cycle. Buy durable, repairable, recyclable products. Design for repairability. Design for economic material recovery. Make resource recovery (recycling) a front-office, not back-office activity. Promote volunteerism, individual responsibility.
 a front-office, not back-office activity. Promote volunteerism, individual responsibility.")
Similar presentations


 723-3153, ext. 315>")


 692-2979>")


 The Delaware Solid Waste Authority (DSWA) The Department.>")