Download presentation
Presentation is loading. Please wait.

1
The Physics of Space Plasmas William J. Burke 14 November 2012 University of Massachusetts, Lowell Magnetic Storms and Substorms

2
Course term-paper topics Geomagnetic Storms: (continued ) – Volland-Stern Model (details) The ring current’s nose structure Stormtime Plumes and Tails Energetic ion local-time distributions – Saturation of the cross polar cap potential Siscoe-Hill model – Transmission-line analogy Geomagnetic Substorms: – Growth-phase phenomenology near geostationary altitude – NEXL versus SCW picture: a perennial controversy Magnetic Storms and Substorms Lecture 9
 – Volland-Stern Model (details) The ring current’s nose structure Stormtime Plumes and Tails Energetic ion local-time distributions – Saturation of the cross polar cap potential Siscoe-Hill model – Transmission-line analogy Geomagnetic Substorms: – Growth-phase phenomenology near geostationary altitude – NEXL versus SCW picture: a perennial controversy Magnetic Storms and Substorms Lecture 9")
3
Magnetic Storms and Substorms Term-Paper Topics: The role of || in auroral arc formation (phenomenology & theory) IMF control of dayside cusp locations and dynamics Region1 – Region 2 control of magnetospheric E-field distributions. Pitch-angle scattering : Radiation belt “slot” formation ICMEs and magnetic clouds driving geomagnetic storms Volland-Stern model: Plume formation and other needed physics Student/faculty-defined topics

4
Magnetic Storms and Substorms The Volland-Stern single-particle model: At the stagnation point L S the potential is Since the last closed equipotential touches L S => calculate locus of this potential L A ( ) gives shape of zero-energy Alfvén boundary (ZEAB) Still don’t know what means or how to relate E M to the interplanetary medium.
 gives shape of zero-energy Alfvén boundary (ZEAB) Still don’t know what means or how to relate E M to the interplanetary medium.")
5
Magnetic Storms and Substorms The Volland-Stern single-particle model: At the magnetopause on the dawn (L Y, 3 /2) and dusk (L Y, /2) the potentials are approximately PC /2 and - PC /2, respectively. Average E across magnetosphere 1 L Y 1.5 L X

6
Magnetic Storms and Substorms ZEAB shape normalized to L S. L ast closed equipotential of a vacuum field model, not the plasmapause. L S as function of PC for P SW = 1, 10 nPa 1 = 2 3

7
Magnetic Storms and Substorms 12:00 06:00 18:00 Consider a simple example in which the dynamic pressure of the solar wind P SW and cross polar cap potential PC rise from 1 to 10 nPa and from 50 to 150 kV while decreases from 3 to 1. Consequently the ZEAB and the separatrix equipotentials move Earthward. Cold plasma between the old and new ZEAB finds itself on open equipotentials where it forms the stormtime magnetospheric plume. There is a conceptual difference between the ZEAB and the plasmapause. Plumes observed by IMAGE limited by intensity of resonant 517 Å scattering by cold He + ions.

8
Magnetic Storms and Substorms Smith and Hoffman, JGR, 79, 966 – 971, 1974.

9
Magnetic Storms and Substorms August 27, 1972 Apri 29-30, 1972 Maynard and Chen, JGR, 80, 1009 – 1013, 1975

10
Magnetic Storms and Substorms Huang, C. Y., W. J. Burke, and C. S. Lin, Low-energy ion precipitation during the Halloween storm, J. Atmos. Solar-Terr. Phys., 69, 101-108, 2007. In the previous lecture on magnetic- storm phenomenology we noted that during the recovery phase the ring current becomes more symmetric: Tsyganenko and Sitov (2005) Love and Gannon (2010) Cheryl Huang noticed that during the recovery phase of large storms DMSP was detecting large fluxes of precipitating ions in the dawn MLT sector, at latitudes well equatorward of the auroral electron boundary. We used a time-dependent version of the Volland-Stern model to try to explain this unexpected phenomenon.
 Love and Gannon (2010) Cheryl Huang noticed that during the recovery phase of large storms DMSP was detecting large fluxes of precipitating ions in the dawn MLT sector, at latitudes well equatorward of the auroral electron boundary. We used a time-dependent version of the Volland-Stern model to try to explain this unexpected phenomenon..")
11
Magnetic Storms and Substorms CRRES Orbit 589 during early recovery phase of March 1991 storm. V-S simulation inputs

12
Magnetic Storms and Substorms

13
Main-phase electric field period.

14
Magnetic Storms and Substorms Independent studies using AE-C, S3.2 and DE-2 measurements of PC all showed that the highest correlation was obtained with Interplanetary electric field (IEF) in mV/m. Since 1 mV/m 6.4 kV/ R E L G => width of the gate in solar wind (~ 3.5 R E ) through which geoeffective streamlines flow. LLBL potential IEF Burke, Weimer and Maynard, JGR, 104, 9989, 1999. A reminder of innocent but happy times Then the Bastille Day storm happened
 through which geoeffective streamlines flow. LLBL potential IEF Burke, Weimer and Maynard, JGR, 104, 9989, A reminder of innocent but happy times Then the Bastille Day storm happened.")
15
Magnetic Storms and Substorms Z Y BB BB Siscoe et al. (2002), Hill model of transpolar saturation: Comparisons with MHD simulations, JGR 107, A6, 1025. Ober et al. (2003), Testing the Hill model of transpolar potential saturation, JGR, 108, (A12), Model validation with F13 & F15 PC = I S / ( I + S ) I = 0 + G V B T Sin 2 ( /2) S = P SW 0.33 (nPa) /
, Hill model of transpolar saturation: Comparisons with MHD simulations, JGR 107, A6, Ober et al. (2003), Testing the Hill model of transpolar potential saturation, JGR, 108, (A12), Model validation with F13 & F15 PC = I S / ( I + S ) I = 0 + G V B T Sin 2 ( /2) S = P SW 0.33 (nPa) / .")
16
Magnetic Storms and Substorms MRC: ISM Simulations with IMF B Z = -2 and -20 nT

17
Magnetic Storms and Substorms Effects of Region 1 turn-on near main-phase onset

18
Magnetic Storms and Substorms During the late main phase of the April 2000 magnetic storm multiple DMSP satellites observed large amplitude FACs with B > 1300 nT). Associated electric fields on the night side were very weak suggesting relatively large P > 30 mho. No commensurate H measured on ground => Fukushima’s theorem? Do precipitating ions play a significant role in creating and maintaining P ? [Galand and Richmond, JGR, 2001] Huang, C. Y., and W. J. Burke, Transient sheets of field-aligned current observed by DMSP during the main phase of a magnetic storm, J. Geophys. Res., 109, 2004.

19
Magnetic Storms and Substorms Huang, C. Y. and W. J. Burke (2004) Transient sheets of field-aligned currents observed by DMSP during the main phase of a magnetic superstorm, JGR, 109, A06303. P ≈ (1/ 0 ) [ B Z / E Y ]. Y [ B Z - 0 ( P E Y - H E Z )] = 0
 Transient sheets of field-aligned currents observed by DMSP during the main phase of a magnetic superstorm, JGR, 109, A P ≈ (1/ 0 ) [ B Z / E Y ]. Y [ B Z - 0 ( P E Y - H E Z )] = 0.")
20
Magnetic Storms and Substorms Transmission line model “ Measured” Poynting Flux V AR = Alfvén speed in reflection layer V AS = Alfvén speed at satellite location

21
Magnetic Storms and Substorms Growth phases occur in the intervals between southward turning of IMF B Z and expansion- phase onset. They are characterized by: Slow decrease in the H component of the Earth’s field at auroral latitudes near midnight. Thinning of the plasma sheet and intensification of tail field strength. We consider growth phase electrodynamics observed by the CRRES satellite near geostationary altitude in the midnight sector. - McPherron, R. L., Growth phase of magneto- spheric substorms, JGR, 75, 5592 – 5599, 1970. - Lui, A. T. Y., A synthesis of magnetospheric substorm models, JGR, 96, 1849, 1991. - Maynard, et al., Dynamics of the inner magnetosphere near times of substorm onsets, JGR, 101, 7705 - 7736, 1996. - Erickson et al., Electrodynamics of substorm onsets in the near-geosynchronous plasma sheet, JGR, 105, 25,265 – 25,290, 2000.

22
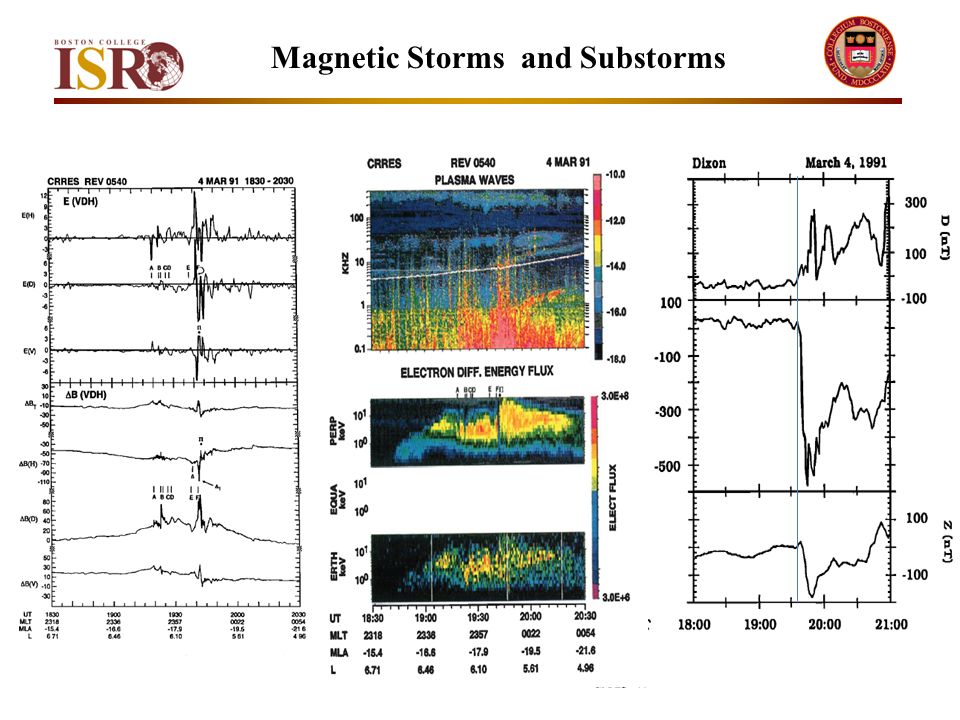
Magnetic Storms and Substorms CRRES measurements near local midnight and geostationary altitude during times of isolates substorm growth and expansion phase onsets Ionospheric footprints of CRRES trajectories during orbits 535 (red) and 540 (blue).
 and 540 (blue).")
23
Magnetic Storms and Substorms

25
LEXO = local explosive onset EXP = explosive growth phase Erickson et al., JGR 2000: Studied 20 isolated substorm events observed by CRRES. We will summarize one in which the CRRES orbit (461) mapped to Canadian sector
 mapped to Canadian sector.")
26
Magnetic Storms and Substorms

27
The Bottom line: The substorm problem has been with us for a long time. In the 1970s the concepts of near-Earth neutral-line reconnection and disruption of the cross-tail current sheet were widely discussed. To this day there are pitched battles between which has precedence in substorm onset. CRRES data seem to support the substorm current wedge model. During the growth phase the electric field oscillations have little to no associated magnetic perturbations and no measurable field-aligned currents or Poynting flux. (An electrostatic gradient-drift mode that leaves no foot prints on Earth) This ends when E becomes large and E total = E 0 + E turns eastward and j E total < 0. Region becomes a local generator coupling the originally electrostatic to an electromagnetic Alfvén model that carries j || and S || to the ionosphere. Pi 2 waves seen when Alfvén waves reach the ionosphere.
 This ends when E becomes large and E total = E 0 + E turns eastward and j E total < 0. Region becomes a local generator coupling the originally electrostatic to an electromagnetic Alfvén model that carries j || and S || to the ionosphere. Pi 2 waves seen when Alfvén waves reach the ionosphere..")
28
Magnetic Storms and Substorms McPherron, R. L., C. T. Russell, and M. P. Aubry (1973), Satellite studies of magnetospheric substorms on August 15, 1968: 9. Phenomenological model for substorms, J. Geophys. Res., 78(16), 3131–3149.
, Satellite studies of magnetospheric substorms on August 15, 1968: 9. Phenomenological model for substorms, J. Geophys. Res., 78(16), 3131–")
Similar presentations


, Yaireska Collado-Vega (University of Puerto Rico), Xi.>")


 Lecture 1- Space Environment –Matter in.>")
 pulse of southward IMF. Magnetospheric storms are large,>")

 Cheng (1,2), T. F. Chang (2), Sorin Zaharia (3), N. N. Gorelenkov (4) (1)Plasma and Space Science.>")
 Faculty of Physics, Department of Electronic.>")