Download presentation
Presentation is loading. Please wait.

1
NORCCAG audit report 2011: mortality, survival and reconstructive rectal surgery David W Borowski for the members of the Northern Region Colorectal Cancer Audit Group (NORCCAG)
")
2
Mortality & Survival 1 August 2007 – 31 July 2010 Abdominal resective surgery (n=3,526) Excluding TEMS, polypectomy, stoma only operations and per-anal excisions Patient-related factors 9 Cancer units Individual surgeons (mortality) > 20 CRC operations p.a. Pooled for low-volume surgeons

3
Mortality & Survival Elective mortality < 7 % Emergency mortality < 20 % Colorectal specialists MDT membership (2-3 surgeons / 200,000) Caseload (>20 curative resections / year)
 Caseload (>20 curative resections / year)")
4
Mortality 169/3,526 (4.8%) Deaths%p* Sex0.251 Female634.3 Male1065.1 Age<0.001 < 65181.6 65-74393.7 75-84768.0 ≥ 85179.2 Unknown199.5 ASA grade<0.001 I20.5 II322.1 III707.6 IV2923.8 V375.0 unknown336.0 Deaths%p* Tumour site0.011 Right colon826.2 Left colon504.1 Rectum373.8 Dukes’ stage<0.001 A172.9 B564.9 C544.7 “D”2610.4 Unknown164.0 Urgency<0.001 Elective / planned963.4 Emergency / urgent5712.6 Unknown167.5
 Deaths%p* Sex0.251 Female634.3 Male Age<0.001 < ≥ Unknown199.5 ASA grade<0.001 I20.5 II322.1 III707.6 IV V375.0 unknown336.0 Deaths%p* Tumour site0.011 Right colon826.2 Left colon504.1 Rectum373.8 Dukes’ stage<0.001 A172.9 B564.9 C544.7 D Unknown164.0 Urgency<0.001 Elective / planned963.4 Emergency / urgent Unknown167.5")
5
Mortality 169/3,526 (4.8%) OR95% CIp Sex Female1.0 Male1.310.93 – 1.840.124 Age < 651.0 65-741.841.03 – 3.310.041 75-843.842.22 – 6.66<0.001 ≥ 853.011.44 – 6.280.003 Unknown4.242.11 – 8.55<0.001 ASA grade I1.0 II2.810.67 – 11.830.159 III7.471.79 – 31.10.006 IV22.635.18 – 98.95<0.001 V203.1813.0 – 3,18<0.001 unknown6.301.48 – 26.740.013 OR95% CIp Tumour site Right colon1.0 Left colon0.840.57 – 1.240.384 Rectum1.070.69 – 1.680.751 Dukes’ stage A1.0 B1.280.71 – 2.280.410 C1.260.70 – 2.240.442 “D”2.591.30 – 5.160.007 Unknown1.360.66 – 2.800.400 Urgency Elective / planned1.0 Emergency / urgent2.451.65 – 3.65<0.001 Unknown1.901.05 – 3.460.035
 OR95% CIp Sex Female1.0 Male – Age < – – 6.66<0.001 ≥ – Unknown – 8.55<0.001 ASA grade I1.0 II – III – IV – 98.95<0.001 V – 3,18<0.001 unknown – OR95% CIp Tumour site Right colon1.0 Left colon – Rectum – Dukes’ stage A1.0 B – C – D – Unknown – Urgency Elective / planned1.0 Emergency / urgent – 3.65<0.001 Unknown –")
6
Cancer units UnitAll resectionsElectiveEmergency DeathsResections%DeathsResections%DeathsResections% 183432.362842.11372.7 2325545.8144513.1136320.6 5254026.293182.8158018.8 7315505.6224734.776011.7 9162945.492453.763716.2 10204514.4123393.565610.7 1192224.161833.332412.5 12132894.592413.73446.8 13154213.693262.83535.7 All 16935264.89628603.45745412.6

7
Consultant teams ConsultantAll resectionsElectiveEmergency CodeDeathsResections%DeathsResections%DeathsResections% 172101456.951244.041428.6 23594735.54666.1030.0 30250680.00580.005 314051024.93973.11250.0 54366679.06629.7040.0 -//- 272713923.32802.50110.0 281442712.82593.4090.0 Pool6512875.1239992.33420216.8 missing162636.192094.364214.3 Total16935264.89628603.45745412.6

8
Consultant information

9
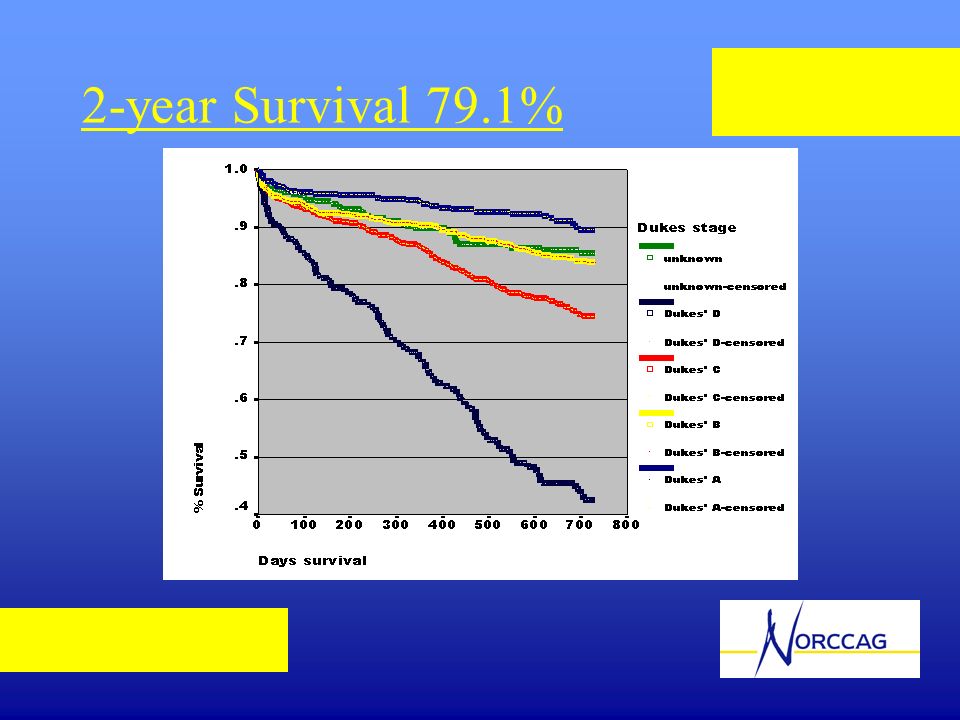
2-year Survival 79.1%

11
Cancer units UnitAll resectionsElectiveEmergency DeathsAlive*% OSDeathsAlive*% OSDeathsAlive*% OS 1449979.5337580.471072.5 28615680.14913285.623752.1 55111284.62210291.327860.7 79316077.47114479.3181262.7 9426082.5284685.013562.3 108711672.8487278.8161359.9 11485771.9314276.215229.9 12356983.3206088.313861.4 135810580.4336784.716557.4 All54493479.133574083.31487057.9 * Numbers at risk remaining in the analysis at 2 years, excluding censored patients

12
Rectal restoration 1 April 2006 – 31 July 2010 n=2,217 RC patients 1,752 (79.0%) surgery 1,334 (76.1%) abdominal resections < 30 % APER (+ Hartmanns)
 surgery 1,334 (76.1%) abdominal resections < 30 % APER (+ Hartmanns)")
13
Rectal surgery (n=1,752) OperationAbdominal resectionLocal ExcisionNo resectionUnknown Anterior Resection322 (24.1%) Anterior Resection & covering stoma490 (36.7%) APER342 (25.6%) Hartmanns100 (7.5%) Panproctocolectomy16 (1.2%) Per-anal Excision / Polypectomy / TEMS88 (100%) Stoma only86 (42.3%) Stent28 (13.7%) Other64 (4.8%)89 (43.8%) Not given127 (100%) All1,33488203127
 OperationAbdominal resectionLocal ExcisionNo resectionUnknown Anterior Resection322 (24.1%) Anterior Resection & covering stoma490 (36.7%) APER342 (25.6%) Hartmanns100 (7.5%) Panproctocolectomy16 (1.2%) Per-anal Excision / Polypectomy / TEMS88 (100%) Stoma only86 (42.3%) Stent28 (13.7%) Other64 (4.8%)89 (43.8%) Not given127 (100%) All1,")
14
Rectal surgery (n=1,752)
")
15
Rectal surgery (n=1,334)
")
16
Summary Operative mortality rates vary throughout the region between surgeons and cancer units, but are generally within the accepted range 2-year survival rates also show variation between cancer units Rates of rectal restoration vary greatly between cancer units, and appear to be outside the recommended minimum of 70% in some units Inaccurrate and incomplete data collection complicates, and potentially biases, the data analysis

Similar presentations


 MDT DATA FOR PATIENTS DIAGNOSED AUGUST 2010-JULY 2011 YSBYTY GWYNEDD (YG) MDT.>")


 First seen in centre with thoracic surgery? Number With a tissue diagnosis.>")


