Download presentation
Presentation is loading. Please wait.

1
Scotland's Changing Fiscal Framework through the Prism of Understanding Society. David Bell University of Stirling

2
The Scottish Electoral Map in 2010 and 2015

3
The Changing Settlement: Timeline 843 - Kenneth MacAlpin – first king of Scotland 1707 – Union of the Parliaments 1998 – Scottish Parliament established 2012 – Scotland Act 2012 2015 – Scotland Act 2015? ? – Independence (again) or full fiscal autonomy (FFA) within the UK? Scottish Rate of Income Tax (SRIT) Land and Buildings Transaction Tax Landfill Tax (Nearly) all of income tax Share of VAT Air Passenger Duty Welfare Powers Referendum (Sep 2014) The “Vow” The Smith Commission (Nov 2014) Draft legislation (Jan 2015) Power to vary basic rate of income Tax by (up to) 3p. Never used.
 or full fiscal autonomy (FFA) within the UK. Scottish Rate of Income Tax (SRIT) Land and Buildings Transaction Tax Landfill Tax (Nearly) all of income tax Share of VAT Air Passenger Duty Welfare Powers Referendum (Sep 2014) The Vow The Smith Commission (Nov 2014) Draft legislation (Jan 2015) Power to vary basic rate of income Tax by (up to) 3p. Never used..")
4
Outline How is Scotland the same as the rest of the UK? How is it different? The present arrangements - funding, policy environment The UK’s changing fiscal environment Conclusions

5
How is Scotland the same? Source: Understanding Society Wave d

6
Potted view of Scottish economic performance before and after introduction of Scottish Parliament in 1998

7
The Social Environment Identity

8
Slightly more authoritarian? Source: British Social Attitudes Survey

9
More left wing? Source: British Social Attitudes Survey

10
More sympathetic to welfare? Source: British Social Attitudes Survey

11
Inequality of income? Source: Understanding Society

12
Satisfaction with health, life Source: Understanding Society

13
How is it different? Proportion of adults born outside UK Source: Understanding Society Waves a-d

14
Scotland the White? Source: Understanding Society

15
Slightly older population Source: Understanding Society Implications for fiscal sustainability?

16
Satisfaction with health may be relative? Source: Understanding Society

17
Significant health inequalities

18
Higher public spending per head National Statistics 2009-10 outturn 2010-11 outturn 2011-12 outturn 2012-13 outturn 2013-14 outturn England97 Scotland113 115117115 Wales109110112111 Northern Ireland121 124 123 UK identifiable expenditure 100 Source: HMT: Public Expenditure Statistical Analysis (July 2015)
")
19
How is Scotland’s Funding Determined? Welfare – demand driven – paid by UK Government DEL – base and increment – known as the “block grant” – determined by the “Barnett Formula” Scotland receives its population share of any grant increase agreed for “comparable” English departments such as health and education

20
Scotland: The Policy Environment Scottish Government: areas of responsibility (spending) – Health – Social care – Education – Local government – Justice – Transport Opportunities for policy analysis? Distinctive Scottish policies – Long-term care – University tuition fees – Prescription charges

21
Policy environment – “The Commission on the Future Delivery of Public Services” Priorities – Concentrating the efforts of all services on delivering integrated services that deliver results – Prioritising preventative measures to reduce demand and lessen inequalities – Identifying and targeting the underlying causes of inter-generational deprivation and low aspiration” – Implications for longitudinal studies?

22
Public Bodies (Joint Working) (Scotland) Act Granted royal assent on April 1, 2014. It will put in place: – Nationally agreed outcomes, which will apply across health and social care, and for which NHS Boards and Local Authorities will be held jointly accountable – A requirement on NHS Boards and Local Authorities to integrate health and social care budgets – A requirement on Partnerships to strengthen the role of clinicians and care professionals, along with the third and independent sectors, in the planning and delivery of services – Exogenous(?) policy variation on (similar/same?) populations – opportunities for Understanding Society?
 policy variation on (similar/same ) populations – opportunities for Understanding Society .")
23
The Changing Fiscal Environment

24
Scotland’s increasing tax powers

25
Full fiscal autonomy with different oil prices

26
Scottish Rate of Income Tax (SRIT) Income Income Tax Rate £10k £42k £100k 20p 40p 50p 10p Scottish Government HM Government = £4.7bn Vertical tax competition within shared tax base? Horizontal tax competition over mobile tax base? 15p £52k

27
Support for moving fiscal responsibility to Holyrood Source: Centre on Constitutional Change Survey

28
Preferences for taxes and benefits among those who wish powers moved to Holyrood Source: Centre on Constitutional Change Survey

29
Principles? Logic? Who bears what risks? Accountability? Who controls macroeconomic policy Efficiency How important is size asymmetry?

30
Decentralisation ratios in OECD countries

31
The Block Grant Adjustment – How will it work? Year 1 <£30bn? A C Scottish Income Tax Revenue Reduced Block Grant: size of reduction determined by growth in UK tax base Year 2 A* C £30bn Shortfall if Scottish income tax not growing as fast as UK income tax The Indexed Deduction Method B B* D*

32
Determining the Scottish (Welsh?) future budget Change in Scottish Government Budget Growth in Scottish tax base Scottish population share UK tax revenue in period 0 Share of Scottish taxes in period 0 going to UK government Share of Scottish tax revenues retained by Scottish Parliament Scottish taxes in period 0 Growth in rUK tax base Barnett Formula Block Grant Adjustment
 future budget Change in Scottish Government Budget Growth in Scottish tax base Scottish population share UK tax revenue in period 0 Share of Scottish taxes in period 0 going to UK government Share of Scottish tax revenues retained by Scottish Parliament Scottish taxes in period 0 Growth in rUK tax base Barnett Formula Block Grant Adjustment")
33
The Budgetary Effect of Slower Scottish Tax Base Growth

34
Modelling the tax and welfare provisions – CCC Research Understanding Society Scottish sample Microsimulation Software Differences in tax rates Differences in welfare benefits Differences in growth rates Differences in demography Effects on block grant Distributional effects Effects on net household income

35
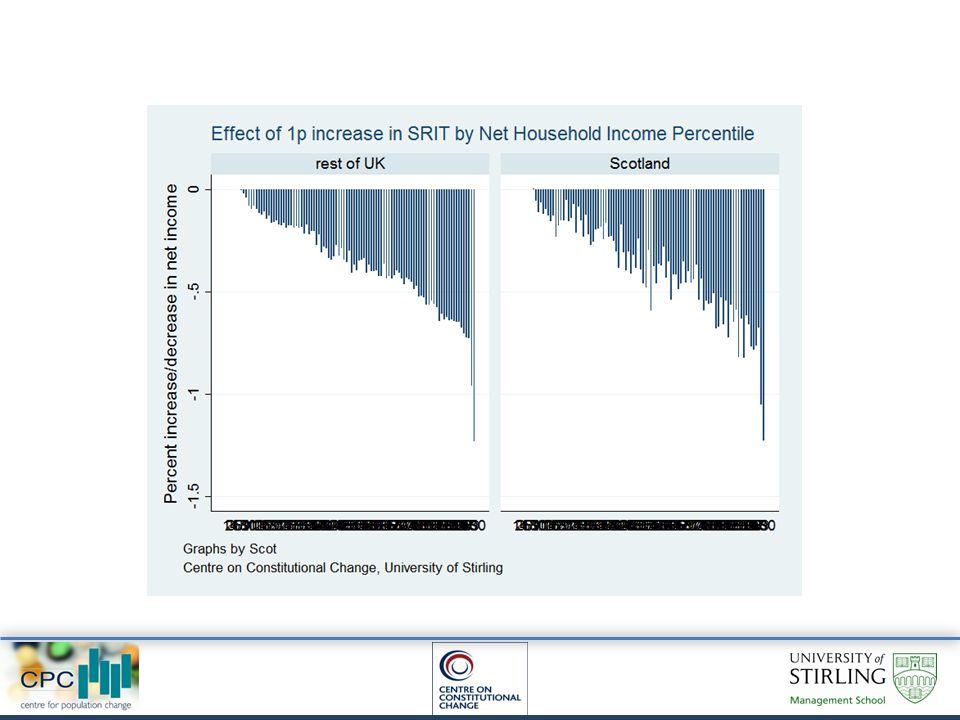
1p increase in SRIT

37
How stable is the income tax band distribution? 2012 Non- TP Basic rate Upper rate Additi onal rate Total 2009 Non- TP 52.7743.823.230.19100 Basic rate 12.5882.254.990.17100 Upper rate 6.6823.9565.613.76100 Total24.9466.58.160.4100 2012 Non- TP Basic rate Upper rate Additi onal rateTotal 2009 Non- TP 54.0443.232.50.23 100 Basic rate 10.3884.954.530.13 100 Upper rate 4.9629.9161.73.43 100 Total 22.2970.037.330.35 100 rUK Scotland

38
New powers over welfare coming to Scotland Benefits for carers, disabled people and those who are ill Benefits covered by the Regulated Social Fund Discretionary housing payments End of any consensus on UK-wide social insurance? Administrative nightmare How to adjust Scottish budget to cover welfare payments? Interaction between welfare powers and Scottish policy initiatives (eg free personal care)
.")
39
Welfare powers being transferred

40
Attendance Allowance Share

41
Disability Living Allowance

42
Conclusions Profound effects on the (unwritten) UK constitution are in train Chaotic fiscal decentralisation Existing funding structures have no principled rationale – proposed alternatives have even less – fiscally unsustainable Leading to break-up of the UK in the (near/distant?) future? But – great opportunities for social science – particularly longitudinal studies such as Understanding Society

Similar presentations