Download presentation
Presentation is loading. Please wait.

2
Health Care and Community Economics Presentation at: Southern Institute for Rural Development Fort Meyers, Florida September 8-10, 2003

3
Health Care and Community Economics By: Gerald A. Doeksen Regents Professor and Extension Economist Phone: (405) 744-6081 Email: gad@okstate.edu Cheryl F. St. Clair Assistant State Extension Specialist Phone: (405) 744-6081 Email: cheryl@okstate.edu RURAL DEVELOPMENT COOPERATIVE EXTENSION SERVICE OKLAHOMA STATE UNIVERSITY
 Cheryl F. St. Clair Assistant State Extension Specialist Phone: (405) RURAL DEVELOPMENT COOPERATIVE EXTENSION SERVICE OKLAHOMA STATE UNIVERSITY.")
4
To demonstrate the importance of the health sector to the rural economy and Helping Decision-Makers Maintain Primary Health Care Services in Rural Communities Overall Objective: To discuss what community leaders can do to improve primary health care

5
More specifically: 1. Measure the total impact of the health sector on a community’s economy; 2. Illustrate the importance of the health sector for industrial growth; 3. Illustrate the importance of the health sector for retirement growth; 4. Discuss and demonstrate what community leaders can do to maintain and promote their health sector; and 5. Review a community health planning process.

6
ComponentEmployeesPayroll HospitalSubtotal Physicians, Dentists and Other Professionals Physicians (2) 20.0 $590,670 Dentists (2) 8.0$322,244 Optometrists (2) 6.5$309,200 Chiropractors (1) 2.0$80,000 Subtotal Nursing Homes and Protective Care (2) Subtotal Other Medical & Health Services Home Health Care (4) County Health Department DME Suppliers Subtotal 35.0$583,333 11.0$232,920 12.5 $267,200 Pharmacies (3) Subtotal TOTALS Local Data Needed for Health Sector Impact Analysis Atoka County, Oklahoma 303.0 $6,755,067 36.5 $1,302,114 92.0 $1,272,000 19.0 $697,500 97.0 $2,400,000 58.5 $1,083,453
 20.0 $590,670 Dentists (2) 8.0$322,244 Optometrists (2) 6.5$309,200 Chiropractors (1) 2.0$80,000 Subtotal Nursing Homes and Protective Care (2) Subtotal Other Medical & Health Services Home Health Care (4) County Health Department DME Suppliers Subtotal 35.0$583, $232, $267,200 Pharmacies (3) Subtotal TOTALS Local Data Needed for Health Sector Impact Analysis Atoka County, Oklahoma $6,755, $1,302, $1,272, $697, $2,400, $1,083,453")
7
Overview of Community Economic System Households Industry Basic Services Goods & $ Inputs Products Inputs $$ $ $ Services $$ Labor

8
Health SectorEmployment ComponentsEmploymentMultiplierImpact Hospital Physicians & Dentists Nursing & Protective Facilities Other Medical & Health Services Pharmacies 1.70 1.79 1.54 1.62 1.49 TOTALS 97.0 36.5 92.0 58.5 19.0 303.0 165 65 142 95 28 495 in Atoka County, Oklahoma Economic Impact of the Health Sector on Employment

9
Health SectorIncome ComponentsIncomeMultiplierImpact Hospital Physicians & Dentists Nursing & Protective Facilities Other Medical & Health Services Pharmacies 147 1.34 1.66 1.62 1.61 TOTALS $2,400,000 $1,302,114 $1,272,000 $1,083,453 $697,500 $6,755,067 $3,528,000 $1,744,833 $2,111,520 $1,755,194 $1,122,975 $10,262,522 Economic Impact of the Health Sector on Income in Atoka County, Oklahoma

10
Employment, Income, Retail Sales, and Sales Tax Collections Resulting from the Health Sector in Atoka County, Oklahoma Health Sector Components Employment Impact Income Impact Retail Sales 3 Cent Sales Tax $3,753 $375,293 Hospital$1,179,040$11,790 Physicians & Dentists$583,114$5,831 Nursing & Protective Facilities$705,659$7,057 Other Medical & Health Services$586,577$5,866 Pharmacies TOTALS$3,429,683$34,297 $3,528,000 $1,744,833 $2,111,520 $1,755,194 $1,122,975 $10,262,522 165 65 142 95 28 495

11
Summary of Research Studies Direct and secondary health sector employment from 15-20 percent of all employees Hospital often second largest employer in community Hospital and nursing homes employ large numbers Employment multipliers ranged from 1.30 to 1.81 Income multipliers ranged from 1.46 to 1.87 Direct health sector employment from 10-15 percent of all employees

12
Impact of Hospital Closures on Physician Supply Studied 132 communities where hospitals closed in 80’s 49 percent of the towns lost physicians during two years after closing 13 percent FEWER physicians in communities after two years

13
Health Services Promote Job Growth

16
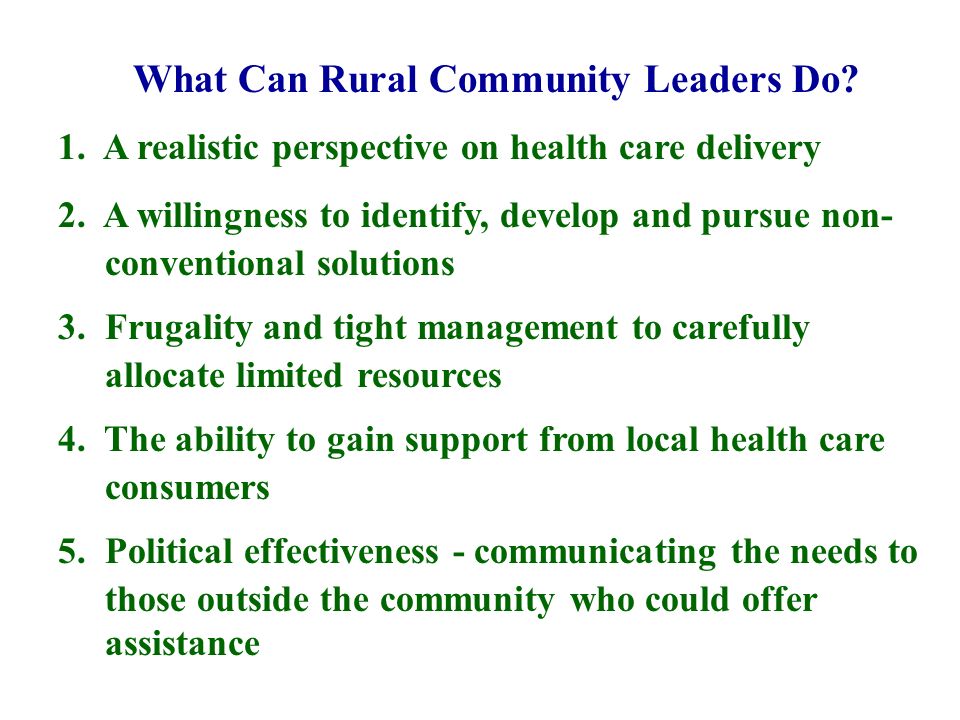
What Can Rural Community Leaders Do? 1. A realistic perspective on health care delivery 2. A willingness to identify, develop and pursue non- conventional solutions 3. Frugality and tight management to carefully allocate limited resources 4. The ability to gain support from local health care consumers 5. Political effectiveness - communicating the needs to those outside the community who could offer assistance

17
What Can We Do? Help educate consumers and providers Help community leaders plan their health delivery system: Community health planning Conduct feasibility studies

18
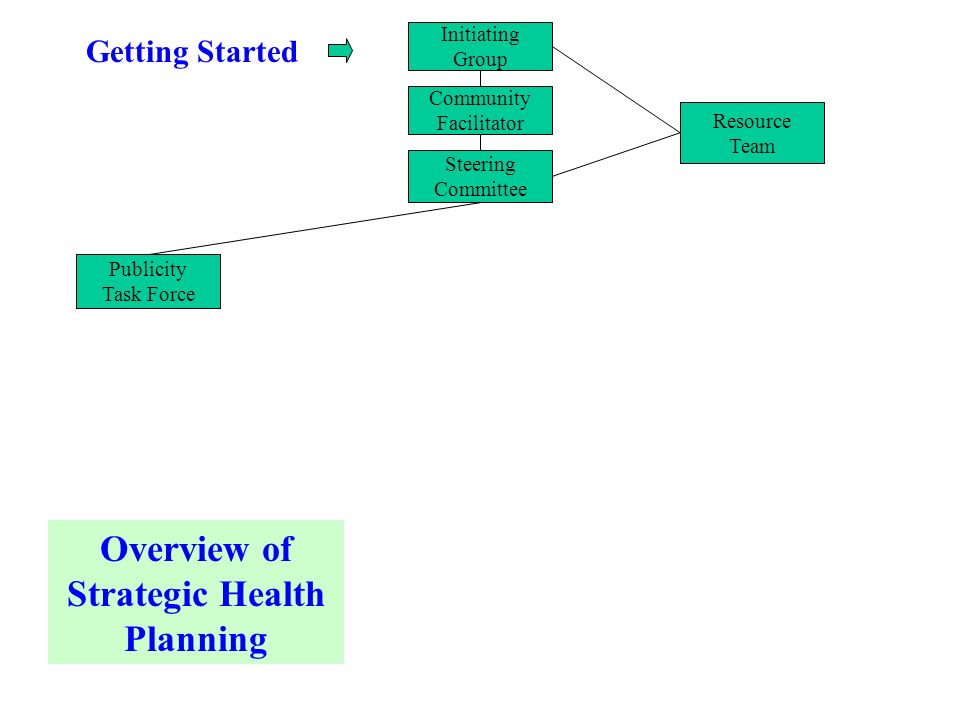
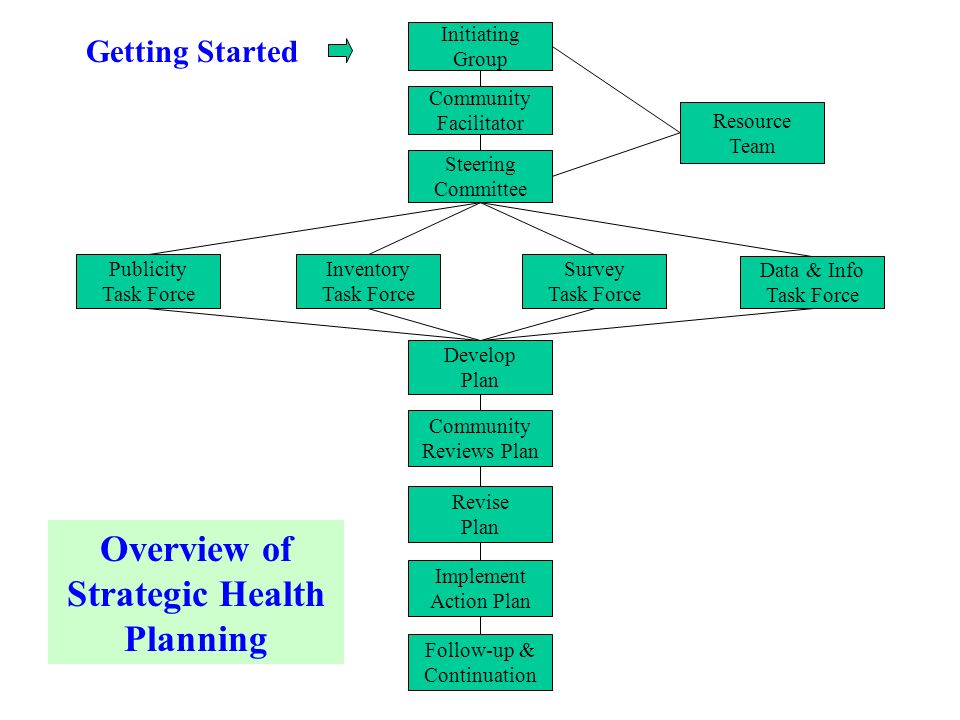
Overview of Strategic Health Planning Getting Started Initiating Group

19
Overview of Strategic Health Planning Getting Started Initiating Group Community Facilitator Steering Committee Resource Team

21
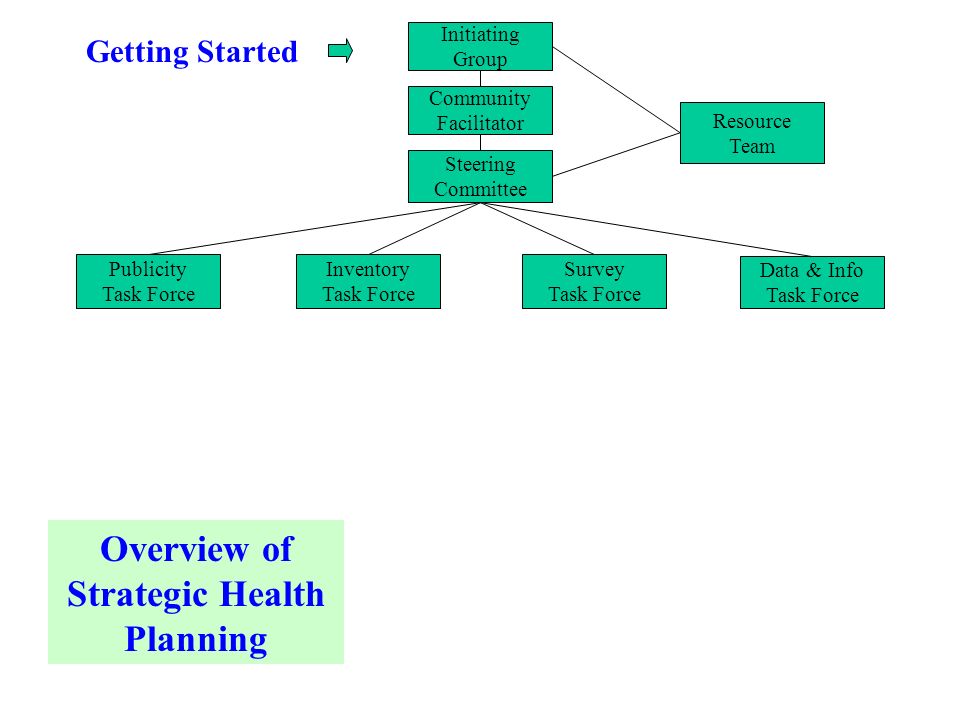
Overview of Strategic Health Planning Getting Started Initiating Group Community Facilitator Steering Committee Resource Team Publicity Task Force

22
Overview of Strategic Health Planning Getting Started Initiating Group Community Facilitator Steering Committee Resource Team Publicity Task Force Inventory Task Force

24
Overview of Strategic Health Planning Getting Started Initiating Group Community Facilitator Steering Committee Resource Team Survey Task Force Publicity Task Force Inventory Task Force

26
Overview of Strategic Health Planning Getting Started Initiating Group Community Facilitator Steering Committee Resource Team Survey Task Force Data & Info Task Force Publicity Task Force Inventory Task Force

28
Overview of Strategic Health Planning Getting Started Initiating Group Community Facilitator Steering Committee Resource Team Survey Task Force Data & Info Task Force Publicity Task Force Inventory Task Force Develop Plan Community Reviews Plan Revise Plan Implement Action Plan Follow-up & Continuation

30
Basic Methodology for Analyzing an Issue STEPS I.Estimate Needs II.Project Costs A.Capital or Start-up B.Annual Operating III.Estimate Revenue IV. If Doesn’t Break Even, Other Sources of Funds

31
EXAMPLE OF A HEALTH FEASIBILITY STUDY To illustrate this methodology, a primary care physician feasibility study, including the cost of establishing a primary care physician practice, will be presented. The information is designed to assist local decision-makers in assessing the need and potential for primary care physician services and in assessing the cost of establishing a new primary care physician practice.

33
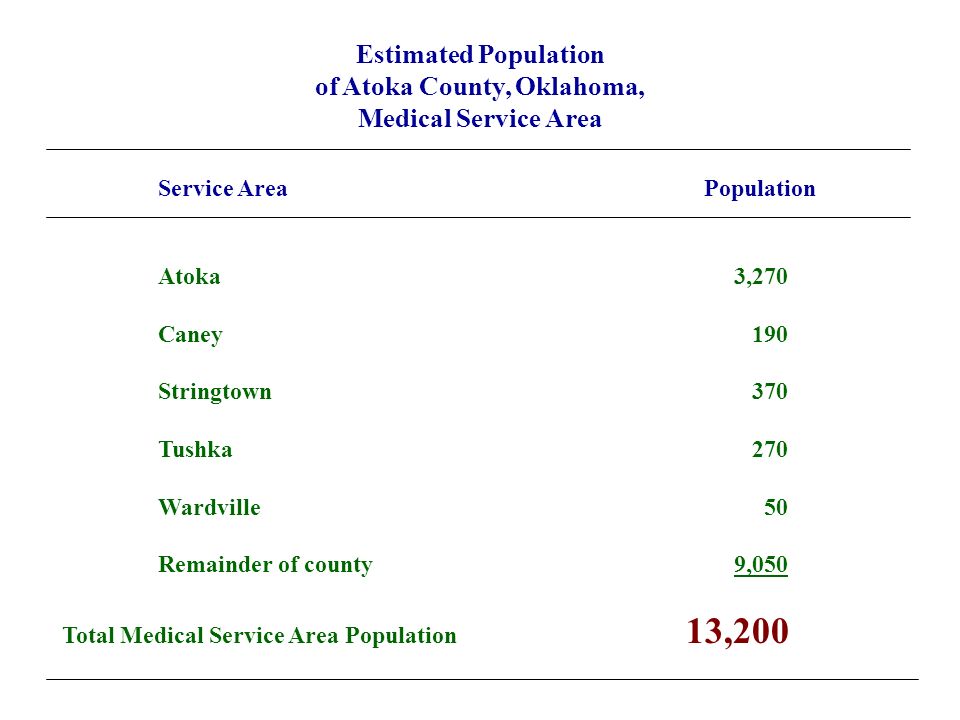
Estimated Population of Atoka County, Oklahoma, Medical Service Area Service Area Population Atoka3,270 Caney 190 Stringtown 370 Tushka 270 Wardville 50 Remainder of county9,050 Total Medical Service Area Population 13,200

34
Total Annual Physician and Primary Care Physician Office Visits Generated in the Atoka County Medical Service Area ANNUAL PHYSICIAN OFFICE VISITS MALE FEMALE Total VisitTotal VisitTotal Physician Age Population RateVisits Population RateVisits Visits Under 151,408 2.43,379 1,257 2.2 2,765 6,144 15-241,029 1.01,029 820 2.4 1,968 2,997 25-442,071 1.63,314 1,553 3.3 5,125 8,439 45-64 1,607 3.04,821 1,506 4.0 6,024 10,845 65-74 465 5.22,418 579 5.8 3,358 5,776 75+ 379 6.5 2,464 563 6.53,660 6,124 Total 6,959 17,425 6,278 22,900 40,325 Annual Primary Care Physician Office Visits = 25,082 Based on 62.2% of Total Physician Office Visits = Primary Care Physician Office Visits

35
Primary Care Physician Office Visits Given Usage By Local Residents in Atoka County, Oklahoma, Medical Service Area 70% 75% 80% 85% 90% 95% 100% Usage Level17,55718,81220,066 21,320 22,57423,82825,082 No. of Physicians 3.5 3.8 4.0 4.3 4.5 4.8 5.0 If 85% usage level, then 21,320 total primary care physician office visits for an estimated 4.3 Total Primary Care Physicians Based on 4,976 average primary care office visits/ physician practice/year in Oklahoma

36
$62,505

37
$10,172

38
Alternatives 1 & 2 Estimated Annual Capital & Operating Costs for a Primary Care Physician Practice in Atoka Costs for Costs for 2,750 4,750 Visits Visits ESTIMATED ANNUAL CAPITAL COSTS ESTIMATED ANNUAL OPERATING COSTS Total Annual Building Costs Total Annual Office Costs Total Annual Medical Costs Total Personnel Costs with Benefits TOTAL ANNUAL OPERATING EXPENSES TOTAL ANNUAL CAPITAL & OPERATING EXPENSES $60,256 $71,640 $139,674 $149,846 $10,172 $20,702 $22,150$22,468 $17,682 $24,864 $120,790 $130,963

39
Type of Visits Initial Office Visits Routine Office Visits Visits w/Add'l Charges Hospital Visits ER Visits Nursing Home Visits Nursery Visits Home Visits 2,750 410 2,340 1,293 237 226 99 47 116 No. of Visits Percent of Total Visits 14.9% 85.1% 47.0% 8.6% 8.2% 3.6% 1.7% 4.2% Alternative 1 2,750 Office Visits

40
Estimates of Primary Care Physician Office Visits by Type of Visit Visits Type of Visits 2,750 Initial Office Visits 410 Routine Office Visits 2,340 Visits w/Add'l Charges 1,293 Hospital Visits 237 ER Visits 226 Nursing Home Visits 99 Nursery Visits 47 Home Visits 116 1999 Rate Schedule High Average Low $60.75 $40.64 $27.00 $47.52 $33.28 $25.47 $83.98 $30.69 $11.48 $55.50 $46.18 $34.76 $135.00 $76.68 $40.50 $65.49 $41.18 $24.75 $189.00 $118.22 $67.50 $101.25 $54.70 $35.86 Revenues High Average Low $24,908 $16,660 $11,070 $111,197 $77,869 $59,610 $108,591 $39,676 $14,837 $13,153 $10,945 $8,239 $30,510 $17,330 $9,153 $6,483 $4,076 $2,450 $8,883 $5,556 $3,173 $11,745 $6,345 $4,159 REVENUES - High Range $315,469 REVENUES - Average Range $178,459 REVENUES - Low Range $112,691 Alternative 1 - 2,750 Visits

41
Alternative 2 4,750 Visits No. of Visits Type of Visits4,750High Average LowHigh Average Low $60.25$43,011 Initial Office Visits 708 $40.64$28,770 $27.00$19,116 $47.52$192,076 Routine Office Visits 4,042 $33.28$134,508 $25.47$102,968 $83.98$187,535 Visits w/Add'l Charges 2,233 $30.69$68,521 $11.48$25,624 $55.50$22,699 Hospital Visits 409 $46.18$18,889 $34.76$14,218 $135.00$52,650 ER Visits 390 $76.68$29,905 $40.50$15,795 $65.49$11,199 Nursing Home Visits 171 $41.18$7,041 $24.75$4,231 $189.00$15,309 Nursery Visits 81 $118.22$9,576 $67.50 $5,468 1999 Updated Rate Schedule Revenues for 4,750 Visits Estimates of Primary Care Physician Office Visits and Revenues by Type of Visit for 4,750 Visits $544,728 $308,149 $194,591 REVENUES - High Range REVENUES - Average Range REVENUES - Low Range

42
High Average Estimated Total Collected Revenues for Scenarios with 2,750 Office Visits and 4,750 Office Visits for Atoka Collection Rates Revenues for 2,750 VisitsRevenues for 4,750 Visits Low $315,469 $299,696 $283,923 $268,149 $252,376 $236,602 $220,829 $544,728 $517,492 $490,256 $463,019 $435,783 $408,546 $381,310 $178,459 $169,536 $160,613 $151,690 $142,767 $133,844 $124,922 $308,149 $292,742 $277,334 $261,927 $246,519 $231,112 $215,705 Total Revenues 95% Collections 90% Collections 85% Collections 80% Collections 75% Collections 70% Collections $112,691 $107,056 $101,422 $95,787 $90,153 $84,518 $78,884 $194,591 $184,861 $175,132 $165,402 $155,673 $145,943 $136,213 $260,262 $449,401 $147,229 $254,223 82.5% Collections$92,970 $160,537

43
HighAve.LowHighAve.Low Revenues Based on 82.5% Collections $260,262$147,229$92,970$449,401$254,223$160,537 Total Annual Capital & Operating Expenses $130,963 $149,846 NET INCOME $129,299$16,266($37,993)$299,555$104,377$10,691 Scenario for 2,750 VisitsScenario for 4,750 Visits Estimated Net Income for a Primary Care Physician Practice For Both Alternative 1 and Alternative 2
$299,555$104,377$10,691 Scenario for 2,750 VisitsScenario for 4,750 Visits Estimated Net Income for a Primary Care Physician Practice For Both Alternative 1 and Alternative 2")
45
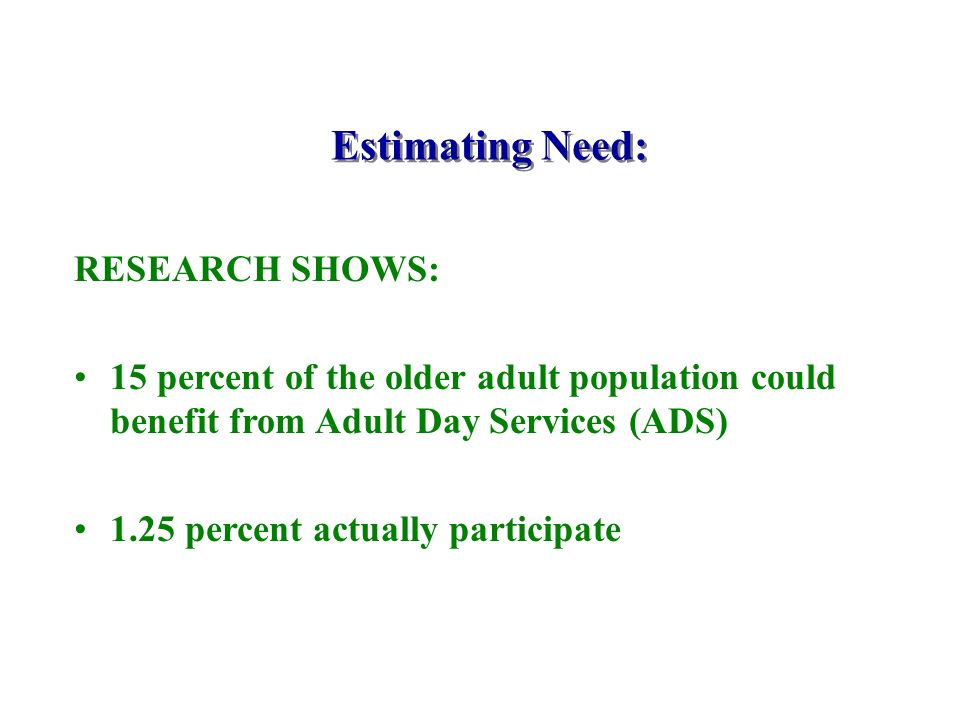
Estimating Need: RESEARCH SHOWS: 15 percent of the older adult population could benefit from Adult Day Services (ADS) 1.25 percent actually participate
 1.25 percent actually participate")
46
Estimating Need for an ADS Facility in Madill, Marshall County, Oklahoma 946 Population age 65 and older in service area x1.25%=12 2,309 participant days 52 weeks per year 12x 3.7 days per week =x 254 operating days per year 2,309 =9 FTE participants

47
Madill Adult Day Services Study to be based on TWO ALTERNATIVES Alternative 1 -- 5 Participants Alternative 2 -- 10 Participants

48
Est. Capital Expenditures for Proposed Adult Day Svcs. Facility Category Alt. 1 Alt. 2 Furnishings Activity Room $4,910 7,480 Reception Area 3,210 3,210 Director's Office 1,490 3,070 Additional Staff Office 1,035 1,715 Kitchen 3,280 3,850 Medical Room 870 870 Exercise Room 2,550 3,900 TOTAL CAPITAL EXPENDITURES $17,345 $24,095

49
Estimated Annual Capital and Operating Expenses for Proposed Adult Day Services Center Category Alt. 1Alt. 2 Annual Capital Expenses $1,735 $2,410 Annual Operating Expenses 2 $57,699 $85,611 Includes Building Rent, Utilities & Phone, Personnel & Benefits, Staff Development, Supplies, Insurance, Accounting/Legal, Meals/Snacks & Miscellaneous TOTAL ANNUAL CAPITAL $59,434 $88,021 & OPERATING EXPENSES Cost/Participant/Year$11,887 $8,802 Cost/Participant/Day $46.80 $34.65

50
Estimated Annual Revenues for Proposed Adult Day Services Center Alt. 1Alt. 2 Participants 5 10 ESTIMATED REVENUES Private Pays (10% of Participants) (@ $25/day Full Pay)$6,350 $6,350 Full Reimbursement (20% of Participants) (@ $25/day Full Pay) 6,350 12,700 Partial Reimbursement (70% of Participants) (@ $18/day Partial Pay) 13,716 32,004 CO-PAYMENTS (70% of Participants) (@ $7/day Co-Pay) 5,334 12,446 Estimated Uncollectibles (40% of Co-Payments) ANNUAL REVENUE $29,616$58,522
 $25/day Full Pay)$6,350 $6,350 Full Reimbursement (20% of Participants) $25/day Full Pay) 6,350 12,700 Partial Reimbursement (70% of Participants) $18/day Partial Pay) 13,716 32,004 CO-PAYMENTS (70% of Participants) $7/day Co-Pay) 5,334 12,446 Estimated Uncollectibles (40% of Co-Payments) ANNUAL REVENUE $29,616$58,522.")
51
Est. Supplemental Funding for Proposed Adult Day Services Center Alt. 1Alt. 2 Participants 5 10 ANNUAL REVENUE $29,616 $58,522 ANNUAL CAPITAL & OPERATING EXPENSES 59,434 88,021 NECESSARY SUPPLEMENTAL FUNDING $29,818 $29,499

52
Effects of Utilization of Adult Day Services Centers on Cost Per Participant Day Source: Zelman, W.M., The University of North Carolina, Chapel Hill, Elston, J.M., and Weissert, W.G., The University of Michigan, Ann Arbor

53
Estimating Feasibility of Kidney Dialysis Center for Lincoln County, Oklahoma Mary K. Lawler, RN, Ph.D. Gerald A. Doeksen, Ph.D. Fred C. Eilrich Oklahoma Cooperative Extension Service Oklahoma State University

54
L incoln County, Oklahoma

55
Objectives 1.Estimate patients 2.Estimate total capital needed 3.Estimate annual capital and annual operating costs 4.Estimate revenues 5.Determine feasibility

56
Estimated Oklahoma Prevalence Coefficients AgeCoefficient 0-19 1.6 20-44 35.6 45-64 134.4 65-74 272.2 75+ 230.0

57
Prevalence Rate Defined Coefficient of 35.6 means for every 100,000 people 20-44 years old, there are 35.6 patients receiving kidney dialysis in Oklahoma

58
Estimating Prevalent Patients

60
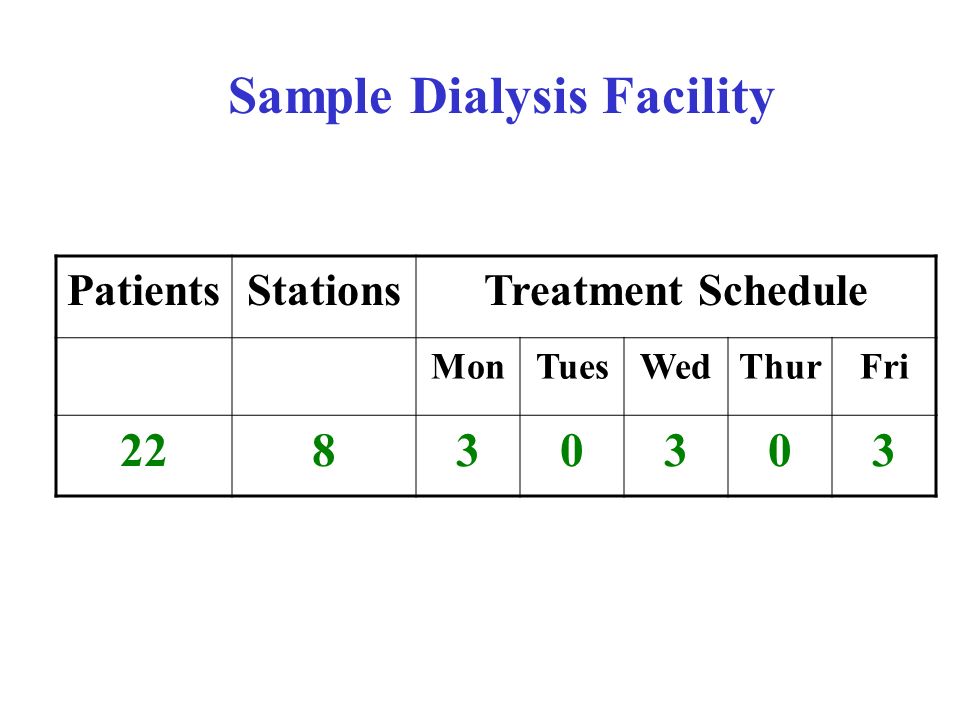
Sample Dialysis Facility PatientsStationsTreatment Schedule MonTuesWedThurFri 22830303

61
Estimated Total Capital Costs Construction $276,612 Water treatment $27,300 Bio-medical equipment $8,549 Clinical equipment $160,922 Other $33,317 TOTAL $506,700

62
Total Capital Costs Total Capital Costs $506,700 Annual Capital Costs $78,572 Based on 7 years @ 7% on Dialysis Machines, and 10 years @ 7% on Construction and All Other Equipment

63
Estimating Personnel Costs Registered nurse (RN)$46,800 Patient Care Tech (PCT) 25,060 Chief Technician 27,040 Housekeeper (1/2 time) 5,356 Financial manager (1/2 time) 20,800 Subtotal Personnel $125,056 Benefits @ 35% $43,770 Staff Development $4,000 Contract Personnel (no benefits) Medical Director / Nephrologist$35,000 Renal social worker 5,000 Hemodialysis dietitian 5,000 Subtotal Contract Personnel $45,000 TOTAL PERSONNEL COSTS $217,826
$46,800 Patient Care Tech (PCT) 25,060 Chief Technician 27,040 Housekeeper (1/2 time) 5,356 Financial manager (1/2 time) 20,800 Subtotal Personnel $125,056 35% $43,770 Staff Development $4,000 Contract Personnel (no benefits) Medical Director / Nephrologist$35,000 Renal social worker 5,000 Hemodialysis dietitian 5,000 Subtotal Contract Personnel $45,000 TOTAL PERSONNEL COSTS $217,826")
64
Estimating Operating Costs Personnel $217,826 Maintenance $26,062 Supplies $7,568 Bio-Medical supplies $355,853 Utilities $72,190 Building lease $28,000 Communications $5,952 Insurance $2,471 TOTAL $715,922

65
Estimating Collections Medicare pays $233 per treatment Third-party payers pay on average $1,023 Medicare does not pay for first 90 days; often this is not collected

66
Estimating Revenue Number of Medicare treatments/year 2,949 Number of Private Pay treatments/year 140 Number of treatments NOT reimbursed (1 st 90 days) 39
 39")
67
Estimating Revenue 2,949 treatments @ $233 $687,117 140 treatments @ $1,023 $143,220 Adjustment for Non-Reimbursed ($16,357) Total Revenue $813,980
 Total Revenue $813,980")
68
Determining Feasibility Total Revenue $813,980 Total Annual Capital costs $78,572 Total Annual Operating costs $715,922 Total Annual Capital & Operating Costs $794,494 Total Revenues less Total Costs $19,486

69
Available Budget Studies from Oklahoma Cooperative Extension Service Primary Care Physician Obstetrics/Gynecology Physician Pediatrician Emergency Medical Services (Basic and Advanced) First Responder Systems Outpatient Rehabilitation Adult Day Services Kidney Dialysis Assisted Living Facilities Federally Qualified Health Centers (FQHCs) – Primary Care Physician Fire Protection, Solid Waste, Transportation Systems
 First Responder Systems Outpatient Rehabilitation Adult Day Services Kidney Dialysis Assisted Living Facilities Federally Qualified Health Centers (FQHCs) – Primary Care Physician Fire Protection, Solid Waste, Transportation Systems")
70
Budget Studies Under Construction Rural Health Clinics Dental Services Specialty Physicians Federally Qualified Health Centers (FQHCs) Dental Pharmacy
 Dental Pharmacy")
71
Rural Health Works National WebSite: http://rd.okstate.edu/health/

Similar presentations