Download presentation
Presentation is loading. Please wait.

1
ENSO and other teleconnections

2
Fig. 10-19, p. 275

3
Fig. 10-19a, p. 275

4
Fig. 10-19b, p. 275

5
Fig. 10-20, p. 275

6
Fig. 10-21, p. 276

7
Fig. 10-21a, p. 276

8
Fig. 10-21b, p. 276

9
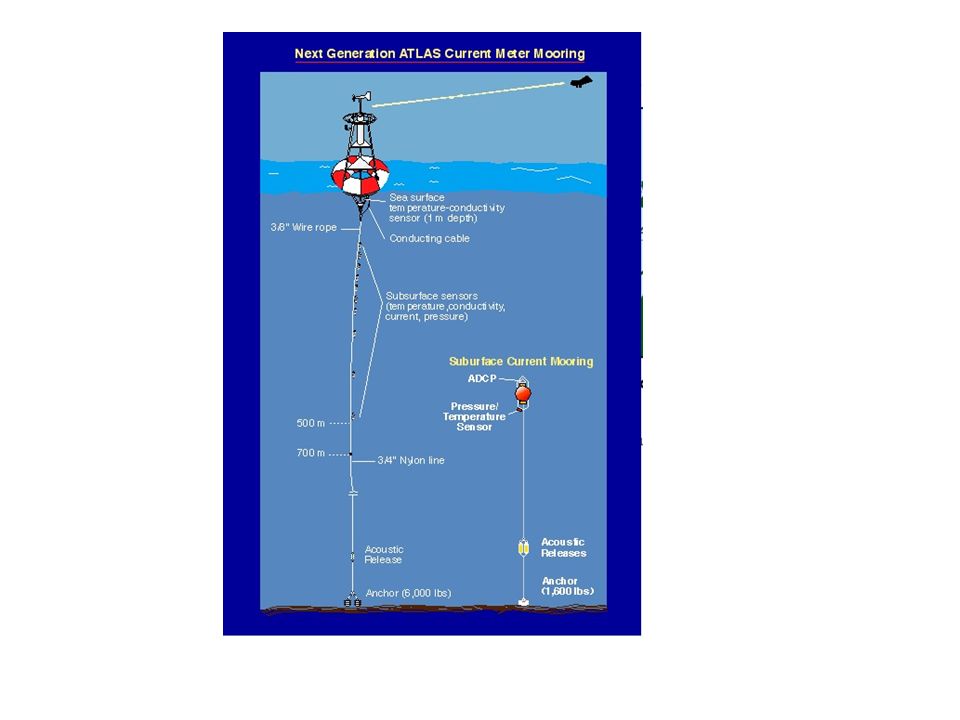
Tropical Atmosphere and Ocean The Research Moored Array for African–Asian–Australian Monsoon Analysis and Prediction* Prediction and Research Moored Array in the Atlantic

12
NOAA ship Kaimimoana

13
Fig. 10-22, p. 277

14
Fig. 10-23, p. 277

15
Fig. 10-23a, p. 277

16
Fig. 10-23b, p. 277

17
Fig. 10-24, p. 278

19
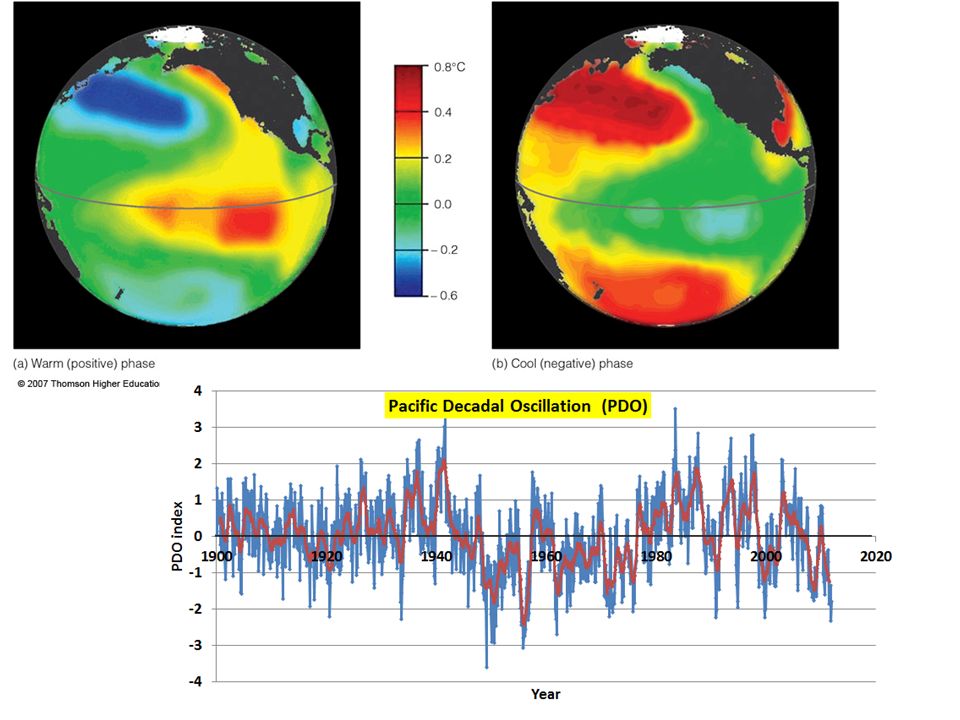
ENSO and PDO Figure 3 The impact of ENSO and PDO on Columbia River summer streamflow at The Dalles, Oregon for 1900-1999. The horizontal lines show average streamflow over each of the PDO epochs (cool: 1900-1925, warm: 1925-1945, cool: 1945-1977, warm: 1977-1995). The red dots are El Niño years, the blue dots are La Niña years, and the green dots are ENSO neutral years. The figure shows "naturalized" streamflow (i.e., with the effects of the dams numerically removed) for April-September of each year.
. The red dots are El Niño years, the blue dots are La Niña years, and the green dots are ENSO neutral years. The figure shows naturalized streamflow (i.e., with the effects of the dams numerically removed) for April-September of each year..")
20
Fig. 10-26, p. 280 North Atlantic Oscillation

21
Fig. 10-27, p. 280 Arctic Oscillation… Other Teleconnections

22
Fig. 10-27a, p. 280

23
Fig. 10-27b, p. 280

Similar presentations


 – current and future state ENSO phase composites for upcoming winter temperature precipitation Climate Prediction.>")


