Download presentation
Presentation is loading. Please wait.

1
Model Simulations of Extreme Orographic Precipitation in the Sierra Nevada Phillip Marzette ATMS 790 March 12, 2007

2
Outline What has happened? What has happened? What may have caused it? What may have caused it? What was the anatomy of the flooding rainfall? What was the anatomy of the flooding rainfall? How to solve the flooding prediction problem in the Sierra Nevada? How to solve the flooding prediction problem in the Sierra Nevada? How to use this information in a practical sense? How to use this information in a practical sense? What does this all mean? What does this all mean?

3
What has happened? Rain Totals 1-3 January 1997 Reno, NV 1.25” Blue Canyon/Emigrant Gap, CA 14.5” San Francisco, CA 2.25” 30 December 2005-1 January 2006 Reno, NV 1.7” Blue Canyon/Emigrant Gap, CA 8.46” South Lake Tahoe, CA 4.5” Sacramento, CA 2.4” San Francisco, CA 3.1”

4
What may have caused it? Several dynamic processes can explain what triggered the flooding rainfall events in the first place. Three factors that lead to convective events: moisture, instability, and lift. These processes have one or a combination of the three factors involved. Courtesy of Schultz and Schumacher, 1999.

5
What was the anatomy of the flooding rainfall? Observations of 1996-97 and 2005-06 Flooding -Global Scale Overview -Synoptic and Mesoscale View -Jet streak structures -300 millibar isotachs -Mesoscale jet streak -700 millibar equivalent potential temperature and radar -Equivalent potential temperatures and relative humidity cross sections

6
What was the anatomy of the flooding rainfall? Global Scale Overview Several waves of water vapor from Asia have crossed the Pacific Ocean and reached the western United States over the span of a couple of weeks. 29 December 1996 1800 UTC27 December 2005 1200 UTC

7
What was the anatomy of the flooding rainfall? Synoptic and Mesoscale View Jet Streak Structure A four-quadrant jet streak model displaying the types of circulations in the entrance and exit region. Courtesy of Uccellini and Johnson 1979; Kaplan et. al., 1998.

8
What was the anatomy of the flooding rainfall? Synoptic and Mesoscale View 1996-97 300 millibar isotachs The right exit region jet streak over is near northern Nevada and the couplet is beginning to take form. 1 January 1997 1800 UTC 2 January 1997 1800 UTC

9
A mesoscale jet streak or jetlet forms between a velocity couplet. An area high ageostrophy that leads to mid level heating forms occurring in the right exit region of a jet streak aloft and convective instability is released. Courtesy of Hamilton et. al., 1998. What was the anatomy of the flooding rainfall? Synoptic and Mesoscale View Mesoscale Jet Streak

10
What was the anatomy of the flooding rainfall? Synoptic and Mesoscale View 1996-97 700 millibar Equivalent Potential Temperature Field and radar The warm moist tongue downstream and cold air upstream help create a heavy precipitation event. 1 January 1997 1800 UTC2 January 1997 1800 UTC

11
What was the anatomy of the flooding rainfall? Synoptic and Mesoscale View 1996-97 Equivalent potential temperature and relative humidity cross sections At both times, the highest moisture content, greatest upward vertical velocity and movement of cold air aloft occur at these peak precipitation times for Reno. 1 January 1997 1800 UTC2 January 1997 1800 UTC

12
What was the anatomy of the flooding rainfall? Synoptic and Mesoscale View 2005-06 300 millibar isotachs Similar to the 1996-97 case except the jet streak moves farther to the south and the velocity is slightly weaker. 31 December 2005 0000 UTC 31 December 2005 1800 UTC

13
What was the anatomy of the flooding rainfall? Synoptic and Mesoscale View 2005-06 700 millibar Equivalent Potential Temperature Field and radar The air to the north is colder than the previous case and this is shown by the high θ e gradient at both times. 31 December 2005 0000 UTC31 December 2005 1800 UTC

14
What was the anatomy of the flooding rainfall? Synoptic and Mesoscale View 2005-06 Equivalent potential temperature and relative humidity cross sections This is similar to the 1996-97 scenario except the slide on the right shows the vigorous cold air barreling down past Reno. 31 December 2005 0300 UTC31 December 2005 1800 UTC

15
How to solve the flooding prediction problem in the Sierra Nevada? Model simulations used to better understand the dynamic and thermodynamic features of these two events. -OMEGA Overview. -Various sensitivity studies including different convective parameterization schemes, microphysics and different resolutions. -Model Output versus Observations.

16
How to solve the flooding prediction problem in the Sierra Nevada? OMEGA Overview Operational Multiscale Environment model with Grid Adaptivity (OMEGA) Triangular grid cells are used over rectangular due to better dynamic grid adaptivity to terrain, clouds and other regions of interest. Highest resolution is 1 kilometer. Courtesy of Bacon et al., 2000.
 Triangular grid cells are used over rectangular due to better dynamic grid adaptivity to terrain, clouds and other regions of interest. Highest resolution is 1 kilometer. Courtesy of Bacon et al.,")
17
How to solve the flooding prediction problem in the Sierra Nevada? OMEGA Overview (cont.) Grids that will be used for analysis. 5 km resolution grid
 Grids that will be used for analysis. 5 km resolution grid.")
18
How to solve the flooding prediction problem in the Sierra Nevada? OMEGA Overview (cont.) Grids that will be used for analysis. 1 km resolution grid
 Grids that will be used for analysis. 1 km resolution grid.")
19
Various sensitivity studies including convective parameterization schemes, microphysics and different resolutions. Model Output versus Observations. Under construction, please check back in a couple of months. How to solve the flooding prediction problem in the Sierra Nevada?

20
Various sensitivity studies including convective parameterization schemes, microphysics and different resolutions. 1 January 2006 0000 UTC Cumulative rainfall 5 km resolution, Kain-Fritsch convective parameterization scheme Comparisons to ponder: Convective schemes: Kuo- Anthes vs. Kain-Fritsch Static vs. dynamic grid 5 km resolution vs. 1 km resolution How to solve the flooding prediction problem in the Sierra Nevada?

21
Model Output versus Observations. 31 December 2005 1800 UTC The model output has similarities to the observed field but has differences in other instances.

22
How to use this information in a practical sense? Cognitive Information Processing Case-based Reasoning Concept Maps Goal for Case-based reasoning - To create an algorithm for a forecasting model to interpret what type of precipitation event can occur. Do we have strong veering wind profile aloft? Significant convective event. YES Is dθ/dz < 0 and dθ lines more steep than m g lines? YES Strong case for conditional symmetric instability. NONO Isolated, upright convection. Other modes of slantwise convection. NONO

23
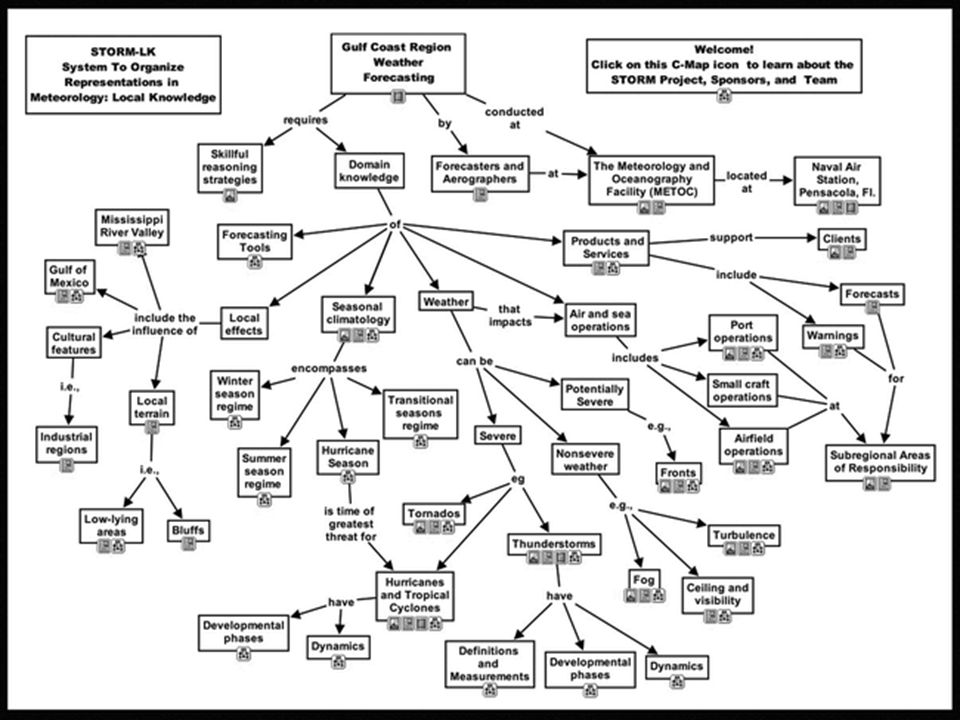
How to use this information in a practical sense? Concept Maps Concept Map of a thunderstorm forecast in the Gulf Coast region serving as an example of a concept map. (example on next page; Hoffman 2006; http://cmap.ihmc.us) This example shows how complex the map can be, but research in this case will simplify the decision making process.

25
What does this all mean? Summary and Conclusions -Cold air aloft and coupled flow under the 300 millibar right exit jet streak is a prime area of heaviest rainfall. -The 1996-97 event was longer in duration, warmer and the distribution of moisture from the Pacific Ocean was more broad compared to the 2005-06 event. -Various sensitivity studies will show detailed differences in dynamic and thermodynamic processes in the atmosphere, as well as different precipitation amounts for these simulations. -The idea of case-based reasoning will establish a relationship between the meteorologist and the forecast model to develop a prediction among various factors and to adjust the thought processes between the two.

26
Is this guy's talk over yet? Thank you for your time. Questions?

Similar presentations


 Scott Weese, Ron McTaggart-Cowan and John R. Gyakum Department of Atmospheric and Oceanic Sciences McGill University.>")


