Download presentation
Presentation is loading. Please wait.

2
The Scenarios Network for Alaska and Arctic Planning is a collaborative network of the University of Alaska, state, federal, and local agencies, NGOs, and industry partners. Its mission is to provide timely access to scenarios of future conditions in Alaska and the Arctic for more effective planning by decision- makers, communities, and industry.

3
There is now clear scientific evidence that our planet is warming How this will affect climate systems around the globe is an enormously complex question Uncertainty and variability are inevitable Climate change presents significant risks to natural and cultural resources Understanding how to address uncertainty is an important part of climate change planning

4
Measuring and modeling change Global Circulation Models (GCMs) Complex coupled models created by national and international labs Interactions of oceans, atmosphere, and radiation balance Calculated which 5 of 15 models were most accurate in the far north A1B, B1 and A2 emissions scenarios (updated to “concentration pathways”) Temperature and precipitation projections by month to 2100 Historical data Weather station data Interpolated and gridded CRU data 1901-2008
 Complex coupled models created by national and international labs Interactions of oceans, atmosphere, and radiation balance Calculated which 5 of 15 models were most accurate in the far north A1B, B1 and A2 emissions scenarios (updated to concentration pathways ) Temperature and precipitation projections by month to 2100 Historical data Weather station data Interpolated and gridded CRU data")
5
GCM output (ECHAM5) 2.5 x 2.5 degrees Baseline values = PRISM mean monthly precipitation and temperature, 2km or 771m, 1971-2000 Adjusted and interpolated GCM outputs to historical baseline Effectively removed model biases while scaling down the GCM projections Frankenberg et al., Science, Sept. 11, 2009

6
Inputs to GCMs Solar radiation is essentially a known quantity Levels of greenhouse gases are uncertain, but accounted for by varying emissions scenarios GCM algorithms Oceanic and atmospheric circulation are hard to predict and model May include thresholds (tipping points) such as ocean currents shifting Don’t fully account for short-term phenomena such as the Pacific Decadal Oscillation (PDO) The PDO causes significant climate shifts on a decadal scale
 such as ocean currents shifting Don’t fully account for short-term phenomena such as the Pacific Decadal Oscillation (PDO) The PDO causes significant climate shifts on a decadal scale")
7
1. Projections of future conditions that are linked to present and past conditions 2. Detailed explanations of the rules, models, and assumptions underlying the projections 3. Objective interpretations of scenarios based on these projections www.snap.uaf.edu

8
Simulated Empirical.

9
Torre Jorgensen (Geophysical Institute Permafrost Lab, UAF) Torre Jorgenson Soil temperature at 1-meter depth: 1980s, 2040s, and 2080s
 Torre Jorgenson Soil temperature at 1-meter depth: 1980s, 2040s, and 2080s")
12
PET is expected to remain relatively stable in the early century, but water loss due to increased temperature is likely to increase in the later part of the century. However, the slight hydrologic changes driven by changes in PET and precipitation may be overshadowed by hydrologic changes driven by other climate- related factors, such as permafrost thaw and biome shift.

14
Change is happening, and will continue for decades regardless of mitigation efforts. Key tipping points may be crossed, e.g fire, permafrost, sea ice, biome shift, glacial loss. High uncertainty results in divergent possible futures for many important variables. www.nenananewslink.com alaskarenewableenergy.org

15
Forecast Planning One Future Scenario Planning Multiple Futures What we know today +10% -10% Uncertainties Global Business Network (GBN) -- A member of the Monitor Group Copyright 2010 Monitor Company Group What we know today
 -- A member of the Monitor Group Copyright 2010 Monitor Company Group What we know today")
16
Everyday choices are based on scenarios Examining scenarios What are possible outcomes? What is the likelihood of each outcome? How much do we want to avoid the bad outcomes? How desirable are the good outcomes? How do we balance time and costs against risks? http://mareeconway.co m/blog Hedge Your Bets Core Robust Satellite Bet the Farm Hedge Your Bets Core Robust Satellite Bet the Farm

17
Collaboration rather than top-down information transfer What are the most pressing questions? Differ from region to region Depend on needs on stakeholder What questions can SNAP help address? What data are and are NOT available? How much time/funding is available? Role of uncertainty Desired products Maps, reports, presentations, websites, etc.

18
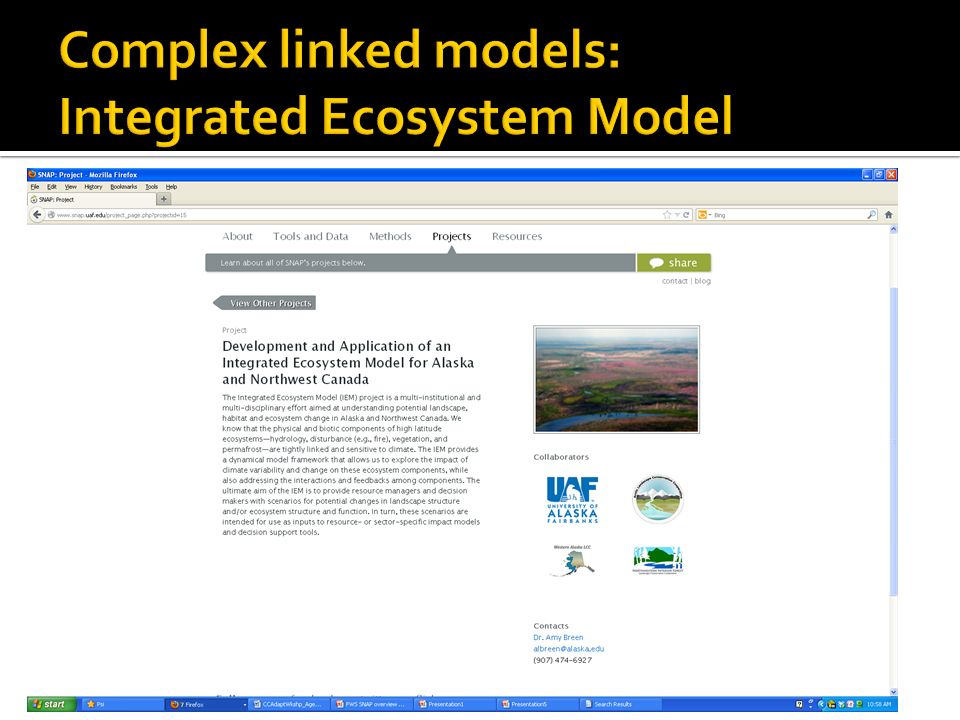
All SNAP data and outputs are available under a Creative Commons license. Currently, 24 ongoing and completed projects are linked on the SNAP website, in addition to reports, videos, presentations, and papers. www.snap.uaf.edu

19
Questions?

Similar presentations


 tell us – What are trends in the current observational.>")


 Earth’s surface would be 60F cooler than today…no life.>")
 Initiatives Reduce greenhouse gas emissions. Reduce.>")


 Project is funded by the Climate Change Action Fund and provides climate change scenarios and related information.>")
