Download presentation
Presentation is loading. Please wait.

1
EPSL, 2004, 229/1-2 pp. 31-43. Maxime LE GOFF and Yves GALLET A new three-axis vibrating sample magnetometer for continuous high-temperature magnetization measurements : Applications to paleo- and archeointensity determinations

2
Paleo- and archeointensity studies are fastidious and often unproductive due to poor data quality It is possible to make them faster by measuring the magnetization at high temperatures

3
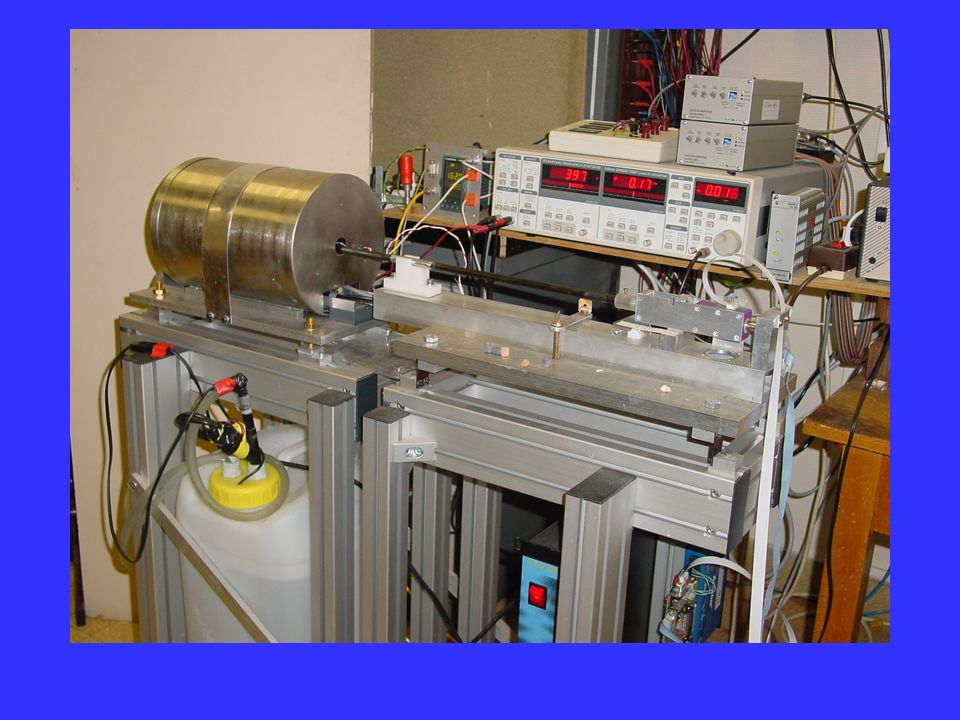
TRIAXE SENSOR

5
must take into account the thermal dependence of the spontaneous magnetization High-temperature version of the Thellier and Thellier method revised by Coe

6
High-Temperature Magnetization Measurements Heating T room to T 1 (H=0)
")
7
High-Temperature Magnetization Measurements Heating T 1 to T 2 (H=0)
")
8
High-Temperature Magnetization Measurements Cooling to T1 and Heating T 1 to T 2 (H=0)
")
9
High-Temperature Magnetization Measurements Applying Hlab = 70µT

10
High-Temperature Magnetization Measurements Cooling T 2 to T 1 (H = 70µT)
")
11
High-Temperature Magnetization Measurements Hlab = 0µT

12
High-Temperature Magnetization Measurements Heating T 1 to T 2 (H=0)
")
13
R(T i ) = H lab * 1(T i ) / 5(T i ) R’(T i ) = H lab * 1’(T i ) / 5’(T i ) Remaining NRM ( 1) and TRM ( 5) fractions between Ti and T2 R ratio Lost NRM ( 1’) and TRM ( 5’) fractions between T1 and Ti R’ ratio TiTi T 1 = 150°C T 2 = 450°C Two possibilities to derive intensity data NRM TRM
 = H lab * 1(T i ) / 5(T i ) R’(T i ) = H lab * 1’(T i ) / 5’(T i ) Remaining NRM ( 1) and TRM ( 5) fractions between Ti and T2 R ratio Lost NRM ( 1’) and TRM ( 5’) fractions between T1 and Ti R’ ratio TiTi T 1 = 150°C T 2 = 450°C Two possibilities to derive intensity data NRM TRM")
14
Test on a pseudo NRM acquired in a field of 50µT in the same conditions as the laboratory TRM (H lab =50 µT)
")
15
Ancient NRM : R increasing, R’ much more constant T i, (°C) R, R’ (µT)
 R, R’ (µT)")
16
Cooling rate effect R’ must be considered

17
Correction for the TRM anisotropy

18
Comparison between archeointensity data obtained from the Thellier and Thellier method revised by Coe and from the Triaxe (Samples from Mesopotamia previously studied by Genevey et al., JGR, 2003)
")
19
Selection criteria A large NRM fraction must be involved Expected behaviour of R and R’ curves

20
Example of rejected sample

21
Archeointensity results from a site of baked bricks from Mesopotamia (Mari, Syria) 6 samples
 6 samples")
22
Comparison between archeointensity results obtained from the Thellier and Thellier and Triaxe methods H (µT) Age (BC)
 Age (BC)")
23
CONCLUSIONS The experimental procedure was successfully tested with archeological baked materials. We need now to work on volcanic samples. Other applications of the Triaxe : - Viscosity at high temperature. - Alteration. - Coupling between different magnetic phases. - etc.

25
∆1’ T i = 300°C T 1 = 150°C ∆5’ R(T i ) = H lab * 1(T i ) / 5(T i ) R’(T i ) = H lab * 1’(T i ) / 5’(T i ) T 2 = 450°CT i = 200°C ∆5∆5∆1∆1 Remaining NRM (1) and TRM (5) between Ti and T2 R ratio Lost NRM (1) and TRM (5) between T1 and Ti R’ ratio
 = H lab * 1(T i ) / 5(T i ) R’(T i ) = H lab * 1’(T i ) / 5’(T i ) T 2 = 450°CT i = 200°C ∆5∆5∆1∆1 Remaining NRM (1) and TRM (5) between Ti and T2 R ratio Lost NRM (1) and TRM (5) between T1 and Ti R’ ratio")
26
High-Temperature Magnetization Measurements Cooling T 2 to T 1 (H=0)
")
Similar presentations

, N. Warmé (2),>")


 Department Materials (ALSTOM) Lab of Crystallography (ETH.>")
>")
 a pioneer in studies of the “fossil” Earth’s magnetic field. Maxime LeGoff, Lucien Daly, I.P.G.P. St-Maur, France David Dunlop,>")
 Harry Kojima Rutgers University.>")


