Download presentation
Presentation is loading. Please wait.

1
Ahmad Ijaz Center for Business and Economic Research Serving Alabama Since 1930 Alabama State Black Chamber of Commerce Entrepreneurs and Innovators Conference June 25, 2015

2
2 U.S. economic growth declined by 0.2 percent in the first quarter, following a 2.2 percent growth in the fourth quarter, GDP in the second quarter is expected increase by 2.1 percent and around 3.0 percent in the second half. Stronger consumer spending, improving housing market and an end to the sharp drop in energy sector capital spending will be major drivers. Slowest economic recovery since WWII. Economic growth in the next few quarters will depend on pace of improvement in labor markets and a relatively smooth transfer to a tighter monetary policy. The Fed is expected to start raising interest rate by fourth quarter 2015. Median family income has been flat for two years, in 2013 it was 8% below 2007. Weakness in wage gains and falling labor force participation rate will continue to keep consumers cautious about their spending (lowest participation rate since 1978).
..")
3
3 Despite improving payrolls, there is still considerable slack in the labor market, a factor hindering wage growth. Much of the job growth in recent years (30-40 percent) has been in low wage sectors of the economy or in part-time/temporary employment. Major drag on economic growth will be from net exports because of a strong dollar and weak growth in much of the rest of the world and lack of federal government spending. Facing a lack of wage and income growth, consumers are taking on more debt; household nonmortgage debt increased from $3.1 trillion in 2013 to $3.4 trillion in 2014. Sluggish job growth and high level of college related student debt is also resulting in low household formation (only about 0.5 million in late 2013 and early 2014).
 has been in low wage sectors of the economy or in part-time/temporary employment. Major drag on economic growth will be from net exports because of a strong dollar and weak growth in much of the rest of the world and lack of federal government spending. Facing a lack of wage and income growth, consumers are taking on more debt; household nonmortgage debt increased from $3.1 trillion in 2013 to $3.4 trillion in Sluggish job growth and high level of college related student debt is also resulting in low household formation (only about 0.5 million in late 2013 and early 2014)..")
4
4 2008 2009 2010 2011 2012 2013 2014 2015 Source: Bureau of Economic Analysis, Bureau of Labor Statistics, and IHS Global Insight.

5
5 Source: Bureau of Labor Statistics and IHS Global Insight.

6
6 Source: University of Michigan and IHS Global Insight.

7
7 Source: Bureau of Economic Analysis and IHS Global Insight. State and Local Federal

8
(Percent change unless otherwise noted) 20122013201420152016 Real GDP2.32.22.42.13.1 Consumption1.82.42.52.82.9 Residential Investment13.511.91.68.312.9 Commercial, Healthcare Structures8.53.47.79.913.8 Nonresidential Fixed Investment7.23.06.33.46.6 Federal Government-1.8-5.7-1.90.50.2 State & Local Government-1.20.51.0 1.1 Exports3.33.03.21.64.9 Imports2.31.14.05.56.4 Payroll Employment1.7 1.92.11.5 Unemployment Rate8.17.46.25.45.1 CPI Inflation2.11.51.60.01.8 Light Vehicle Sales (Millions)14.4315.5216.4016.9917.31 4
 Real GDP Consumption Residential Investment Commercial, Healthcare Structures Nonresidential Fixed Investment Federal Government State & Local Government Exports Imports Payroll Employment Unemployment Rate CPI Inflation Light Vehicle Sales (Millions)")
9
9 Source: Bureau of Economic Analysis, Bureau of Labor Statistics.

10
10 Not Seasonally Adjusted Seasonally Adjusted Civilian Labor Force2,176,9342,170,900 Percent Change from Year Ago Level1.1%1.5% Absolute Change from Year Ago Level24,70231,152 Employed2,042,8372,038,731 Percent Change from Year Ago Level1.6%2.4% Absolute Change from Year Ago Level33,02247,488 Unemployed134,097132,169 Percent Change from Year Ago Level-5.8%-11.0% Absolute Change from Year Ago Level-8,320-16,336 Alabama Unemployment Rate6.2%6.1% Alabama Unemployment Rate (May 2014)6.6%6.9% U.S. Unemployment Rate5.3%5.5% U.S. Unemployment Rate (May 2014)6.1%6.3% Source: Alabama Department of Labor, Labor Market Information Division.
6.1%6.3% Source: Alabama Department of Labor, Labor Market Information Division..")
11
11 Source: Alabama Department of Labor, Labor Market Information Division. January 2011 May 2015Change Total Nonagricultural 1,839,4001,958,100118,700 Natural Resources and Mining12,10010,900-1,200 Construction77,20081,6004,400 Manufacturing233,200252,70019,500 Durable Goods Manufacturing143,500166,70023,200 Nondurable Goods Manufacturing89,70086,000-3,700 Trade, Transportation and Utilities358,800375,80017,000 Wholesale Trade70,90070,800-100 Retail Trade221,500230,4008,900 Transportation, Warehousing and Utilities66,40074,6008,200 Information23,50022,900-600 Financial Activities91,10096,3005,200 Professional and Business Services208,200229,70021,500 Educational and Health Services213,200229,60016,400 Leisure and Hospitality159,500194,20034,700 Other Services78,40081,1002,700 Government384,200383,300-900 Federal Government57,20053,400-3,800 State Government110,400110,900500 Local Government216,600219,0002,400

12
12 Source: Alabama Department of Labor, Labor Market Information Division. May 2013 to May 2014 May 2014 to May 2015 Total Nonagricultural 15,10030,500 Natural Resources and Mining-500-800 Construction01,700 Manufacturing3,600300 Durable Goods Manufacturing5,0002,300 Nondurable Goods Manufacturing-1,400-2,000 Trade, Transportation and Utilities4,0004,600 Wholesale Trade0-2,300 Retail Trade2,8004,300 Transportation, Warehousing and Utilities1,2002,600 Information-700800 Financial Activities1,2001,100 Professional and Business Services3,1007,000 Educational and Health Services5006,200 Leisure and Hospitality4,5006,300 Other Services600500 Government-1,2002,800 Federal Government-1,1000 State Government-3002,300 Local Government200500

13
13 4 th in U.S. in vehicle exports 4 OEMs in the state (Original Equipment Manufacturers) 5 th in U.S. in vehicles manufactured Alabama’s three assembly plants produced 997,270 vehicles in 2014 and the number is expected to climb in the coming years $6.5 billion in vehicles shipped to 99 countries in 2013 Since 2011, Alabama has attracted more than 200 auto- related projects involving $4 billion in investment and 17,000 new jobs Source: Economic Development Partnership of Alabama (EDPA) and Alabama Department of Commerce.
 5 th in U.S. in vehicles manufactured Alabama’s three assembly plants produced 997,270 vehicles in 2014 and the number is expected to climb in the coming years $6.5 billion in vehicles shipped to 99 countries in 2013 Since 2011, Alabama has attracted more than 200 auto- related projects involving $4 billion in investment and 17,000 new jobs Source: Economic Development Partnership of Alabama (EDPA) and Alabama Department of Commerce..")
14
14

15
15

16
16

17
17 Employment (Thousands), Unemployment Rate (Percent), 1990-2015 Source: Alabama Department of Labor. Nonfarm EmploymentUnemployment Rate

18
18 Number of months Source: Estimates based on Alabama Department of Labor data.

19
19 Source: Bureau of Labor Statistics.

20
20 Source: Bureau of Labor Statistics.

21
21 Percent Change From Year Ago Change in Revenue from Year Ago Level TaxTotal Collection Total$6,706,712,9114.5%$290,441,062 Income (Individual)$2,729,780,1935.4% $139,529,597 Sales$1,414,411,3053.7%$51,048,960 Source: Alabama Department of Revenue.
$2,729,780,1935.4% $139,529,597 Sales$1,414,411,3053.7%$51,048,960 Source: Alabama Department of Revenue.")
22
22 This Alabama GDP and employment forecast summary is the CBER June 2015 forecast Preliminary 2016 forecast also included below Probability: Forecast (60 Percent) and Range (90 percent) (Percent change) 2013201420152016 Real GDP2.0 2.32.5 range1.5 to 3.02.0 to 3.0 Employment1.00.71.41.5 range0.5 to 2.00.8 to 1.5 Total Tax Receipts, FY4.01.34.03.5 range2.5 to 4.81.5 to 4.0
 and Range (90 percent) (Percent change) Real GDP range1.5 to to 3.0 Employment range0.5 to to 1.5 Total Tax Receipts, FY range2.5 to to 4.0")
23
23

24
24

25
25

26
26

27
27

28
28 68.7 31.5 57.6

29
29 Source: Alabama Department of Labor and U.S. Bureau for Economic Analysis. GDP Employment

30
30 Source: Alabama Department of Labor.

31
31

32
32

33
Total Merchandise Metro Area Exports Alabama$19.3 billion Anniston-Oxford$192.7 million Auburn-Opelika$395.4 million Birmingham-Hoover$1.9 billion Daphne-Fairhope-Foley$515.3 million Decatur$673.1 million Dothan$374.7 million Florence-Muscle Shoals$229.7 million Gadsden$54.6 million Huntsville$1.5 billion Mobile$1.5 billion Montgomery$1.7 billion TuscaloosaNA Source: International Trade Administration, U.S. Department of Commerce. 33

34
34 20132012 Alabama100.0100.0 Anniston-Oxford1.11.2 Auburn-Opelika2.42.6 Birmingham-Hoover11.111.4 Daphne-Fairhope-Foley3.1NA Decatur4.03.8 Dothan2.21.6 Florence-Muscle Shoals1.40.8 Gadsden0.30.2 Huntsville9.08.8 Mobile9.211.2 Montgomery9.910.4 TuscaloosaNANA Source: International Trade Administration, U.S. Department of Commerce.

35
35 7/1/2010 to 7/1/2013 NumberPercent 7/1/2013ChangeChange Alabama4,833,722 48,1521.0 Anniston-Oxford116,736 -1,712-1.4 Auburn-Opelika 150,933 10,0837.2 Birmingham-Hoover1,140,300 11,2041.0 Daphne-Fairhope-Foley195,54012,3176.7 Decatur153,374 -488-0.3 Dothan147,691 1,8151.2 Florence-Muscle Shoals147,317 880.1 Gadsden103,931 -567-0.5 Huntsville 435,737 16,3063.9 Mobile414,079 7890.2 Montgomery373,510 -1,698-0.5 Tuscaloosa 235,628 5,1542.2 Source: U.S. Census Bureau.

36
36 * Gadsden, Huntsville and Mobile employment peaked in 2008; all others saw peaks in 2007. Note: Nonfarm employment (jobs) is by place of work. Source: Alabama Department of Labor and U.S. Bureau of Labor Statistics. 2007 or 2008 Job Loss (Gain) Nonfarm EmploymentPeak YearNumberPercent Alabama 2,005,70047,6002.4% Anniston-Oxford 53,4007,00013.1% Auburn-Opelika 54,800-5,900-10.8% Birmingham-Hoover 533,40011,4002.1% Decatur 58,6004,6007.9% Dothan 63,1006,1009.7% Florence-Muscle Shoals 57,3001,7003.0% Gadsden* 38,0003000.8% Huntsville* 214,300-6,000-2.8% Mobile* 184,6005,9003.2% Montgomery 178,0006,9003.9% Tuscaloosa 98,500-5,600-5.7% Net Jobs in Metropolitan Areas 26,400 Net Jobs in Nonmetro Counties 21,200
 is by place of work. Source: Alabama Department of Labor and U.S. Bureau of Labor Statistics or 2008 Job Loss (Gain) Nonfarm EmploymentPeak YearNumberPercent Alabama 2,005,70047,6002.4% Anniston-Oxford 53,4007, % Auburn-Opelika 54,800-5, % Birmingham-Hoover 533,40011,4002.1% Decatur 58,6004,6007.9% Dothan 63,1006,1009.7% Florence-Muscle Shoals 57,3001,7003.0% Gadsden* 38, % Huntsville* 214,300-6, % Mobile* 184,6005,9003.2% Montgomery 178,0006,9003.9% Tuscaloosa 98,500-5, % Net Jobs in Metropolitan Areas 26,400 Net Jobs in Nonmetro Counties 21,200.")
37
49

38
Nonfarm EmploymentReal GDPForecast, Percent Anniston-Oxford0.31.3 Auburn-Opelika2.53.7 Birmingham-Hoover1.01.5 Daphne-Fairhope-Foley1.23.0 Decatur0.41.0 Dothan1.41.8 Florence-Muscle Shoals1.03.5 Gadsden1.11.4 Huntsville2.03.8 Mobile1.23.2 Montgomery0.91.4 Tuscaloosa2.23.8 Source: U.S. Department of Commerce, Alabama Department of Labor, and Center for Business and Economic Research, The University of Alabama, December 2014. 38

39
Labor force participation (2012): Alabama 57.3% United States 63.7% Educational Attainment (Age 25 and over population) 2008-2012 (2012)AlabamaUnited States High school graduates82.6% (84.0%)85.7% (86.4%) Bachelor’s or higher degree22.3% (23.3%)28.5% (29.1%) Population GrowthAlabamaUnited States 1990-200010.1%13.2% 2000-20107.5%9.7% 2010-20131.1%2.4% 48
: Alabama 57.3% United States 63.7% Educational Attainment (Age 25 and over population) (2012)AlabamaUnited States High school graduates82.6% (84.0%)85.7% (86.4%) Bachelor’s or higher degree22.3% (23.3%)28.5% (29.1%) Population GrowthAlabamaUnited States %13.2% %9.7% %2.4% 48")
40
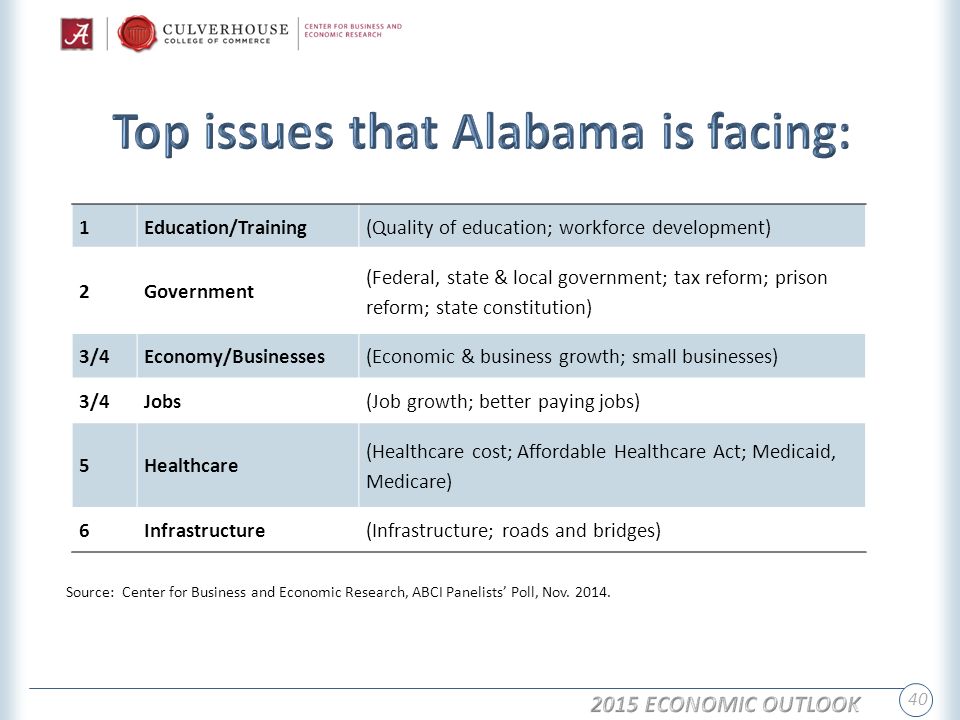
1Education/Training(Quality of education; workforce development) 2Government (Federal, state & local government; tax reform; prison reform; state constitution) 3/4Economy/Businesses(Economic & business growth; small businesses) 3/4Jobs(Job growth; better paying jobs) 5Healthcare (Healthcare cost; Affordable Healthcare Act; Medicaid, Medicare) 6Infrastructure(Infrastructure; roads and bridges) 40 Source: Center for Business and Economic Research, ABCI Panelists’ Poll, Nov. 2014.
41
41 1 Company Finances & Development (Profitability; business costs; availability of credit; business growth; competition; concern about customers) 2Government (Federal, state & local government; taxation; regulations; uncertainty) 3Workforce(Lack of skilled workers; retaining qualified employees) 4Economy(Economic recovery & growth; consumer spending) 5Healthcare(Healthcare cost; Affordable Healthcare Act) Note: No issues companies are facing was currently mentioned by 1.0% of respondents. Source: Center for Business and Economic Research, ABCI Panelists’ Poll, Nov. 2014.

42
193044 194045 195047 196046 197047 198046 199040 200043 2009 41 2010 41 2011 41 2012 41 2013 42 Source: Estimates based on Bureau of Economic Analysis data. 44

43
43 1929: U.S. $697 Alabama $318 2013: U.S. $44,543 Alabama $36,501

44
44 1929: U.S. $697 Alabama $318 2013: U.S. $44,543 Alabama $36,501

45
Understanding the economy and economic development Economy = People + Institutions + Property = Private & Public Sectors Economic Development = Higher or better quality of life Human Capital Development = Improved education and healthcare Institutional Development = Better government, companies, culture Physical Capital Development = Better infrastructure and environment There is no economic development without education (a public good) *** Informal education is also important Pre-Kindergarten to High School (Pure Public Good) Universities (Largely Public Good) Vocational and Community Colleges (Mostly Public Good) Development Policies must be Optimal = Efficient, Fair, Flexible, Sustainable 47
 *** Informal education is also important Pre-Kindergarten to High School (Pure Public Good) Universities (Largely Public Good) Vocational and Community Colleges (Mostly Public Good) Development Policies must be Optimal = Efficient, Fair, Flexible, Sustainable 47")
46
46 Center for Business and Economic Research Culverhouse College of Commerce The University of Alabama Box 870221 Tuscaloosa, Alabama 35487-0221 205.348.6191 http://cber.cba.ua.edu Serving Alabama Since 1930

47
47

48
48 National and Alabama Economic Outlook

49
49 Sales Profits

50
50 Hiring Plans Capital Expenditures

51
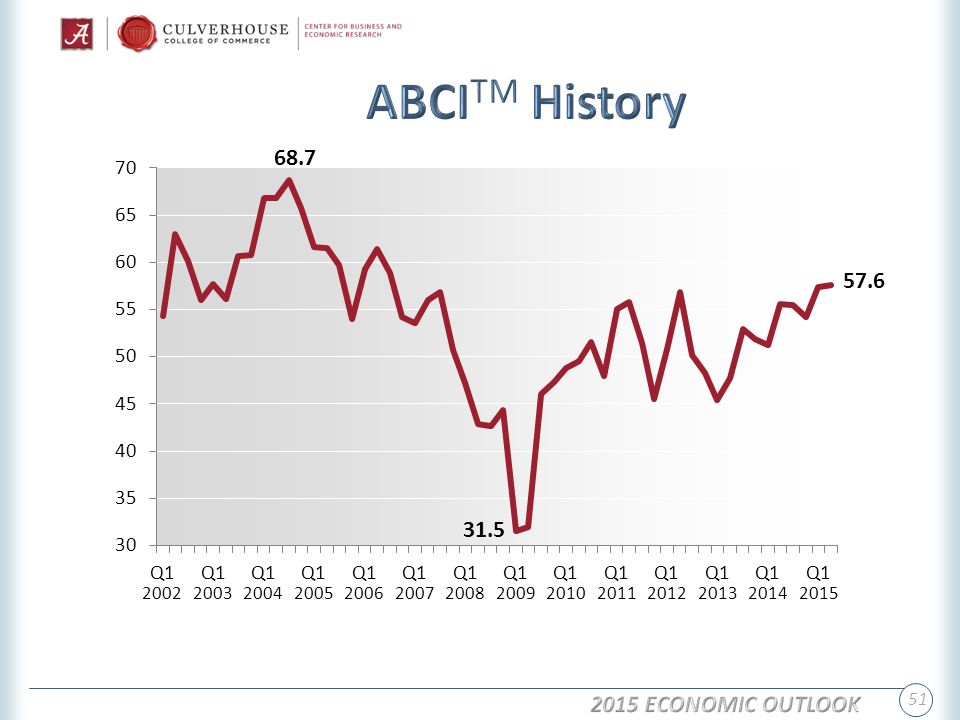
51 68.7 31.5 57.6
52
52

53
53

54
54

Similar presentations


