Download presentation
Presentation is loading. Please wait.

1
Biostatistics ZMP 602 E_Mail: Atef@Sci.cu.edu.eg
Mathematical tools used to Collect Organize Analyse Present To make Decisions Interpret

2
TYPES OF STATISTICS Descriptive Inferential To Organize,
Display, Describe data using tables, graphs Use information from descriptive statistics to make decisions or predictions about a population

3
A selected portion from the studied population
Statistical Terms Population All sets of individuals, items, or objects whose the characteristics being studied. Sample A selected portion from the studied population Population Sample

4
Types Of Variables Variables
The characteristics (quantities or qualities) that the individuals of a population possess. Types Of Variables According to causal relationship CAUSE (Factor) (Independent Variable) EFFECT (Response) ( Dependent Variable)
 that the individuals of a population possess. Types Of Variables. According to causal relationship. CAUSE (Factor) (Independent Variable) EFFECT (Response) ( Dependent Variable)")
5
Arithmetic operations
TYPES OF VARIABLES A. Quantitative Variables Can be measured numerically (numeric variable) Ex: Age (in years) Arithmetic operations (+, -, x, /) Can be applied Are measured in a unit that can be subdivided infinitely (Continuous Variables)
 Ex: Age (in years) Arithmetic operations. (+, -, x, /) Can be applied. Are measured in a unit that can be subdivided infinitely (Continuous Variables)")
6
Religion: Muslim, Christian
TYPES OF VARIABLES A. Qualitative Variables Measured in a unit that can not be subdivided infinitely (Discrete Variables) A.1. Nominal Level Variables Scores are labels that Cannot be treated as numbers Scores are labels that Cannot be ranked Gender: male , Female Race: White , Black Religion: Muslim, Christian
 A.1. Nominal Level Variables. Scores are labels that Cannot be treated as numbers. Scores are labels that Cannot be ranked. Gender: male , Female. Race: White , Black. Religion: Muslim, Christian.")
7
TYPES OF VARIABLES A. Qualitative Variables
A.2. Ordinal Level Variables Scores are non-numerical forms and can be ranked Grades: Good, Very good, Excellent Medals: Gold, Silver, Bronze

8
Measures of Central Tendency
Descriptive Statistics Measures of Central Tendency

9
Variance 𝛔 𝟐 𝛔 𝟐 = 𝐱 𝟏 − 𝐗 𝟐 + 𝐱 𝟐 − 𝐗 𝟐 +…+ 𝐱 𝐧 − 𝐗 𝟐 𝐍
It is the arithmetic mean of the squared deviations from the mean of a statistical distribution. Squared Deviation 𝛔 𝟐 = 𝐱 𝟏 − 𝐗 𝟐 + 𝐱 𝟐 − 𝐗 𝟐 +…+ 𝐱 𝐧 − 𝐗 𝟐 𝐍 Sample Size

10
Standard deviation 𝛔 It is the square rootof the variance ( 𝛔 𝟐 ).
.")
11
Standard Error (S.E.) of Mean
It is the standard deviation of the sample mean divided by square root of sample size. 𝐒.𝐄.= 𝛔 𝐧 𝝈=𝟏.𝟔𝟖, 𝒏=𝟓 𝐒.𝐄.= 𝟏.𝟔𝟖 𝟓 =𝟎.𝟑𝟑𝟔

12
Normal (Gaussian) Distribution Curve
Bell shaped Smooth Symmetrical Frequency 𝝁 x x x x Population 99.7% 95.5% 63.8% 63.8% 95.5% 99.7% +𝟑𝝈 +𝟐𝝈 +𝟏𝝈 −𝟏𝝈 −𝟐𝝈 −𝟑𝝈

13
SAMPLING Sample 2 Population Sample 1 𝐗 𝒊𝒔 𝒕𝒉𝒆 𝑺𝑨𝑴𝑷𝑳𝑬 𝒎𝒆𝒂𝒏 𝝁
𝐗 𝒊𝒔 𝒕𝒉𝒆 𝑺𝑨𝑴𝑷𝑳𝑬 𝒎𝒆𝒂𝒏 Sample 2 Population Sample 1 S2 S1 𝝁 𝝁 𝒊𝒔 𝒕𝒉𝒆 𝑷𝑶𝑷𝑼𝑳𝑨𝑻𝑰𝑶𝑵 𝒎𝒆𝒂𝒏

14
Presentation of data Bar Chart
It is used to present all types of variables. Parameter Value Freq. A 6 B 4 AB 1 O 9 Frequency Values of Variable

15
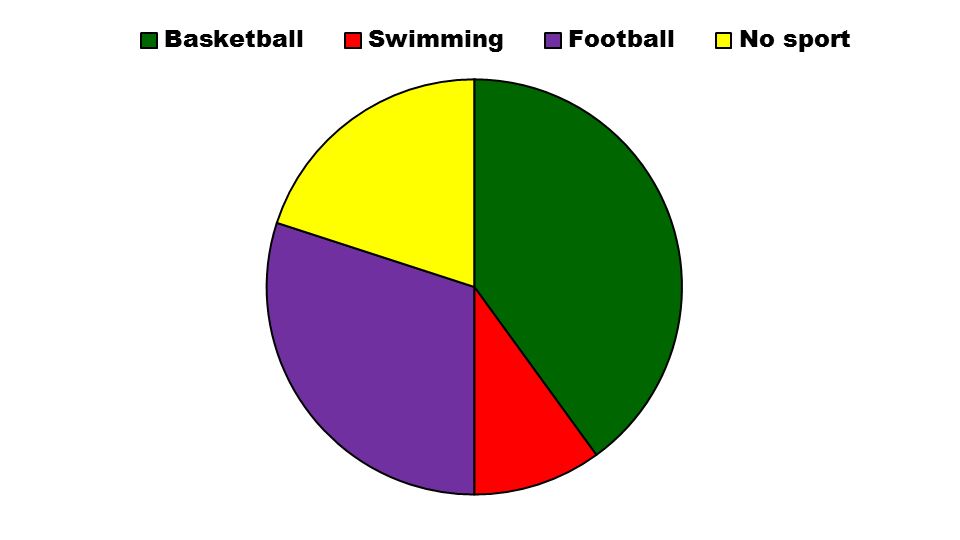
Pie Charts A pie chart can be used to represent all types of variables, but is more commonly used for categorical variables. The data is represented in a circle and the angle of each circular sector is proportional to the corresponding absolute frequency. EXAMPLE In a class of 30 students, 12 play basketball, 3 swim, 4 play football and the rest do not practice any sport. 𝜶= 𝟑𝟔𝟎 ∘ 𝑵 ∗ 𝒇 𝒊 Students Angle Basketball 12 144° Swimming 3 36° Football 9 108° No sport 6 72° Total 30 360°

17
HISTOGRAMS A histogram is a graphic representation of a variable in the shape of bars (rectangles). They are used for all types of variables with a large quantity of data that is grouped into classes. The base width of the bars (rectangles) are proportional to the class widths and the height is the absolute frequency of each interval. The surface area of every bar is proportional to the frequency of the represented values. ci fi Fi [50, 60) 55 8 [60, 70) 65 10 18 [70, 80) 75 16 34 [80, 90) 85 14 48 [90, 100) 95 58 [100, 110) 110 5 63 [110, 120) 115 2
 are proportional to the class widths and the height is the absolute frequency of each interval. The surface area of every bar is proportional to the frequency of the represented values. ci. fi. Fi. [50, 60) [60, 70) [70, 80) [80, 90) [90, 100) [100, 110) [110, 120)")
18
POLYGON Frequency HISTOGRAM Class intervals 16 14 12 10 8 6 4 2 50 60
2 Frequency HISTOGRAM 50 60 70 80 90 100 110 120 Class intervals

19
X-Y Scatter Chart

20
Inferential Statistics HYPOTHESIS TESTS ON THE MEAN
BASIC STATISTICAL INFERENCE HYPOTHESIS TESTS ON THE MEAN TEST THE NULL HYPOTHESIS 𝑯 𝟎 𝑯 𝟎 : 𝝁= 𝝁 𝟎 𝑯 𝑨 : 𝝁> 𝝁 𝟎 , 𝑯 𝑨 : 𝝁< 𝝁 𝟎 , 𝑯 𝑨 : 𝝁≠ 𝝁 𝟎 , 𝝁: 𝒑𝒐𝒑𝒖𝒍𝒂𝒕𝒊𝒐𝒏 𝒎𝒆𝒂𝒏, 𝝁 𝟎 : 𝒂 𝒈𝒊𝒗𝒆𝒏 𝒇𝒊𝒙𝒆𝒅 𝒗𝒂𝒍𝒖𝒆

Similar presentations


: Analysing data.>")


