Download presentation
Presentation is loading. Please wait.

2
Introduction to Behavioral Statistics

3
Measurement The assignment of numerals to objects or events according to a set of rules. The rules used define or determine the Level of Measurement.

4
Measurement Measurement: Levels of Measurement - l Nominal Level of Measurement l Ordinal Level of Measurement l Interval Level of Measurement l Ratio Level of Measurement

5
Measurement Measurement: Levels of Measurement - l Nominal Level of Measurement l Ordinal Level of Measurement l Interval Level of Measurement l Ratio Level of Measurement

6
Measurement Measurement: Levels of Measurement - l Nominal Level of Measurement. The use of numbers or numerals as labels for a category.

7
Measurement Measurement: Levels of Measurement - l Ordinal Level of Measurement The use of numbers or numerals to indicate rank order.

8
Measurement Measurement: Levels of Measurement - l Interval level of Measurement Interval scales have all of the properties of ordinal scales, and in addition, equal intervals on the scale of measurement represent empirically equal intervals. Zero point is arbitary, not absolute!

9
Measurement Measurement: Levels of Measurement - l Interval level of Measurement Interval scales have all of the properties of ordinal scales, and in addition, equal intervals on the scale of measurement represent empirically equal intervals. Zero point is arbitary, not absolute!

10
Measurement Measurement: Levels of Measurement - l Ratio level of Measurement Ratio level scales have all of the properties of interval scales and in addition have an absolute zero point. Ratios are equal throughout the scale.

11
Measurement Measurement: Levels of Measurement - l Ratio level of Measurement Ratio level scales have all of the properties of interval scales and in addition have an absolute zero point. Ratios are equal throughout the scale.

12
Measurement Measurement: Levels of Measurement - l Nominal Level of Measurement l Ordinal Level of Measurement l Interval Level of Measurement l Ratio Level of Measurement

13
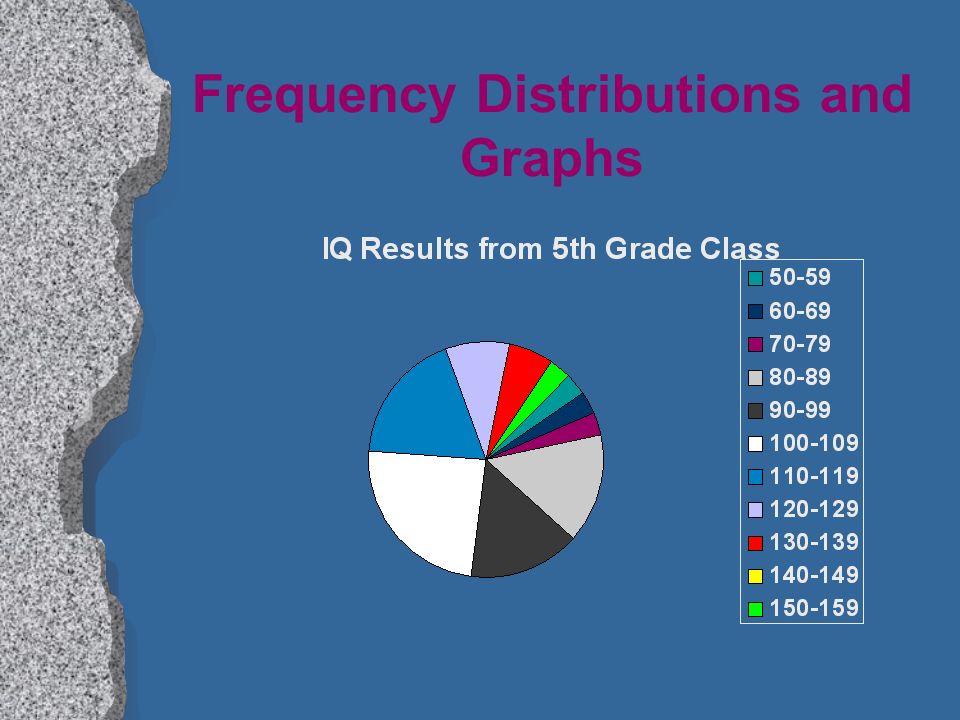
Frequency Distributions and Graphs Exact Limits are from: 49.5 - 59.5

14
Frequency Distributions & Graphs l Conventions for Frequency Distributions –No more than 20 or fewer than 10 class intervals. –Preferred class interval sizes (1,2,3,5,10,15,20). –Start grouping so that the lowest class interval is a multiple of the class interval size.
. –Start grouping so that the lowest class interval is a multiple of the class interval size..")
15
Frequency Distributions and Graphs Histogram

16
Frequency Distributions and Graphs l Rules for Constructing a Histogram –Plot the graph over the actual class limits (Exact Upper & Lower) –Plot the Dependent Variable on the ordinate
 –Plot the Dependent Variable on the ordinate")
17
Frequency Distributions and Graphs Line Graph/Frequency Polygon

18
Frequency Distributions and Graphs l Rules for Constructing a Frequency Polygon –The point is placed over the mid-point of the class interval. Mid-point=UL-LL/2 –We assume that the interval above & below the highest and lowest class intervals are zero. –To smooth a frequency polygon use: FS=X1+X2+X2+X3/4 –Start the Lowest class interval on the left side of the graph

19
Frequency Distributions and Graphs

23
What can I learn from a graph?

24
Frequency Distributions and Graphs l Clustering of scores around some central value. l Knowledge of the dispersion of scores around a central point. l Symetry or lack of symetry (skewness) l Flatness or steepness of a distribution (Kurtosis) l Whether or not the distribution is bimodal.
 l Flatness or steepness of a distribution (Kurtosis) l Whether or not the distribution is bimodal..")
25
Frequency Distributions and Graphs l Clustering of scores around some central value. l Knowledge of the dispersion of scores around a central point. l Symetry or lack of symetry (skewness) l Flatness or steepness of a distribution (Kurtosis) l Whether or not the distribution is bimodal.
 l Flatness or steepness of a distribution (Kurtosis) l Whether or not the distribution is bimodal..")
26
Frequency Distributions and Graphs This ends this unit! Please read the section from your text discussing the use of the computer. In our next unit, we will start putting the peaces together by looking at descriptive statistics…….. Press Here to Press Here to Return to class Return to class Page Press Here to Press Here to Return to class Return to class Page

Similar presentations


 – Descriptive Statistics.>")
 Ordinal scale- Uses numbers for.>")


