Download presentation
Presentation is loading. Please wait.

1
Planetary-Scale Views on a Large Instant-Messaging Network 报告人:徐波

2
Contribution We report on multiple aspects of the dataset and synthesized graph We also find that people tend to communicate more with each other when they have similar age, language, and location, and that cross-gender conversations are both more frequent and of longer duration than conversations with the same gender. We investigate on a planetary-scale the oft-cited report that people are separated by “six degrees of separation” and find that the average path length among Messenger users is 6.6. We find that the graph is well-connected and robust to node removal

3
Dataset MSN 30 days of June 2006 The dataset contains summary properties of 30 billion conversations among 240 million people Analyzed data Presence data login, logout, first ever login, add, remove and block a buddy, change of status (busy, away, be-right-back, idle, etc.) Communication data session id,user id, time joined the session, time left the session, number of messages sent, number of messages received. User demographic information age, gender, location (country, ZIP), language, and IP address
, language, and IP address.")
4
Levels of activity Figure 1(a), follows a heavy-tailed distribution with exponent 3.6. We note spikes in logins at 20 minute and 15 second intervals, which correspond to an auto- login function of the IM client. As shown in Figure 1(b), many users fill up their contact lists rather quickly. The spike at 600 buddies undoubtedly reflects the maximal allowed length of contact lists.
, many users fill up their contact lists rather quickly. The spike at 600 buddies undoubtedly reflects the maximal allowed length of contact lists..")
5
Levels of activity(2)
")
6
Levels of activity(3) Let (ti j, to j ) denote a time ordered (ti j < to j < ti j+1 ) sequence of online and offline times of a user, where ti j is the time of the jth login, and to j is the corresponding logout time.
 Let (ti j, to j ) denote a time ordered (ti j < to j < ti j+1 ) sequence of online and offline times of a user, where ti j is the time of the jth login, and to j is the corresponding logout time.")
7
Demographic characteristics of the users

8
COMMUNICATION CHARACTERISTICS

10
Communication by age

11
Communication by age(2)
")
12
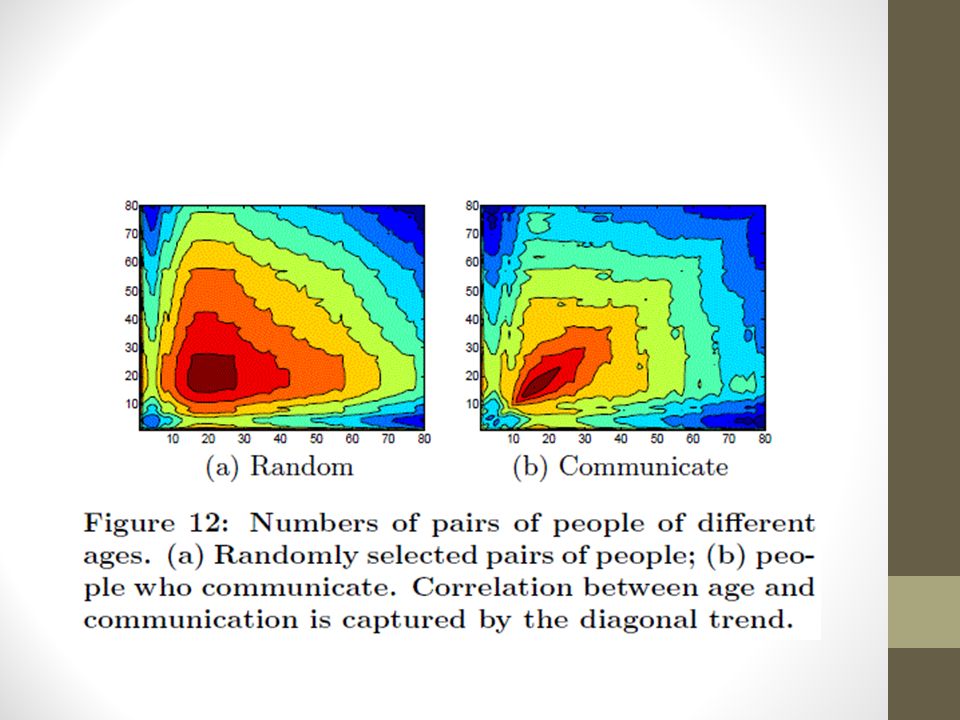
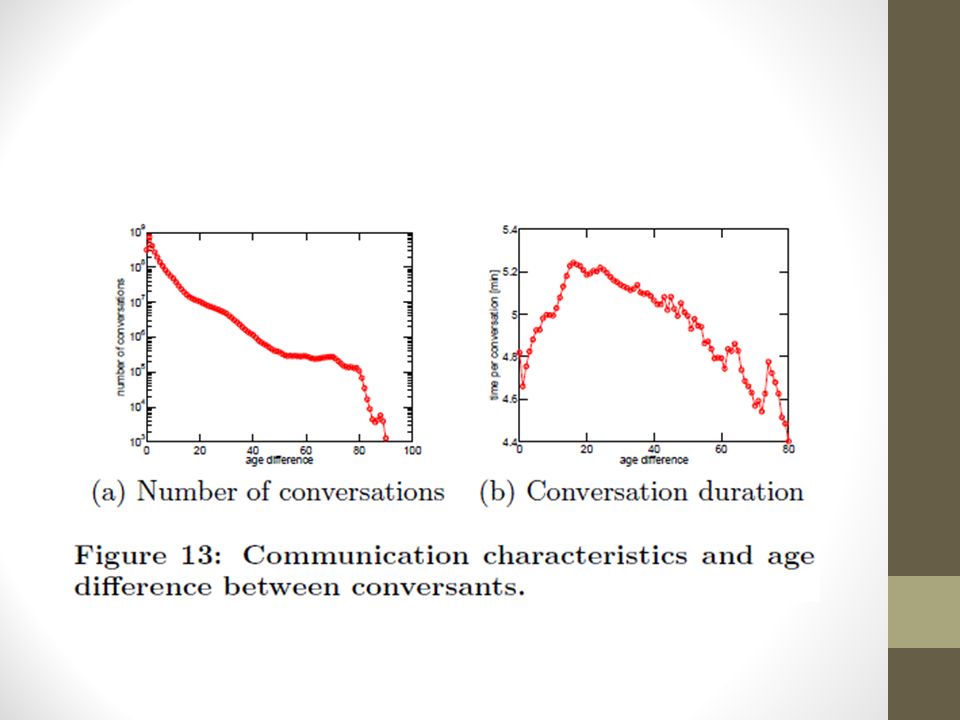
Communication by age(3) (a) Most conversations occur between people of ages 10 to 20. The diagonal trend indicates that people tend to talk to people of similar age. (b) We note that older people tend to have longer conversations. (c) older people exchange more messages, and we observe a dip for ages 25–45 and a slight peak for ages 15–25. (d) we see that younger people have faster-paced dialogs, while older people exchange messages at a slower pace.
 We note that older people tend to have longer conversations. (c) older people exchange more messages, and we observe a dip for ages 25–45 and a slight peak for ages 15–25. (d) we see that younger people have faster-paced dialogs, while older people exchange messages at a slower pace..")
13
Communication by gender

14
Communication by gender(2)
")
15
Communication by gender(3) (a) shows that approximately 50% of conversations occur between male and female and 40% of the conversations occur among users of the same gender (20% for each) (b) find that male-male conversations tend to be shortest, lasting approximately 4 minutes. Female-female conversations last 4.5 minutes on the average. Female-male conversations have the longest durations, taking more than 5 minutes on average. (c) shows that, in female-male conversations, 7.6 messages are exchanged per conversation on the average as opposed to 6.6 and 5.9 for female-female and male-male, respectively (d) The number of messages exchanged per minute of conversation for male–female conversations is higher at 1.5 messages per minute than for cross-gender conversations, where the rate is 1.43 messages per minute.
 shows that, in female-male conversations, 7.6 messages are exchanged per conversation on the average as opposed to 6.6 and 5.9 for female-female and male-male, respectively (d) The number of messages exchanged per minute of conversation for male–female conversations is higher at 1.5 messages per minute than for cross-gender conversations, where the rate is 1.43 messages per minute..")
16
World geography and communication We now focus on the influence of geography and distance among participants on communications. (a) the geographical locations of Messenger users reverse IP lookup We plot all latitude/longitude positions linked to the position of servers where users log into the service.
 the geographical locations of Messenger users reverse IP lookup We plot all latitude/longitude positions linked to the position of servers where users log into the service..")
17
World geography and communication(2)
")
18
World geography and communication(3) Although the maps are built solely by plotting these positions, a recognizable world map is generated. We find that North America, Europe, and Japan are very dense, with many users from those regions using Messenger. For the rest of the world, the population of Messenger users appears to reside largely in coastal regions.

19
World geography and communication(4) (b) harnessed the United Nations gridded world population data to provide estimates of the number of people living in each cell. Given this data, and the data from Figure 7, we calculate the number of users per capita

20
World geography and communication(5)
")
21
World geography and communication(6) several sparsely populated regions stand out as having a high usage per capita. These regions include the center of the United States, Canada, Scandinavia, Ireland, Australia, and South Korea.

22
World geography and communication(7) (c)a heat map that represents the intensities of Messenger communications on an international scale we place the world map on a fine grid, where each cell of the grid contains the count of the number of conversations that pass through that point by increasing the count of all cells on the straight line between the geolocations of pairs of conversants. The color indicates the number of conversations crossing each point

23
World geography and communication(8)
")
24
World geography and communication(9) Australia and New Zealand have communications flowing towards Europe and United States. Similar flows hold for Japan. We see that Brazilian communications are weighted toward Europe and Asia. We can also explore the flows of transatlantic and US transcontinental communications.

25
Communication among countries (a) shows the top countries by the number of conversations between pairs of countries. We examined all pairs of countries with more than 10 million conversations per month The width of edges in the figure is proportional to the logarithm of the number of conversations among the countries. (b) we consider country pairs by the average duration of conversations The width of the edges are proportional to the mean length of conversations between the countries.
 we consider country pairs by the average duration of conversations The width of the edges are proportional to the mean length of conversations between the countries..")
26
Communication among countries(2)
")
27
Communication among countries(3) (a) We find that the United States and Spain appear to serve as hubs and that edges appear largely between historically or ethnically connected countries. As examples, Spain is connected with the Spanish speaking countries in South America, Germany links to Turkey, Portugal to Brazil, and China to Korea. (b) The core of the network appears to be Arabic countries, including Saudi Arabia, Egypt, United Arab Emirates, Jordan, and Syria.
 The core of the network appears to be Arabic countries, including Saudi Arabia, Egypt, United Arab Emirates, Jordan, and Syria..")
28
Communication and geographical distance We were interested in how communications change as the distance between people increases. (a) the number of conversations would decrease with geographical distance as users might be doing less coordination with one another on a daily basis (b) conversations among people who are farther apart would be somewhat longer as there might be a stronger need to catch up when the lessfrequent conversations occurred.
 the number of conversations would decrease with geographical distance as users might be doing less coordination with one another on a daily basis (b) conversations among people who are farther apart would be somewhat longer as there might be a stronger need to catch up when the lessfrequent conversations occurred..")
29
Communication and geographical distance(2)
")
30
Communication and geographical distance(3) (a) a significant drop in communication at distance of 5,000 km (3,500 miles) may reflect the width of the Atlantic ocean or the distance between the east and west coasts of the United States. suggests that users may use Messenger mainly for communications with others within a local context and environment. (b) We interpret this finding to mean that people who are farther apart use Messenger more frequently to communicate.
 We interpret this finding to mean that people who are farther apart use Messenger more frequently to communicate..")
31
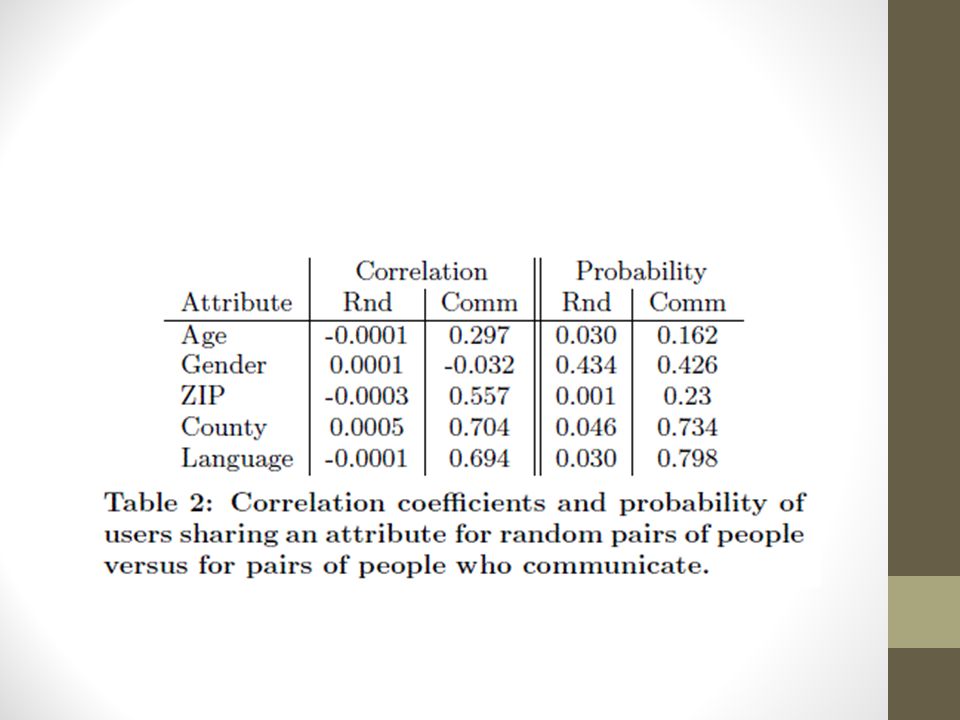
HOMOPHILY OF COMMUNICATION (a) We contrast this with the similarity of pairs of users selected via uniform random sampling across 180 million users. (b)we randomly sample pairs of users from the Messenger user base, and then plot the distribution over reported ages. (c) we further explore communication patterns by the differences in the reported ages among users.
we randomly sample pairs of users from the Messenger user base, and then plot the distribution over reported ages. (c) we further explore communication patterns by the differences in the reported ages among users..")
35
THE COMMUNICATION NETWORK communication network buddy network Degree distribution Clustering coefficient Distribution of connected components

39
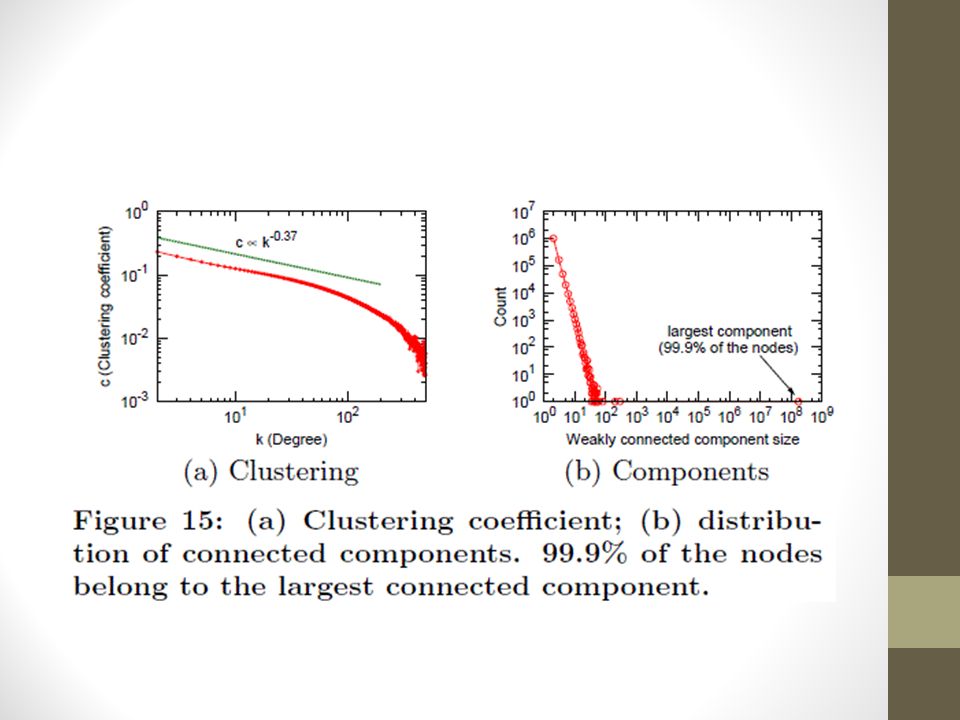
(a) For the Messenger network, the clustering coefficient decays very slowly with exponent −0.37 (k -1 )with the degree of a node and the average clustering coefficient is 0.137 This result suggests that clustering in the Messenger network is much higher than expected that people with common friends also tend to be connected (b) 99.9% of the nodes belong to the largest connected component
 For the Messenger network, the clustering coefficient decays very slowly with exponent −0.37 (k -1 )with the degree of a node and the average clustering coefficient is This result suggests that clustering in the Messenger network is much higher than expected that people with common friends also tend to be connected (b) 99.9% of the nodes belong to the largest connected component")
40
How small is the small world? To approximate the distribution of the distances, we randomly sampled 1000 nodes and calculated for each node the shortest paths to all other nodes.

41
We found that the distribution of path lengths reaches the mode at 6 hops and has a median at 7. The average path length is 6.6. The 90th percentile of the distribution is 7.8. 48% of nodes can be reached within 6 hops and 78% within 7 hops So, we might say that, via the lens provided on the world by Messenger, we find that there are about “7 degrees of separation” among people.

42
Network cores The k-core of a network is a set of vertices K, where each vertex in K has at least k edges to other vertices in K. The distribution of k-core sizes gives us an idea of how quickly the network shrinks as we move towards the core. The k-core of a graph can be obtained by deleting from the network all vertices of degree less than k

44
Strength of the ties It has been observed that many real world networks are robust to node-level changes or attacks. High degree of robustness to random node removals targeted attacks are very effective We study how the Messenger communication network is decomposed when “strong,” i.e., heavily used, edges are removed from the network. the number of edges here is too large (1.3 billion) to remove edges one by one
 to remove edges one by one.")
45
Average sent: The average number of sent messages per user’s conversation Average time: The average duration of user’s conversations Links: The number of links of a user (node degree),i.e.number of different people he or she exchanged messages with Conversations: The total number of conversations of a user in the observation period Sent messages: The total number of sent messages by a user in the observation period Sent per unit time: The number of sent messages per unit time of a conversation Total time: The total conversation time of a user in the observation period Random
,i.e.number of different people he or she exchanged messages with Conversations: The total number of conversations of a user in the observation period Sent messages: The total number of sent messages by a user in the observation period Sent per unit time: The number of sent messages per unit time of a conversation Total time: The total conversation time of a user in the observation period Random")
47
The decomposition procedure highlighted two types of dynamics of network change with node removal The size of the largest component decreases rapidly when we use as measures of engagement the number of links, number of conversations, total conversation time, or number of sent messages. In contrast, the size of the largest component decreases very slowly when we use as a measure of engagement the average time per conversation, average number of sent messages, or number of sent messages per unit time.

49
these findings demonstrate that users with long conversations and many messages per conversation tend to have smaller degrees Figure 18 also shows that using the average number of messages per conversation as a criterion removes edges in the slowest manner. We believe that this makes sense intuitively: If users invest similar amounts of time to interacting with others, then people with short conversations will tend to converse with more people in a given amount of time than users having long conversations.

Similar presentations


 –Undirected graph and directed graph –Weighted graph and unweighted graph.>")


 Lada Adamic School of Information University of Michigan Ann Arbor, MI 48109-1107>")