Download presentation
Presentation is loading. Please wait.

2
Momentary detour... Ideas for collecting data from our classroom; what would YOU like to collect? So far, social media, piercings, # pets, first pet, etc. Turn in your 3 x 5 card by end of the night; don’t feel like you have to put your name on it; your choice.

3
Last chapter... Four Corners: Go to your corner based on if your birthday falls in the Winter, Spring, Summer, or Fall; 1 minute In your group, come to a consensus about the three most important topics we learned and list them on the board. 5 minutes.

4
Last chapter, we learned... Appropriate graphical representations (numerical & categorical data) Always graph the data; always. Describing numerical distributions/data sets via SOCS (the basics; we will get more sophisticated with our descriptions soon); do we use SOCS to describe categorical data distributions? Why or why not?
 Always graph the data; always. Describing numerical distributions/data sets via SOCS (the basics; we will get more sophisticated with our descriptions soon); do we use SOCS to describe categorical data distributions. Why or why not .")
5
SOCS... Shape, outlier(s), center, spread We loosely defined ‘center’ and ‘spread’ Now we will be much more specific & detailed... And remember, always embed context Here we go...
, center, spread We loosely defined ‘center’ and ‘spread’ Now we will be much more specific & detailed... And remember, always embed context Here we go....")
6
Word association time... When I say a word, you immediately write down what you think it means; don’t think, just write. Ready?

7
Word association time... Average

8
Bill Gates walks into a diner... The annual salaries of 7 patrons in a diner are listed below. Find the mean and the median using Minitab Are the mean and the median similar? Would they represent a ‘typical’ or ‘average’ customer’s salary? Should we use the mean or the median in this case? Graph the data (let’s choose a histogram) using Minitab. What shape is the distribution? $45,000$50,000 $43,000$40,000 $35,000$55,000 $46,000
 using Minitab. What shape is the distribution. $45,000$50,000 $43,000$40,000 $35,000$55,000 $46,000.")
9
Now, Bill Gates walks into the diner... Find the mean and the median using Minitab Are the mean and the median similar? Would they represent a ‘typical’ or ‘average’ customer’s salary? Should we use the mean or the median in this case? Graph the data (let’s choose a histogram) using Minitab. What shape is the distribution? $45,000$50,000 $43,000$40,000 $35,000$55,000 $46,000$3,710,000,000
 using Minitab. What shape is the distribution. $45,000$50,000 $43,000$40,000 $35,000$55,000 $46,000$3,710,000,000.")
10
What’s the moral of this story? Means are excellent measures of central tendency if the data is (fairly) symmetric However, means are highly influenced by outlier(s) So, if the data has an outlier(s), then a better measure of central tendency is the median, which is not influenced by outliers; this is called ‘resistant’ So, consider the shape of your data/distribution, then wisely choose an appropriate measure of central tendency
 symmetric However, means are highly influenced by outlier(s) So, if the data has an outlier(s), then a better measure of central tendency is the median, which is not influenced by outliers; this is called ‘resistant’ So, consider the shape of your data/distribution, then wisely choose an appropriate measure of central tendency.")
11
Which measure of central tendency should we use?.

12
.

13
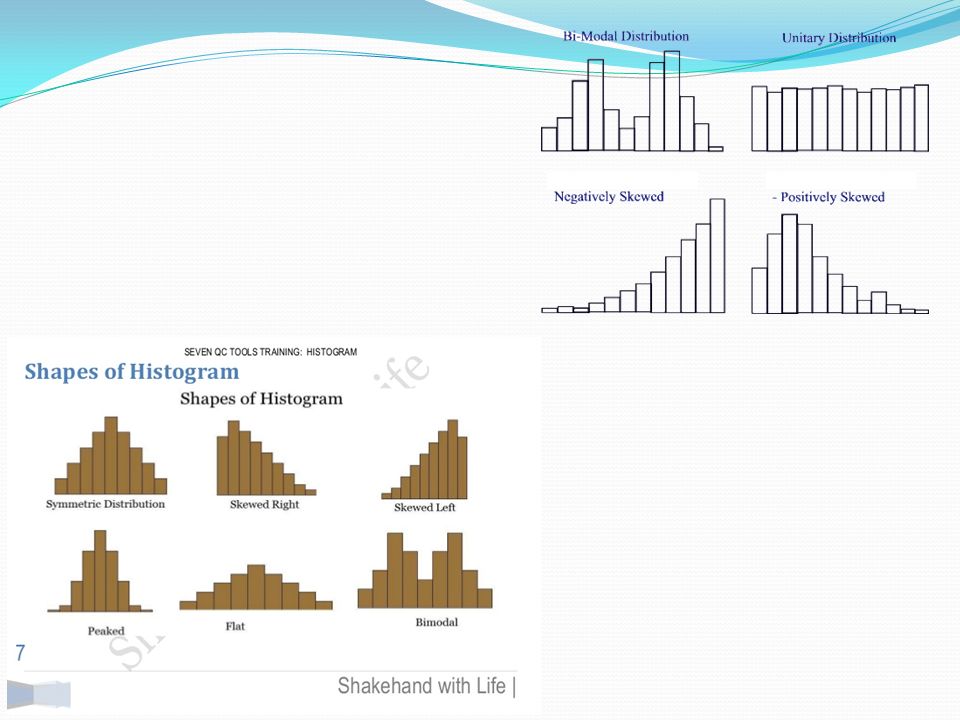
For this distribution, which is larger: mean or median?

14
Left skewed; how does mean compare to median?

16
What is the mean of each data set? Use Minitab and calculate the mean of each of the following data sets: (13, 19, 14, 23, 10)(11, 17, 18, 1, 32) Are they the same distribution/data set? Another characteristic that is helpful in describing distributions/data sets is standard deviation, which is the typical distance from center (mean) Standard deviation is usually is paired with mean (FYI median usually paired with IQR... But more on this later)
(11, 17, 18, 1, 32) Are they the same distribution/data set. Another characteristic that is helpful in describing distributions/data sets is standard deviation, which is the typical distance from center (mean) Standard deviation is usually is paired with mean (FYI median usually paired with IQR... But more on this later).")
17
Game time... Stand up and line up from shortest to tallest, with absolutely no talking. 2 minutes. Go.

18
Let’s play the standard deviation game... Your team’s task: Create a data set of four numbers (from 1 to 10) with the lowest standard deviation value possible Input your four numbers (again use numbers from 1 to 10 only) into Minitab, then calculate the standard deviation Change a value or values until you get the lowest possible standard deviation you can. 3 minutes. Go. Share out and discuss.
 with the lowest standard deviation value possible Input your four numbers (again use numbers from 1 to 10 only) into Minitab, then calculate the standard deviation Change a value or values until you get the lowest possible standard deviation you can. 3 minutes. Go. Share out and discuss..")
19
Which has the largest SD?

20
Calculating the standard deviation...

21
Variance... Another measure of spread Not used very often; usually, if we use a mean as a measure of central tendency, we use the standard deviation as our measure of spread Variance is related to standard deviation variance = (standard deviation) 2 standard deviation =
 2 standard deviation =.")
22
Data collection time... Think of two female friends (not family members). Text them and get their heights, in inches. On the board, write their height (and yours if you are female) Input your data into Minitab Find the mean, the median, create a histogram, & describe our data (5 minutes)
 Input your data into Minitab Find the mean, the median, create a histogram, & describe our data (5 minutes).")
23
The Empirical Rule... When distributions are uni-modal, ≈ symmetric, & mean ≈ median, then... life is beautiful Distribution is said to be ≈ Normal 68% of data within 1 standard deviation of mean 95% of data within 2 standard deviations of mean 99.7% of data within 3 standard deviations of mean

24
68-95-99.7 Rule (Empirical Rule) For (≈)Normal Distributions Only
 For (≈)Normal Distributions Only")
25
Empirical ‘Model’...

26
New topic.. (not female heights anymore)... Is 120 big or small? Think – Pair - Share
... Is 120 big or small Think – Pair - Share")
27
TPS... Is 120 big or small? Big if... day’s temperature in LA in degrees Fahrenheit or # units a student takes during a semester (really big!) Small if... monthly rent paid for an apartment in LA Usual or ‘average’ if... Weight in pounds for a 15-year-old girl or systolic blood pressure Nearly impossible to answer how unusual 120 is unless we know what we are comparing 120 to.
 Small if... monthly rent paid for an apartment in LA Usual or ‘average’ if... Weight in pounds for a 15-year-old girl or systolic blood pressure Nearly impossible to answer how unusual 120 is unless we know what we are comparing 120 to..")
28
Something else to consider... A student’s ACT score was 25.9; their SAT score was 1172. Which is a better score? ACT scores’ (national) mean = 21, standard deviation 4.7 SAT (national) mean (critical reading & math) = 1010, standard deviation = 163
 mean = 21, standard deviation 4.7 SAT (national) mean (critical reading & math) = 1010, standard deviation = 163.")
29
Z-Scores, standardizing... Z-scores, or standardizing data, is when we convert raw data into # of SD’s away from mean

30
Let’s practice with our data...

31
What about skewed distributions?

32
Remember Bill Gates? Median, ‘center’ value when data is organized from smallest to largest values Consider the distribution: 0, 0, 0, 0, 1, 1, 1, 2, 6 By the way, what could be the context? Median = Consider the distribution: 0, 0, 0, 0, 1, 2, 2, 2, 2, 6 Median =

33
Data gathering time again... # pets you currently have on board & enter into Minitab Numerical analysis (descriptive statistics in Minitab) and graphical representation Describe the distribution
 and graphical representation Describe the distribution.")
34
Skewed? Shouldn’t use mean & SD But we still need to describe the center and the spread of the distribution Use median and IQR (Inter-quartile Range) Median & IQR are not effected by outlier(s) (resistant) IQR = Q3 – Q1 IQR is amount of space the middle 50% of the data occupy
 Median & IQR are not effected by outlier(s) (resistant) IQR = Q3 – Q1 IQR is amount of space the middle 50% of the data occupy.")
35
Range of data... Another measure of variability (used with any distribution) is range Range = maximum value – minimum value Range for our data =
 is range Range = maximum value – minimum value Range for our data =.")
36
Graphical representations using median & IQR... Boxplots

37
Boxplots...

39
Modified boxplot – shows outlier(s)
")
40
Two modified boxplots...

41
What are outliers? Boxplots are the only graphical representation where we specifically define an outlier Potential outliers are values that are more than 1.5 IQRs from Q1 or Q3 IQR x 1.5; add that product to Q3; any value(s) beyond that point is an outlier to the right Q1; any value(s) beyond that point is an outlier to the left
 beyond that point is an outlier to the right Q1; any value(s) beyond that point is an outlier to the left.")
42
Go back to our pet data... Using Minitab, calculate descriptive statistics Let’s calculate (by hand) to see if we have any outliers Q3 – Q1 = IQR IQR x 1.5; add this product to Q3; are there any values in our data set beyond this point to the right? IQR x 1.5; subtract product from Q1; are there any values in our data set beyond this point to the left? Now use Minitab to create a boxplot; are our calculations confirmed with our boxplot?
 to see if we have any outliers Q3 – Q1 = IQR IQR x 1.5; add this product to Q3; are there any values in our data set beyond this point to the right. IQR x 1.5; subtract product from Q1; are there any values in our data set beyond this point to the left. Now use Minitab to create a boxplot; are our calculations confirmed with our boxplot .")
43
Be careful with outliers... Are they really an outlier? Is your data correct? Was it input accurately? COC’s recent 99-year-old graduate Don’t automatically throw out an unusual piece of data; investigate

44
Be careful... one more thing...

45
Chapters 1, 2, 3... Review Exam

Similar presentations


 –Quantitative (Graphical) –Summation Notation –Qualitative (Numerical) Central.>")
 - Room 201 s c r e e n Row A Row B Row C Row D Row E Row F Row G Row H 131211109 87 Row A 14131211109.>")


