Download presentation
Presentation is loading. Please wait.

1
HARMONISINGEUROPEAN SNOW LOADS MAPPING B.Eiselt, R.Peckham, G.Solomos ISIS, JRC - Ispra (Italy)
")
2
"Scientific Support Activity in the field of Structural Stability of Civil Engineering Works related to Snow Loads”, financed by DGIII, lead by University of Pisa Consortium: Italy, Germany, France, UK, Norway and Switzerland FINAL GOAL PROPOSAL FOR EUROCODES ROOF SNOW LOAD Coverage: Coverage: 18 members of CEN - European Committee for Standardization (15 EU countries plus Switzerland, Norway and Iceland).
.")
3
MAP OF GROUND SNOW LOADS Harmonised and European wide Structural engineering design codes (Eurocodes) HARMONISED DATA:HARMONISED DATA: maximum snow load, specific return interval (Project Partners) HARMONISED METHOD:HARMONISED METHOD: SPATIAL EVALUATION OF THE DATA (JRC) TASK OF JRC
 HARMONISED DATA:HARMONISED DATA: maximum snow load, specific return interval (Project Partners) HARMONISED METHOD:HARMONISED METHOD: SPATIAL EVALUATION OF THE DATA (JRC) TASK OF JRC")
4
IMPORTANCE of GIS: error checking (reference system, double stations, errors in lon/lat) data managing including other spatial information, esp. DTM, boundaries, rivers spatial analysis visualisation

5
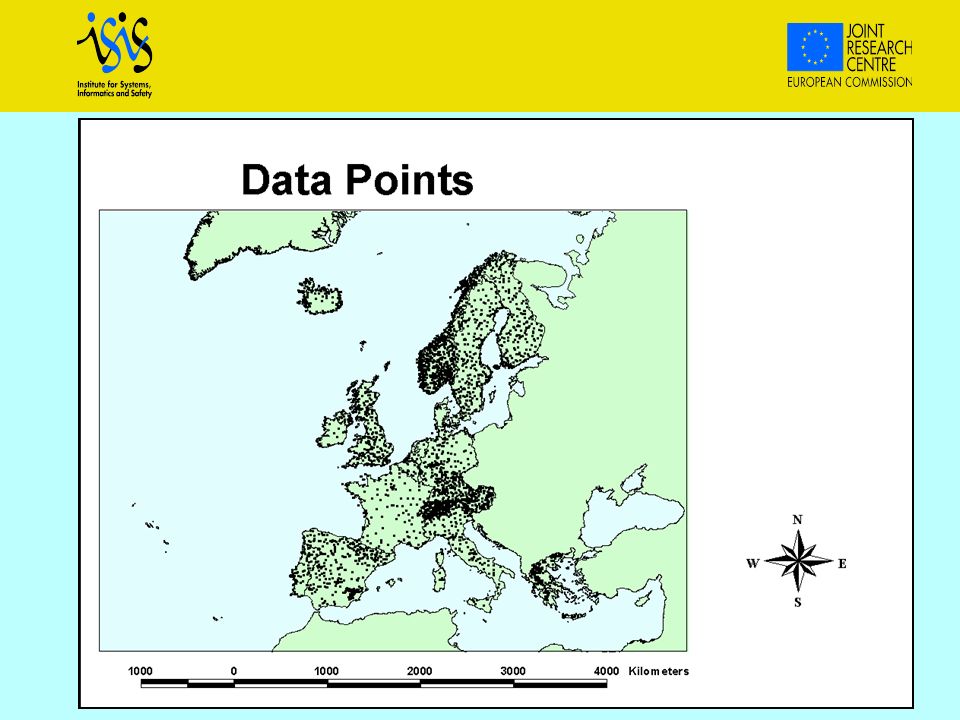
Meteo Stations: 2786 Maximum Yearly Snow Load / Snow Height Country No. StationsMin. no. of yrsMax. no. of yrs data Austria 16028 50 Belgium 1311 31 Eire 1430 58 … …… … convert snow height to snow load no of years of measurements THE DATA

7
MAPSNOW LOAD - ALTITUDERELATIONSHIP MAP SNOW LOAD - ALTITUDE RELATIONSHIP CLIMATIC REGIONS CLIMATIC REGIONS - similar climate ZONES: curve ZONES: specific snow load/ height relationship (curve fitting, interpolation, smoothing, reclass fitting, interpolation, smoothing, reclass) VALIDATION VALIDATION check the results (meteorological stations, region boundaries). METHODOLOGY

8
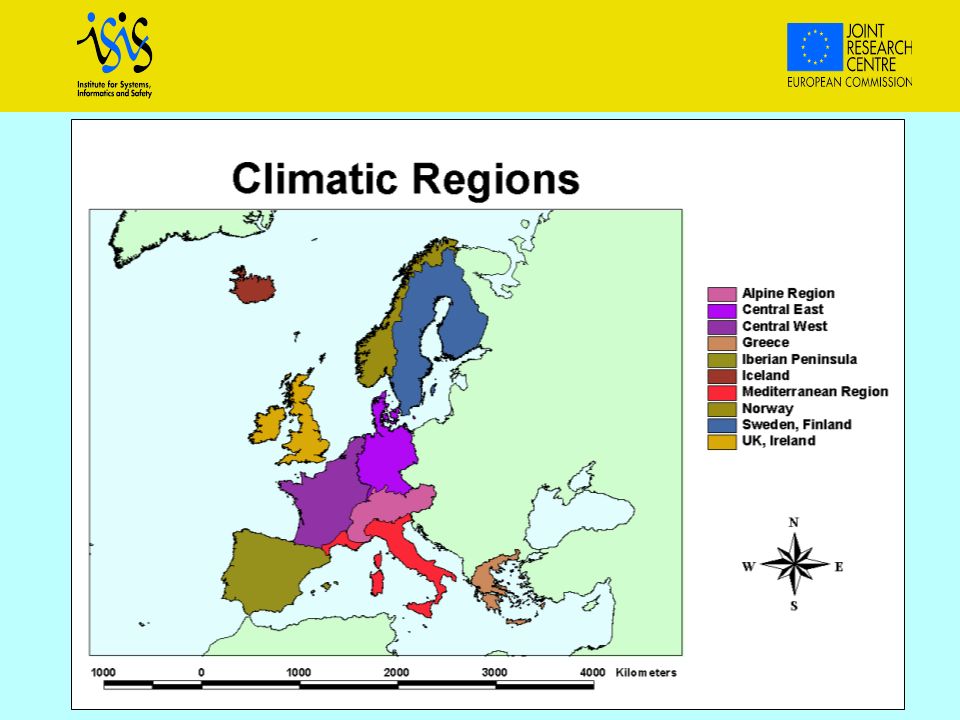
SCOPE: GROUPSTATIONS GROUP STATIONS SIMILAR SNOW LOAD/ALTITUDE RELATIONSHIP CRITERIA: known climatic regions known climatic regions (as the 500 m height contour, a known boundary for rainfall patterns), physical boundaries physical boundaries (sea…) observed similar behaviour observed similar behaviour of the data. CLIMATIC REGIONS

10
Typical Altitude Function s = snow load at altitude h a = related to snow load at sea level b = related to influence of the altitude ZONE NUMBER a ZONE NUMBER a : characterise the snow load/altitude relationship TWO PARAMETER FUNCTION: Fix parameter “b” for the whole region - influence of altitude Determine parameter “a” for every station - SL at sea level CURVE FITTING

11
INTERPOLATION INVERSE DISTANCE WEIGHTING (IDW)INVERSE DISTANCE WEIGHTING (IDW) Classical Approach: Classical Approach: without buffer zones Revised Approach:BUFFER ZONES Revised Approach: with BUFFER ZONES SMOOTHING (mean filter): eliminate microzonesSMOOTHING (mean filter): eliminate microzones RECLASSIFICATIONRECLASSIFICATION
INVERSE DISTANCE WEIGHTING (IDW) Classical Approach: Classical Approach: without buffer zones Revised Approach:BUFFER ZONES Revised Approach: with BUFFER ZONES SMOOTHING (mean filter): eliminate microzonesSMOOTHING (mean filter): eliminate microzones RECLASSIFICATIONRECLASSIFICATION")
12
RESULTS

13
RESULTS

14
VALIDATION METEO STATIONS:METEO STATIONS: compare actual/calculated SL BORDERS : BORDERS : compare differences of snow load calculated formulas of the confining climatic regions according to the formulas of the confining climatic regions. Improves using BUFFER ZONES

15
CONCLUSIONS Harmonised European Map Harmonised European Map Importance of GIS Importance of GIS Conversion to Administrative Boundaries Conversion to Administrative Boundaries Maintenance Maintenance – new data for existing countries – extend to other countries

Similar presentations


 Surface Meteorological Stations and Data Quality Control Procedures.>")


 data into Raster based PMP data using different interpolation.>")
 Point-in-polygon Polygon Overlay Spatial Interpolation –Theissen.>")


 Cossu A., Fiori M., Canu S. Agrometeorological Service of Sardinia.>")
 Locate on a world and regional political‐ physical map: the Danube River,>")
 MeteoMet Project (October 2011) WP3. Traceable measurements methods and protocols for ground based meteorological.>")