Download presentation
Presentation is loading. Please wait.

1
Diabetes mellitus & Cardiovascular Disease
Cardiology Grand Rounds May 11, 2004 Dr. William Harper Assistant Professor of Medicine, McMaster University. Endocrinologist, Hamilton General Hospital

2
DM & Cardiovascular Disease
Understanding cardiovascular risk in patients with diabetes Glycemic control & CVD: evidence Glycemic control & CVD: best practice

3
Diabetes: Complications
Macrovascular Microvascular Stroke Diabetic eye disease (retinopathy and cataracts) Heart disease and hypertension 2-4 X increased risk Renal disease Peripheral vascular disease Erectile Dysfunction The risk of CAD and stroke is increased two to four times in patients with diabetes. Cardiovascular disease is a major cause of morbidity and mortality in diabetes. Morbidity and mortality rates are two to four times higher than in age- and sex-matched groups in the population without diabetes. The eye and the kidney are common sites for microvascular complications of diabetes. Diabetic retinopathy is the leading cause of adult blindness in North America. Cataracts and glaucoma are also significantly more frequent in patients with diabetes, especially those over age 65. Diabetes is the leading cause of end-stage renal failure. Foot problems, a frequent consequence of neuropathy and peripheral vascular disease, constitute a major complication. Diabetes is the leading cause of non-traumatic lower-extremity amputations in North America. Peripheral Neuropathy Foot problems Meltzer et al. CMAJ 1998;20(Suppl 8):S1-S29.
 Heart disease and hypertension. 2-4 X increased risk. Renal disease. Peripheral. vascular disease. Erectile Dysfunction. The risk of CAD and stroke is increased two to four times in patients with diabetes. Cardiovascular disease is a major cause of morbidity and mortality in diabetes. Morbidity and mortality rates are two to four times higher than in age- and sex-matched groups in the population without diabetes. The eye and the kidney are common sites for microvascular complications of diabetes. Diabetic retinopathy is the leading cause of adult blindness in North America. Cataracts and glaucoma are also significantly more frequent in patients with diabetes, especially those over age 65. Diabetes is the leading cause of end-stage renal failure. Foot problems, a frequent consequence of neuropathy and peripheral vascular disease, constitute a major complication. Diabetes is the leading cause of non-traumatic lower-extremity amputations in North America. Peripheral Neuropathy. Foot problems. Meltzer et al. CMAJ 1998;20(Suppl 8):S1-S29.")
4
Fatal and Non-Fatal Myocardial Infarction
14% decrease per 1% decrement in HbA1c p<0.0001 . 5 1 6 7 8 9 Updated mean HbA1c Hazard ratio UKPDS 35. BMJ 2000; 321:

5
Disease Burden of Diabetes Mellitus
Leading cause of blindness (12.5% of cases) Leading cause of ESRD (42% of cases) 50% of all non-traumatic amputations 2.5x increase risk of stroke 2-4x increase in cardiovascular mortality DM responsible for 25% of cardiac surgeries Mortality in DM: 70% due to Cardiovascular disease
 Leading cause of ESRD (42% of cases) 50% of all non-traumatic amputations. 2.5x increase risk of stroke. 2-4x increase in cardiovascular mortality. DM responsible for 25% of cardiac surgeries. Mortality in DM: 70% due to Cardiovascular disease.")
6
How is CAD Different in Diabetes ?
> CAD extent Multi-vessel disease Distal disease – more difficult to revascularize Silent ischemia/MI Younger Women Worse outcomes despite revascularization Increased re-stenosis after PCI even with stents ACB: worse periop & long-term outcomes

7
Haffner et al, NEJM, 339(4):229-34, 1998.
:229-34, 1998.")
8
Was Haffner right? Conclusions based on no difference found between 2 groups: No DM, prior MI N= 69 DM, no prior MI N = 890 Underpowered!

9
Evans et al. BMJ 324: 939-942 April 2002 Cross-sectional study
DM 1155 patients MI 1347 patients Cohort study DM 3477 patients MI 7414 patients

10
OASIS Study: Total Mortality
Diabetes/CVD (n = 1148) RR=2.88 (2.37–3.49) Diabetes/No CVD (n = 569) No Diabetes/CVD (n = 3503) No Diabetes/No CVD (n = 2796) RR=1.99 (1.52–2.60) Event Rate RR=1.71 (1.44–2.04) RR=1.00 OASIS study: total mortality The OASIS study also supports the concept of diabetes as a CHD risk equivalent. This study is more generalizable than the Finnish East-West study since it was based in 6 different countries and has a larger population. Reference: Malmberg K, Yusuf S, Gerstein HC, Brown J, Zhao F, Hunt D, Piegas L, Calvin J, Keltai M, Budaj A. Impact of diabetes on long-term prognosis in patients with unstable angina and non-Q-wave myocardial infarction: results of the OASIS (Organization to Assess Strategies for Ischemic Syndromes) Registry. Circulation 2000;102: 3 6 9 12 15 18 21 24 Months Malmberg K et al. Circulation 2000;102: ©2000 Lippincott Williams & Wilkins.
 RR=2.88 (2.37–3.49) Diabetes/No CVD (n = 569) No Diabetes/CVD (n = 3503) No Diabetes/No CVD (n = 2796) RR=1.99 (1.52–2.60) Event Rate. RR=1.71 (1.44–2.04) RR=1.00. OASIS study: total mortality. The OASIS study also supports the concept of diabetes as a CHD risk equivalent. This study is more generalizable than the Finnish East-West study since it was based in 6 different countries and has a larger population. Reference: Malmberg K, Yusuf S, Gerstein HC, Brown J, Zhao F, Hunt D, Piegas L, Calvin J, Keltai M, Budaj A. Impact of diabetes on long-term prognosis in patients with unstable angina and non-Q-wave myocardial infarction: results of the OASIS (Organization to Assess Strategies for Ischemic Syndromes) Registry. Circulation 2000;102: Months. Malmberg K et al. Circulation 2000;102: ©2000 Lippincott Williams & Wilkins.")
11
Canadian Lipid Working Group: Target Levels in Diabetes = established CVD
Canadian recommendations place patients with diabetes in “very high” risk group for CAD (1999): LDL TC/HDL ratio TG < 2.5 mmol/L < 4 < 2.0 mmol/L The Canadian Lipid Working Group developed target levels for LDL, TC/HDL ratio and triglycerides, as listed in the chart. Diabetes itself is a potent risk factor for CAD in both men and women over age 30.
: LDL TC/HDL ratio TG. < 2.5 mmol/L < 4 < 2.0 mmol/L. The Canadian Lipid Working Group developed target levels for LDL, TC/HDL ratio and triglycerides, as listed in the chart. Diabetes itself is a potent risk factor for CAD in both men and women over age 30.")
12
Heart Protection Study & DM
n = 20,530 (3982 with Diabetes Mellitus) hi-risk patients age 40-80, prior CAD or PVD, DM, HTN (males age > 65) Non-fasting TC > 3.5 mM 5.5 year RCT: Simvastatin 40 mg od vs placebo Mortality ARR 1.8% (NNT 56) Vascular Event ARR 5.4% (NNT 19) Coronary event, Stroke, Revascularisation Benefit obtained even in low cholesterol patients: LDL baseline 2.5 mM 1.7 mM with Rx Prior LDL targets for hi-risk patients too high? Canadian Lipid Work Group 2.5 mM NCEP 2.6 mM CARE 3.2 mM
 hi-risk patients. age 40-80, prior CAD or PVD, DM, HTN (males age > 65) Non-fasting TC > 3.5 mM. 5.5 year RCT: Simvastatin 40 mg od vs placebo. Mortality ARR 1.8% (NNT 56) Vascular Event ARR 5.4% (NNT 19) Coronary event, Stroke, Revascularisation. Benefit obtained even in low cholesterol patients: LDL baseline 2.5 mM 1.7 mM with Rx. Prior LDL targets for hi-risk patients too high Canadian Lipid Work Group 2.5 mM. NCEP 2.6 mM. CARE 3.2 mM.")
13
T2DM & Atherosclerosis How much risk !?!

14
T2DM & Atherosclerosis How much risk !?!
Epidemiological data: 2-4x increased

15
T2DM & Atherosclerosis How much ABSOLUTE risk !?!
It depends on the particular patient! i.e. the patient in the study or the patient in your office!

16
T2DM & Atherosclerosis UKPDS
Cntrl group event rates MI % per year Fatal MI 0.8% per year CVA 0.5% per year Amputation for PVD 0.16% per year HOPE (> 55 y.o., DM + 1 CV risk factor) MI, CVA, or death from CVD Cntrl group event rate (i.e. no ramipril): 4% per year
 MI, CVA, or death from CVD. Cntrl group event rate (i.e. no ramipril): 4% per year.")
17
T2DM & Atherosclerosis What about the patient in your office?
UKPDS Risk Engine Download at Weigh the cardiovascular risk with the cost and side effects of preventative medications

18
DM & Cardiovascular Disease
Understanding cardiovascular risk in patients with diabetes Glycemic control & CVD: evidence Glycemic control & CVD: best practice

19
Glycemic Control & atherosclerosis
UKPDS 33, Lancet 352:837-53, 1998. RCT of a policy of intensive BS control FPG < 6 mM v.s. FPG < 15 mM Achieved a number of ways: Sulfonylurea (chlorpropamide or glibenclamide/glyburide) Metformin (overweight subgroup, add-on) Insulin (bedtime basal +/- basal/bolus regimens)
 Metformin (overweight subgroup, add-on) Insulin (bedtime basal +/- basal/bolus regimens)")
20
Glycemic Control & atherosclerosis
UKPDS 33: Main study Any DM related end point: 12% RRR Microvascular complications: 25% RRR Reduced eye disease: retinal laser Sx (19%), cataract Sx (24%), DM retinopathy (21%) 33% RRR microalbuminuria, 74% RRR in doubling of creatinine MI: 16% RRR (P = NS) No mortality benefit
, cataract Sx (24%), DM retinopathy (21%) 33% RRR microalbuminuria, 74% RRR in doubling of creatinine. MI: 16% RRR (P = NS) No mortality benefit.")
21
Glycemic Control & atherosclerosis
UKPDS 34: overweight metformin substudy Unlike sulfonylurea & insulin: no weight gain Any DM related end point: 32% RRR DM related death: 42% RRR All cause mortality: 36% RRR MI: 39% RRR Metformin + SU: increased mortality?

22
T2DM & Macrovascular disease
Why no clear benefit in UKPDS to glycemic cntrl? Low CV risk patients: UKPDS cntrl death rate: 1.2 % per year HOPE cntrl death rate: per year 2.5% per year Unable to maintain glycemic cntrl due to limited interventions: Available: glyburide, chlorpropamide, metformin, regular insulin No newer sulfonylureas: glimepiride (Amaryl), gliclazide (diamicron) No meglitinides: repaglinide (Gluconorm), nateglinide (Starlix) No TZD’s: rosiglitazone (Avandia), pioglitazone (Actos) No insulin analogues: (Humalog, Novorapid, Lantus)
, gliclazide (diamicron) No meglitinides: repaglinide (Gluconorm), nateglinide (Starlix) No TZD’s: rosiglitazone (Avandia), pioglitazone (Actos) No insulin analogues: (Humalog, Novorapid, Lantus)")
23
UKPDS 33, Lancet 352:837-53, 1998. DCCT, NEJM 329:977-86, 1993.

24
Natural History of Type 2 Diabetes
Insulin resistance Glucose level Insulin Natural History of Type 2 Diabetes Prior to type 2 diabetes insulin levels are similar and constant. In the majority of patients that go on to develop type 2 diabetes, increasing insulin resistance leads to an increases in circulating insulin. So as insulin resistance increases, so does the production of insulin needed to keep blood sugars normal. As time progresses, the insulin resistance reach a peak and stabilize while the insulin producing cells begin to wear out. We call it pooped out pancreas. First, Impaired Glucose Tolerance (IGT): This is the point that the Beta cell begins to fail and blood sugars begin to elevate, especially after a large CHO load.. Type 2 Diabetes: Following the onset of Beta-cell dysfunction, insulin levels can no longer overcome insulin resistance, and fasting and postprandial glucose levels increase progressively over time. production b -cell dysfunction Time Normal Impaired glucose Type 2 diabetes tolerance
: This is the point that the Beta cell begins to fail and blood sugars begin to elevate, especially after a large CHO load.. Type 2 Diabetes: Following the onset of Beta-cell dysfunction, insulin levels can no longer overcome insulin resistance, and fasting and postprandial glucose levels increase progressively over time. production. b. -cell. dysfunction. Time. Normal. Impaired glucose. Type 2 diabetes. tolerance.")
25
ACS: Glycemic Control 2/3 of ACS patients may have dysglycemia:
1/3 overt DM (FBS > 7.0 mM, 2hPG > 11.1 mM) 1/3 IGT (2hPG > 7.8 mM) At time of discharge & 3 months later Higher BS predicts worse outcomes: Increased mortality Increased CHF, cardiogenic shock (non-DM) Stress hyperglycemia? Epiphenomenon?
 1/3 IGT (2hPG > 7.8 mM) At time of discharge & 3 months later. Higher BS predicts worse outcomes: Increased mortality. Increased CHF, cardiogenic shock (non-DM) Stress hyperglycemia Epiphenomenon")
26
ACS: Glycemic Control DIGAMI
620 patients AMI, prior dx DM or BS > 11 mM IV insulin gtt 5 U/h Titrated to keep BS mM Insulin IV > 24h MDI > 3 months No in-hospital mortality benefit. Rx Increased hospitalization by 1.8d 0.5% reduction 3 months @ 1 year % on Insulin: 72% Rx Group 49% Cntrl Group 1 year mort: ARR 7 % ( %), NNT 14 3.4 y mort: ARR 11% (44 – 33 %), NNT 9
, NNT y mort: ARR 11% (44 – 33 %), NNT 9.")
27
ACS: DIGAMI Small study (N=620), single centre
Primary outcome negative What part of intervention beneficial? Few days of IV insulin? 3 months of SC insulin M.D.I. ? Benefit only seen at 1 year DIGAMI 2…

28
Multifactorial DM Rx: STENO-2
Jan 2003, NEJM 348:383-93 RCT mimicking real life clinic 160 T2DM patients with microalbuminuria Randomized: Conventional Rx as per National Guidelines versus Intensive Rx Behaviour modification Pharmacotherapy: targeting BS, BP, Lipids, proteinuria, ASA (initially 2 prevention only, 1 prevention after 1999)
")
29
Multifactorial DM Rx: STENO-2

30
Multifactorial DM Rx: STENO-2

31
STENO-2, NEJM, 348:383-93, 2003. UKPDS 33, Lancet 352:837-53, 1998. DCCT, NEJM 329:977-86, 1993.

32
Multifactorial DM Rx: STENO-2

34
Insulin Glargine (Lantus)
Substitution of glycine and arginine residues gives name “glargine” 2 arginine residues make glargine more soluble in acidic pH of injection medium but less soluble in physilogic pH of subQ tissues Once injected, glargine precipitates leading to slower absorption Glycine substitution prevents degradation in subQ tissues

35
Insulin Glargine (Lantus)
Little to no peak effect Less hypoglycemia

36
DM & Cardiovascular Disease
Understanding cardiovascular risk in patients with diabetes Glycemic control & CVD: evidence Glycemic control & CVD: best practice

37
Sites of Action of Currently Available Therapeutic Options
MUSCLE ADIPOSE TISSUE LIVER PANCREAS GLUCOSE PRODUCTION Metformin Thiazolidinediones PERIPHERAL GLUCOSE UPTAKE Thiazolidinediones Metformin INSULIN SECRETION Sulfonylureas: Glyburide, Gliclazide, Glimepiride Non-SU Secretagogues: Repaglinide, Nateglinide INTESTINE GLUCOSE ABSORPTION Alpha-glucosidase inhibitors

38
Hypoglycemia Wt. Gain Edema GI Lactic Liver Use in
effects Acidosis Toxicity Renal Failure Glyburide Gliclazide Glimepiride Repaglinide Nateglinide ? Metformin Acarbose Rosiglitazone * Pioglitazone * * Liver enzyme monitoring recommended in product monographs Adapted from Lebovitz H: Endocrinol & Metab Clinics of NA; 30 (4)
")
39
TZD adverse effects Edema Mild anemia (dilutional) Weight gain
4-5% of patients get mild-moderate edema 15% if TZD used in combo with insulin Mild anemia (dilutional) Weight gain Increase in subcutaneous not visceral fat Myalgia (pioglitazone only) Myalgia 5.4% pioglitaz. versus 2.7% placebo Few patients with unexplained CK > 10x ULN Contraindicated in class II, III and IV CHF Contraindicated if ALT > 2.5x ULN or active liver disease
 Weight gain. Increase in subcutaneous not visceral fat. Myalgia (pioglitazone only) Myalgia 5.4% pioglitaz. versus 2.7% placebo. Few patients with unexplained CK > 10x ULN. Contraindicated in class II, III and IV CHF. Contraindicated if ALT > 2.5x ULN or active liver disease.")
40
Drug Trade Dose Cost ODB
Glyburide Diabeta Start mg od Spit dose bid > 10mg/d Max 10 mg bid $14/mos Yes Gliclazide Diamicron Start 80 mg bid Max 160 mg bid $90/mos No MR Start 30 mg od Max 120 mg od $30/mos Exp Sect 8 Glimepiride Amaryl Start 1-2 mg od Max 8 mg od $30-40/mos Repaglinide Gluconorm Start 0.5 mg tid-qid Max 4 mg qid $45/mos Nateglinide Starlix Start mg tid Max 180 mg tid Metformin Glucophage Start 500 mg od-bid Max 1000 mg bid Pioglitazone Actos Start mg od Max 45 mg od $92/mos Rosiglitazone Avandia Start 4 mg od Max 4 mg bid $ 60/mos $ 120/mos

42
Targeting Insulin Resistance?
Does targeting insulin resistance > insulin secretion reduce CV risk?

43
Metabolic Syndrome: Clinical Diagnosis
Presence of any 3 of the following: Abdominal obesity (M > 102 cm, F > 88 cm) TG > 1.7 mM Low HDL (M < 1.0 mM, F < 1.3 mM) BP > 130/85 FPG > 6.1 mM
 TG > 1.7 mM. Low HDL (M < 1.0 mM, F < 1.3 mM) BP > 130/85. FPG > 6.1 mM.")
45
TZDs: effect on Metabolic Syndrome
Reduce insulin resistance/blood sugar Mild decrease in diastolic BP (2-4 mmHg) Decrease PAI-1 (reduces procoagulant state) Lipids: ↓TG ↑HDL (pioglitazone > rosiglitazone?) ↓LDL (pioglitazone) ↑LDL (rosiglitazone) No change in ApoB so ↑ due to larger less atherogenic particle size Decrease in carotid artery intimal-media thickness (IMT)
 Decrease PAI-1 (reduces procoagulant state) Lipids: ↓TG ↑HDL (pioglitazone > rosiglitazone ) ↓LDL (pioglitazone) ↑LDL (rosiglitazone) No change in ApoB so ↑ due to larger less atherogenic particle size. Decrease in carotid artery intimal-media thickness (IMT)")
46
Effect of Pioglitazone on Carotid Arterial Wall Thickness
Intimal-medial thickness (mm) * † * p<0.005 † p<0.001 vs baseline Koshiyama H et al. JCEM 2001;86:3452-6
 * † * p<0.005 † p<0.001 vs baseline. Koshiyama H et al. JCEM 2001;86:")
47
Targeting Insulin Resistance?
Does targeting insulin resistance > insulin secretion reduce CV risk? We don’t know yet! BARI-2D: CV outomes Insulin sparing regimen (avandia, metformin) versus Insulin providing regimen (sulfonylurea, insulin) PPAR, RECORD, PROACTIVE TZD’s, CV outcomes
 versus. Insulin providing regimen (sulfonylurea, insulin) PPAR, RECORD, PROACTIVE. TZD’s, CV outcomes.")
48
Targeting insulin Secretion?
Improve glycemic control in hi-risk patients to reduce CV risk Using novel agents to get there! ACCORD – glycemic cntrl arm HbA1c < 6 % glimepiride, insulin glargine, (and metformin, rosiglitazone) NAVIGATOR – nateglinide ORIGIN, STREAM – insulin glargine DIGAMI II - insulin
 NAVIGATOR – nateglinide. ORIGIN, STREAM – insulin glargine. DIGAMI II - insulin.")
49
DM & Cardiovascular Disease Bottom Line…
Understanding cardiovascular risk in patients with diabetes Glycemic control & CVD: evidence Glycemic control & CVD: best practice

50
DM & Cardiovascular Disease Bottom Line…
Understanding cardiovascular risk in patients with diabetes DM increased risk (< than established CAD?) Risk extends into BS levels below diagnostic threshold for DM ACS: higher BS worse prognosis Glycemic control & CVD: evidence Glycemic control & CVD: best practice
 Risk extends into BS levels below diagnostic threshold for DM. ACS: higher BS worse prognosis. Glycemic control & CVD: evidence. Glycemic control & CVD: best practice.")
51
DM & Cardiovascular Disease Bottom Line…
Understanding cardiovascular risk in patients with diabetes Glycemic control & CVD: evidence Glycemic cntrl alone may reduce CVD (UKPDS, DIGAMI) Glycemic cntrl combined with other risk factor modification reduces CVD (STENO-2) Glycemic control & CVD: best practice
 Glycemic cntrl combined with other risk factor modification reduces CVD (STENO-2) Glycemic control & CVD: best practice.")
52
DM & Cardiovascular Disease Bottom Line…
Understanding cardiovascular risk in patients with diabetes Glycemic control & CVD: evidence Glycemic control & CVD: best practice Patients with CVD: Glycemic target?

53
Patients with CVD: glycemic target
Prevent microvascular complications (HbA1c < 7.0%) Prevent macrovascular complications? CDA 2003 Guidelines: HbA1c < 6.0% (if can be safely done) No definitive evidence yet Choice of DM therapy? Sensitizers > Secretagogues/Insulin No hypoglycemia with sensitizers alone, metformin weight-sparing ACS? CDA 2003 Guidelines: DIGAMI protocol
 Prevent macrovascular complications CDA 2003 Guidelines: HbA1c < 6.0% (if can be safely done) No definitive evidence yet. Choice of DM therapy Sensitizers > Secretagogues/Insulin. No hypoglycemia with sensitizers alone, metformin weight-sparing. ACS CDA 2003 Guidelines: DIGAMI protocol.")
54
END

56
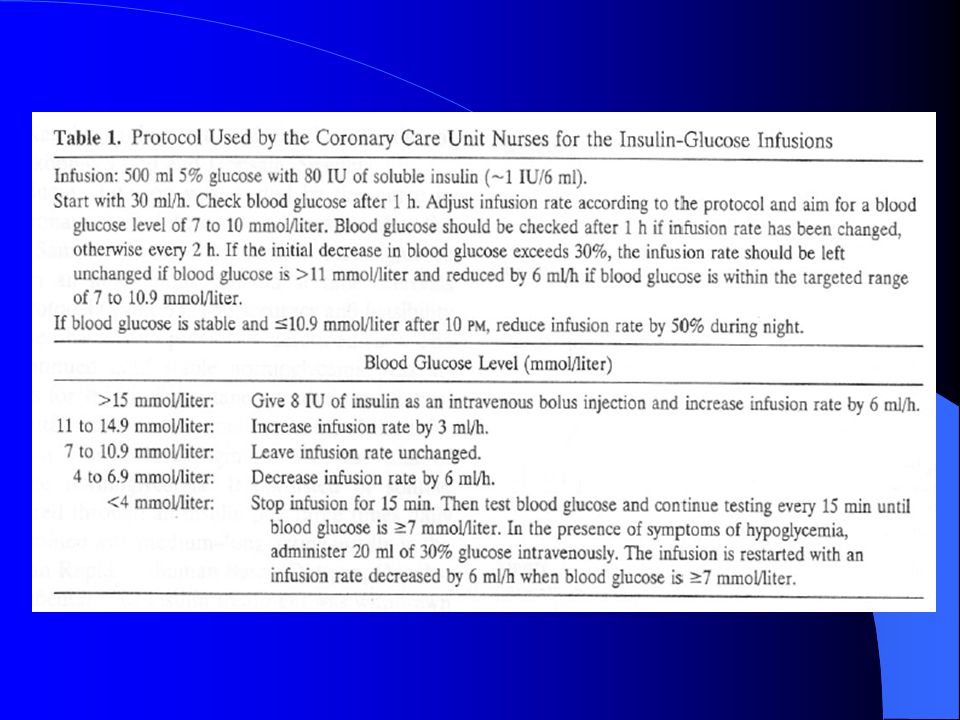
Insulin IV gtt CPG q1h x 2, then q2h:
Adjust Insulin IV infusion rate as per scale below: < Call MD U/h (5cc/h) U/h (10cc/h) U/h (15cc/h) U/h (20cc/h) U/h (25cc/h) U/h (30cc/h) U/h (35cc/h) > Call MD
 U/h (10cc/h) U/h (15cc/h) U/h (20cc/h) U/h (25cc/h) U/h (30cc/h) U/h (35cc/h) > 22.1 Call MD.")
58
TZD Safety: Hepatotoxicity
Troglitazone Rosiglitazone Pioglitazone Toxic to hepatocytes in vitro ? Yes No # of patients pre-marketing 2510 4500 1526 ALT > 3x ULN 1.9% troglitaz. 0.6% placebo 0.17% rosiglitaz. 0.18% placebo 0.26% pioglitaz. 0.25% placebo Post-marketing 45 liver failure 28 death 15 liver Tx 2 liver dysfn (1 case likely shock liver)
")
Similar presentations


>")


