Download presentation
Presentation is loading. Please wait.

1
Before Proposing to Change the Equation, We should Know All the Variables Adam V. Maltese March 14, 2012

2
Outline Introduction Degree production in US Analysis of longitudinal data Student interest data Graphical literacy Participation in U-grad Research Experiences Summary

3
Introduction Focus of recent National policy initiatives (e.g., Educate to Innovate): –Increasing performance in STEM –Increasing size of STEM workforce Ratio of STEM degrees to Total degrees in decline over last 40 yrs Bureau of Labor predicts by 2018 there will be 2 Million job openings in STEM fields as result of baby-boomer retirement & new jobs
: –Increasing performance in STEM –Increasing size of STEM workforce Ratio of STEM degrees to Total degrees in decline over last 40 yrs Bureau of Labor predicts by 2018 there will be 2 Million job openings in STEM fields as result of baby-boomer retirement & new jobs")
4
Bachelor’s Degrees (1966-2006) (Source: NSF, 2008) Degrees Awarded
 (Source: NSF, 2008) Degrees Awarded")
5
Changes in degrees over time You can access these visualizations to create your own here.

6
Changes in degrees over time [BS in Biology 1966-2010]
![Changes in degrees over time [BS in Biology ]](http://images.slideplayer.com/23/6613016/slides/slide_6.jpg "Changes in degrees over time [BS in Biology ]")
7
Changes in degrees over time [Chemistry1966-2010]
![Changes in degrees over time [Chemistry ]](http://images.slideplayer.com/23/6613016/slides/slide_7.jpg "Changes in degrees over time [Chemistry ]")
8
Changes in degrees over time [Bio/Math/CompSci/Engnr: 1966-2010]
![Changes in degrees over time [Bio/Math/CompSci/Engnr: ]](http://images.slideplayer.com/23/6613016/slides/slide_8.jpg "Changes in degrees over time [Bio/Math/CompSci/Engnr: ]")
9
Changes in degrees over time 1966 2010 Biology Math/Stats Computer Science Engineering

10
Analysis of Longitudinal Data

11
Previous Findings (based on NELS data) Indicators of “interest” in STEM (e.g., Career aspirations, Science will be useful in my future, Planned major) positively associated with STEM degree High School Experiences: Emphasis on learning facts/rules (-) Emphasis on understanding through use of hands- on materials in math (+) Emphasis on further study in science (+) Frequent use of books to do experiments (-) Frequent use of computers in math (-) Frequent teacher lectures in science (-)
 Indicators of interest in STEM (e.g., Career aspirations, Science will be useful in my future, Planned major) positively associated with STEM degree High School Experiences: Emphasis on learning facts/rules (-) Emphasis on understanding through use of hands- on materials in math (+) Emphasis on further study in science (+) Frequent use of books to do experiments (-) Frequent use of computers in math (-) Frequent teacher lectures in science (-)")
14
Samples NELS = 4,700 with HS transcripts, completed 20+ college classes & 4-yr Inst. ELS = 6,040 with HS transcripts and indication of declared major HSTS = 37,500 with HS transcripts collected

15
Most Common HS Pathways

16
18%

17
~1% ~3%

18
Analysis of “Switchers” 60% of ss who indicated interest in STEM career in 8 th grade ended up with major outside of STEM fields 20% of ss who indicated interest in Non- STEM career ended up with STEM degree –This group accounted for roughly 80% of total number of STEM degrees What caused these students to switch??

20
MS student interest in science (Maltese & Tai, 2011)
")
22
Student interest in STEM jobs Women Medicine Men Science

23
Impact of standardized testing (Maltese & Hochbein, 2012) Used three cohorts of HS students in IN who participated in state testing and completed the ACT exams (N~ 4500/yr) Tied ACT performance to school performance on state tests in English/Math during each student’s Freshman-Junior year HLM results showed no positive association between school status and student scores
 Used three cohorts of HS students in IN who participated in state testing and completed the ACT exams (N~ 4500/yr) Tied ACT performance to school performance on state tests in English/Math during each student’s Freshman-Junior year HLM results showed no positive association between school status and student scores")
24
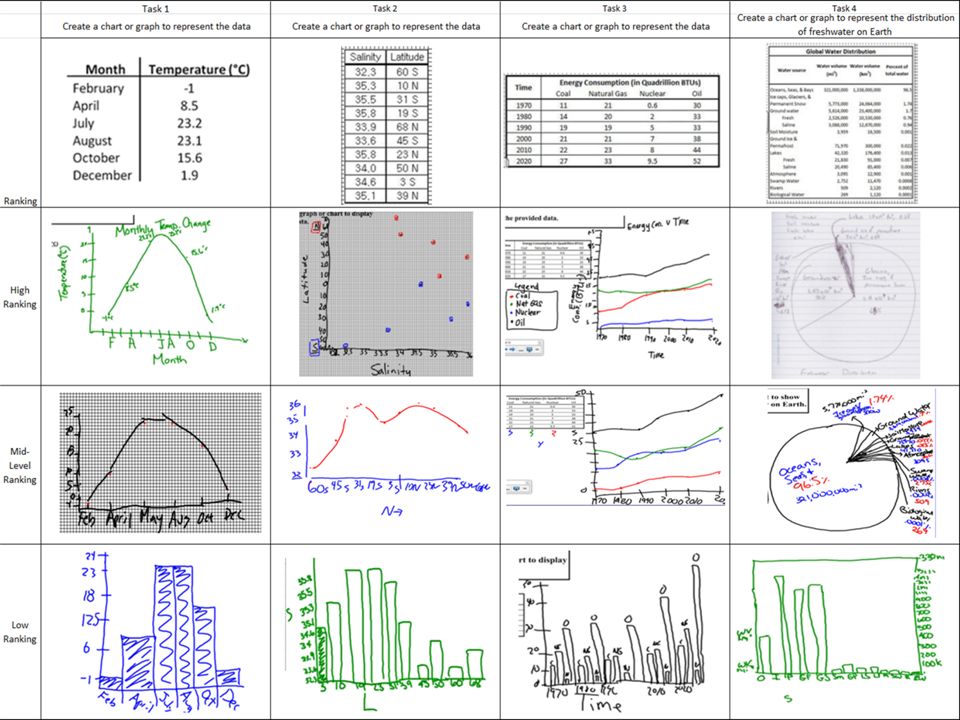
Graphical literacy (Harsh & Maltese, 2012)
")
25
Study Methods Streams of data collected to investigate how students and scientists interpret and construct graphs Stream 1: Graph Interpretation Web-based survey in which participants were asked to read and analyze graphical representations of data Stream 2: Assessment of cognitive processes Eye movement measurements/tracking and think aloud recordings Stream 3: Graph Construction Transformation of provided data into graphical representations

28
Impact of REUs/UREs (Harsh, Maltese & Tai, 2011) (Harsh, Maltese & Tai, Forthcoming)
 (Harsh, Maltese & Tai, Forthcoming)")
29
What are the indicated benefits of participation in UREs? Total Population (n=3014) Item% Exposure to genuine scientific research 49 Built confidence to conduct research 16 Development of basic lab techniques 15 Maintained interest in science 5 Influenced my decision to explore other areas 4 Application of principles learned in class 4 Exposure to graduate students 4 Exposure to research group/meetings discussions 2 Development of presentation skills 1 Exposure to literature 1
 Item% Exposure to genuine scientific research 49 Built confidence to conduct research 16 Development of basic lab techniques 15 Maintained interest in science 5 Influenced my decision to explore other areas 4 Application of principles learned in class 4 Exposure to graduate students 4 Exposure to research group/meetings discussions 2 Development of presentation skills 1 Exposure to literature 1.")
30
Gender Differences in Chemistry and Physics UREs Male and female participation rates have made equivocal percentage-wise gains since the 1940s –During this period, women in chemistry and physics were more likely to participate in these programs than their male counterparts. Similar benefits reported across genders –Female participants were more likely to select gains associated with self- efficacy and maintenance of interest. Female participants reported that URE participation often played a formative role in the pursuit of advanced chemistry and physics degrees at a significantly higher rate than male participants.

31
Multi-site assessment of URE program variables that influence short- and long-term outcomes for students Observational studies on the activities and practices of URE participants in the research setting Design and implementation of a performance based measure as a means to assess the development of students’ skills through URE participation Planned URE Research

32
Synthesis Flat growth in STEM degrees (some decline) Engaging students early appears to be important, seems that many students lose interest in science during early teen years Focus on standardized testing may not be strengthening skills of college bound students College students lack graphical literacy skills expected by science faculty UREs seem to have positive impact, but definition of gains unclear
 Engaging students early appears to be important, seems that many students lose interest in science during early teen years Focus on standardized testing may not be strengthening skills of college bound students College students lack graphical literacy skills expected by science faculty UREs seem to have positive impact, but definition of gains unclear")
Similar presentations


, Pamela Davis-Kean (co-PI), and Oksana Malanchuk University of Michigan.>")


 Class.>")


