Download presentation
Presentation is loading. Please wait.

1
Ameri-can-adians: Demography and Identity of Borderline Canadians and Americans Jack Jedwab and Susan W. Hardwick

2
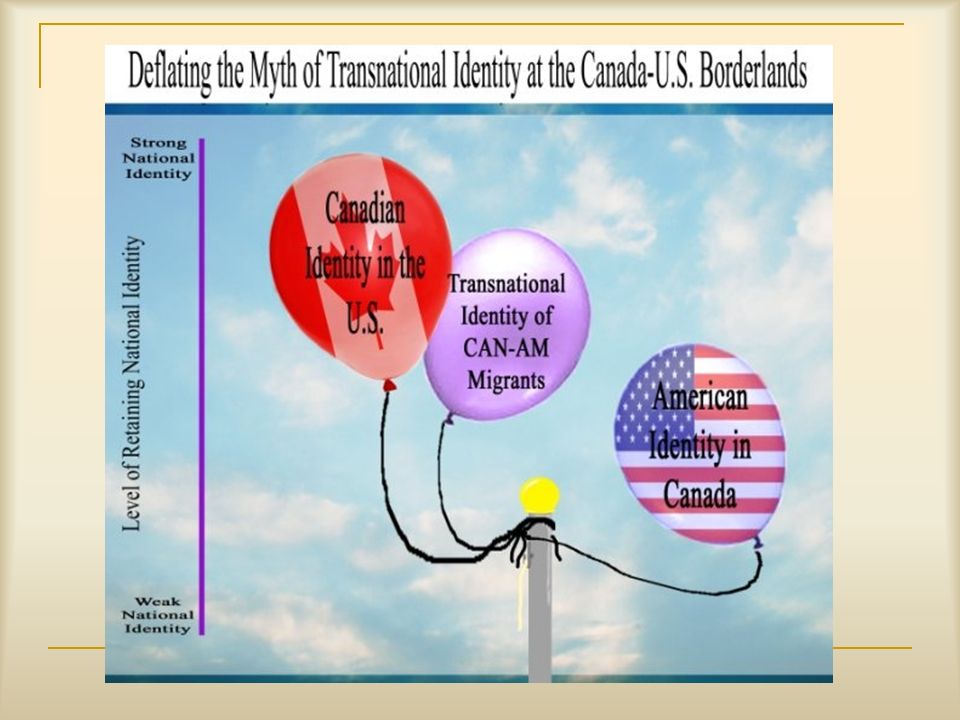
Project goals Expand on the limited research accomplished to date on the spatial patterns and identities of Canadians in the U.S. and Americans in Canada. Learn more about whether Canadians are “melting” into the U.S. melting pot or retaining their distinctive Canadian identities after migration to the U.S. Analyze the level of attachment to Canada of Canadians who reside in the U.S. Compare the (trans?) national identities of Canadians in the U.S. with Americans who permanently reside in Canada.
 national identities of Canadians in the U.S. with Americans who permanently reside in Canada..")
3
Defining “Canadian” and “American” In establishing the number of “Americans” in Canada and “Canadians” in the United States census-takers most commonly use place of birth and ancestry (in the United States) and ethnic origin (in Canada). Those identified by ethnicity and ancestry may be expressing a connection with Canada that may span several generations. So it cannot be assumed that U.S. census respondents who claim a connection to Canada were born there.

4
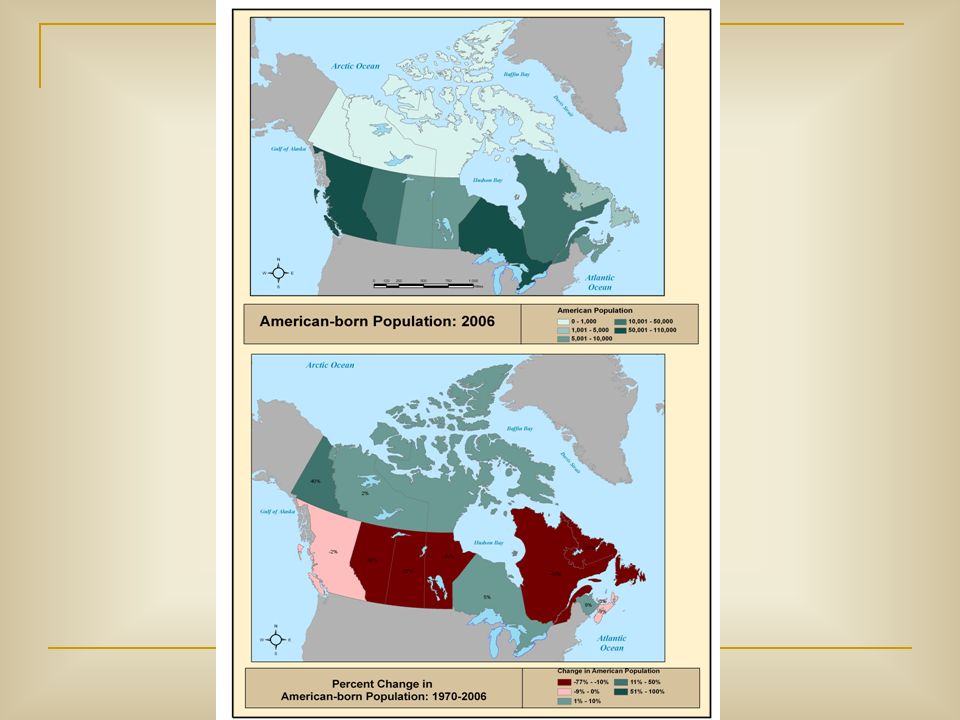
Part I: Demographic analysis of “Americans” in Canada

6
Born in the USA20012006 Canada237920278140 Ontario98190117510 British Columbia5441062320 Alberta2751031805 Quebec2525530725 Nova Scotia80658545 New Brunswick79559 450 Manitoba69057920 Saskatchewan58655 905 Between 2001 and 2006 in Canada, there was nearly a 20% increase in the number of Canadians born in the U.S.

7
Over 10 000 Canadians Born in the United States Total - Immigrant status and period of immigration Immigrants Before 1991 1991 to 2000 1991 to 1995 1996 to 2000 2001 to 2006 Non- permanen t residents Canada2781402505351688404292518770241553877027600 Ontario11751010641068275198308205116251830011105 British Columbia62320565603969086953865483081755760 Toronto46575412802369591103515560084755290 Alberta31805283201878051702265290543703480 Quebec30725265751794045652100246540654150 Vancouver28575247751521549551975298046103800 Montréal20135166701017533501485187031403465 Calgary125351103570352120895122018901500 U.S.-born in Canada between 2001-2006 almost as high as in previous 10 years (with half choosing to reside in Ontario)
")
8
Canadians Born in the USACanadians of American Ethnic origin 2006All 1st generation Canada278 140248 23050 015 Ontario117 51086 06022 310 British Columbia62 32053 64511 455 Alberta31 80551 0656 445 Toronto46 57529 5309 400 Quebec30 72529 2255 025 Vancouver28 57521 2855 280 Calgary12 53517 1652 695 Montréal20 13516 6553 585 Edmonton8 28514 2501 855 Saskatchewan10 500885 Ottawa8 6507 1101 730 Manitoba5 9801 020 Victoria6 6155 8551 325 More Canadians report U.S. as birthplace than report “American ethnic origin”

9
Total Ethnic origin (: American 2006 Total - Generation status 1st generation 2nd generation 3rd generation or more Canada2482355001581250116970 Ontario86060223102906534680 British Columbia53640114551944022745 Alberta5106564451626528360 Toronto2953094001007010055 Quebec292205025809016105 Vancouver21285528075508455 Calgary17165269054808990 Montréal16655358548458225 Edmonton14250185545557845 Saskatchewan1050588531306485 Ottawa - Gatineau7105173022453130 Manitoba5975102520152935 Victoria5855132021102420 Hamilton5390126518502275 New Brunswick4790130513002185 Nova Scotia4645111511852350 Nearly half of all “Ethnic Americans” in Canada are third generation or more

10
Ethnic Origin: American NB Chinese 580 South Asian 805 Korean 145 Japanese 500 Total - Generatio n Status 1st Generatio n - subtotal above the age of 15 years 1st Generati on 1.5 Generati on 2nd Generation - subtotal above the age of 15 years 2nd Generati on 2.5 Generation 3rd + Generation Total Population 316405387102801010700880702999558075116985 Visible minority219305930441015204440206023802670 Black14195297522557153365135520052350 Filipino1685880750130100703510 Latin American 202012159103101451252015 Southeast Asian 22510020804535010 Arab11530201020 00 Not a visible minority 28662532370233559020821502758054570110715 Aboriginal self-reporting 7850410245165148535511303600 Visible Minorities represent increasing percentage of recent “Americans” defined by ethnic origin

11
Born in the United States of America and Emigrated to Canada Immigrants Before 1991 1991 to 1995 1996 to 2000 2001 to 2006 Total - Population by visible minority groups 250 540168 84018 77024 15538 770 Visible minority population 28 190 (11%)8 150 (5%)3 130 (16%)5 950 (25%)10 960 (28%) Not a visible minority 222 350160 69515 64518 20027 810 South Asian5 5255953801 5403 015 Black7 7453 1458351 2152 555 Chinese4 8251 4056101 3251 485 Latin American3 4551 3555303801 195 Arab1510210160285850 Visible Minorities represent increasing percentage of American-Born Canadians
8 150 (5%)3 130 (16%)5 950 (25%) (28%) Not a visible minority South Asian Black Chinese Latin American Arab Visible Minorities represent increasing percentage of American-Born Canadians")
12
2006 15 years of age and over Canada Total PopulationU.S.-born in CanadaAmerican Ethnic Identification Bachelor’s Degree or Better 18.536.525.0 Unemployment Rate6.65.15.9 Management Occupations 9.512.511.0 Average employment income 51 22163 898 58786 Median employment income 41 40148 336 45 310 Prevalence of low income after tax in 2005 for economic family members 8.68.7%6.9% Canada’s U.S.-born more educated than American origin (and also are “less rooted” or “more rooted” in groups with similar SES)
")
13
2006Citizenship Acquisition of Americans Born in Canada United States of America Canada Immigrants Before 1991 1991 to 1995 1996 to 2000 2001 to 2006 Total - Citizenship 250 535168 84518 77024 15538 770 Canadian citizens 140 710109 17010 69013 7857 060 Canadian citizens only 106 02582 1357 73010 1805 985 Citizens of Canada and at least one other country 34 68527 0352 9653 6051 080 Not Canadian citizens 109 82559 6708 07510 37031 705

14
Ethnic Diversity Survey 2002 American Ancestry Belong to Canada 1st generation - Born outside Canada2 nd Generation 3 rd Generation or more 1 - not strong at all8,0%3,7%4,4% 22,1%6,7% 324,0%11,6%6,7% 430,0%15,3%8,9% 5 - very strong34,0%65,1%68,9% Ancestral American belonging to Canada grows with generation

15
Ethnic Diversity Survey 2002 American Ancestry Belong to North America 1st generation - Born outside Canada2 nd Generation 3 rd Generation or more 1 - not strong at all4,0%5,8%6,7% 24,0%6,3%8,9% 310,0%15,3%22,2% 418,0% 11,1% 5 - very strong60,0%51,3%46,7% American Ancestry Belonging to North American declines with Generation

16
Ancestry American 4 and 5 on a 5 point scale with 5 meaning strong sense of belonging Ethnic Diversity Survey 2002 Belong to CanadaBelong to North America First Generation64.078.0 Second Generation80.469.3 Third Generation or more77.857.8 First to third generation “Canadian” vs. “North American” identity

17
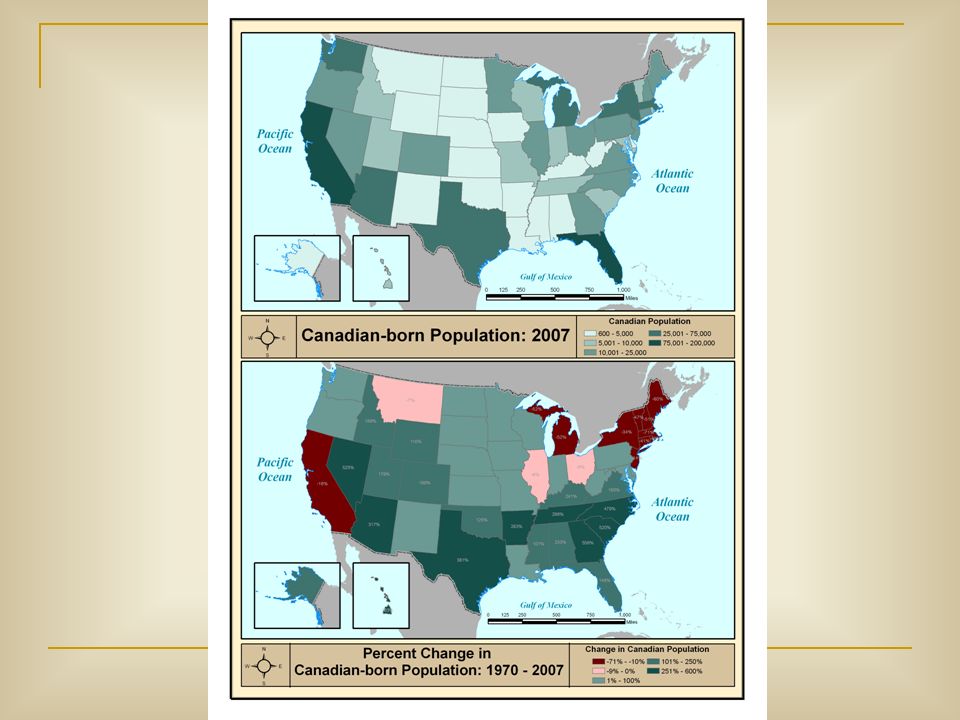
Part II: Demographic analysis of “Canadians” in the U.S.

18
Contemporary Trends

20
Canadians who moved to the United States 000’s 1900-1909123 1910-1919708 1920-1929949 1930-1939163 1940-1949161 1950-1959353 1960-1969433 1970-1979179 1980-1989156 1990-1999195 2000-2009212 Number of Canadians migrating to the U.S. higher in first decade of 21 st C. than at any time since the 1960s

21
Number of persons born in Canada admitted to the United States as permanent residents Persons obtaining legal permanent resident status by region and selected country of last residence 200916 14022 508 200815 10922 366 200715 49520 324 200618 20723 913 200521 87829 930 200415 56922 439 200311 35016 447 200219 35227 142 200121 75229 991 200016 05721 289 Total170 909212 436 Recession does not deter Canadian migration to the United States

22
United States Born in CanadaFrench Canadian Ancestry Canadian Ancestry Total834 4782 167 536721 154 Native Born ------------------ 2 073 004496 668 Foreign Born834 47894 532224 486 Entered 2000 or later 165 00016 00056 000 Entered 1990 to 1999 175 00016 25056 250 “Canadian ancestry” exceeds “Canadian-born” feelings of attachment to Canada (and is also stronger than attachment to the U.S. of American migrants in Canada)
.")
23
United StatesBorn in CanadaFrench Canadian Ancestry Canadian Ancestry Foreign Born834 47894 532224 486 Naturalized US Citizen 373 05745 97581 009 Not a US Citizen461 42148 557143 477 Higher percentage of Foreign Born who report French-Canadian Ancestry are naturalized than those who report Canadian Ancestry and Canadian-Born

24
2006 (25 years of age and over) United States-Entire Population Canadian Born Living in the United States French Canadian Ancestry Canadian Ancestry Bachelor’s Degree/Graduate and Professional Degree 27.439.828.334.9 Management, Professional and Related Occupations 34.555.734.746.6 Median Household Income 52 17564 20960 84962 148 Median Family Income 63 21185 29773 44177 957 Per Capita Income27 46648 67132 05036 526 Mean Earnings for Full-Time, Year Round workers (Male) 62 163102 20268 32884 366 Median Earnings for Full-Time, Year Round workers (Male) 45 42572 84152 93460 202 Poverty Rates-All Families 9.65.0 5.5 Canadian-born in U.S. do better on most indicators of SES than “ancestrally Canadian”

25
Conclusions, reflections, future research directions… - Defining and locating often invisible subgroups of Can- Am migrants (Canadian-born? U.S.-born? Canadian or American ancestry? Canadian-by- choice?). - Comparative immigrant residential geographies at the neighborhood level in Canada and the U.S. - Unraveling national/transnational identities at the borderland… ‘
. - Comparative immigrant residential geographies at the neighborhood level in Canada and the U.S. - Unraveling national/transnational identities at the borderland… ‘.")
27
So where do we go from here? - Spatial patterns (and related social, economic, and environmental processes) of Canadians in the U.S. need further analysis. - Comparative studies of Canadians in the U.S. and Americans in Canada are also long overdue. - In particular, a critical need remains for an in- depth analyses of the (trans)national identities and attachments of Can-Am migrants now and in the years to come.
 of Canadians in the U.S. need further analysis. - Comparative studies of Canadians in the U.S. and Americans in Canada are also long overdue. - In particular, a critical need remains for an in- depth analyses of the (trans)national identities and attachments of Can-Am migrants now and in the years to come..")
Similar presentations


>")


”>")


