Download presentation
Presentation is loading. Please wait.

1
Arizona Outlook GFOAz Conference February 19, 2009

2
Economic Outlook 2009-2010 US Recession Watch Arizona Jobs Arizona People Arizona Housing Outlook Summary

3
US RECESSION WATCH How long in duration? How severe in depth?

4
Is This a Repeat of the GREAT DEPRESSION? Feb. 1930 Andrew Mellon Secretary of the Treasury for Herbert Hoover "There is nothing in the situation to be disturbed about."

5
19301931193219331934 -8.6%-6.4%-13.0%-1.3%+10.8% In the Great Depression real GDP declined for 4 years & 27% Another Great Depression?

6
2008 Q32008 Q42009 Q12009 Q22009 Q3 -0.5%-3.8%-4.9%-1.5%+0.8% In the current downturn real GDP is expected to fall for 4 quarters & 2-3% Blue Chip Consensus Another Great Depression?

7
GDP Recovery in 2nd Half? 20082009 Percent Change in Real GDP at Annual Rate Blue Chip Consensus

8
Survey of Leading Economists 90% say recession will end by Q4 2009 93% say unemployment will peak in 2010 Blue Chip Economic Indicators, February 2009 Blue Chip Consensus _ _ _ 50 Top Economists

9
Longest Since The Depression Post-War Recessions Months Average: 10 Previous Post-War Recessions10 mos. Longest (1973-1975 & 1981-1982)16 mos. Current Recession (Duration since 12/07)14 mos. Current Recession Forecast (12/07 – 12/09)24 mos. The Great Depression (1929-1933)43 mos. Historical data: National Bureau of Economic Research
16 mos. Current Recession (Duration since 12/07)14 mos. Current Recession Forecast (12/07 – 12/09)24 mos. The Great Depression ( )43 mos. Historical data: National Bureau of Economic Research.")
10
GDP Growth in Q4 2008 ComponentsQ3 08Q4 08 Consumption -3.8% -3.5% Exports 3.0% -19.7% Residential Building -16.0%-23.6% Non-Residential Building 9.7% -1.8% Change in Real GDP -0.5% -3.8% U.S. Bureau of Economic Analysis, January Report

11
Percent Growth In Consumer Spending at Annual Rate U. S. Consumer Spending Negative Again in Q 4 20082007 First negative quarter since 1991

12
Consumer confidence sinks

13
Auto sales worst in 26 years

15
Neighborhood Banks Doomed to Fail? 1930: 744 Bank Failures1930: Failures 2008: 25 Bank Failures2008: Failures

16
8,500 Banks 171 on “Watch List” Problem banks: What you need to know The FDIC is keeping close tabs on 171 banks

18
Job Growth/Loss, Thousands 12 Months of U.S. Job Loss 2 million jobs lost

19
Monthly Percent Change vs Year Ago Arizona Job Losses in 2008 Worst since -4.6% June 1975

20
12 Months Into Recession Arizona Weaker Than US Non-Farm Job Loss After 12 Months% Loss Average 10 Post-War Recessions-2.0% U.S. in Current Recession-2.0% Arizona (Dec./Dec.)-4.3% Wyoming (Dec./Dec.)+2.2%
-4.3% Wyoming (Dec./Dec.)+2.2%.")
21
Arizona & US Move Together (Employment Year/Year Percent Change 1970 - 2008) Arizona USA You are here
 Arizona USA You are here")
22
Five Recessions Since 1970 Arizona Follows U.S. Energy Stagflation Fed Policy S & Ls Energy Leverage Tech Bubble Energy Housing Leverage

23
200820092010 Real GDP Growth1.3%-2.0% 2.0% Employment Growth-0.2%-2.5%0.0% Inflation (CPI)3.8%-1.0%1.8% Housing Starts (000)900660900 US Economic Forecast W. P. Carey School of Business, ASU

24
(Percent Change Dec. 2008 vs Dec. 2007) 2 48 49 1 27 5 6 U. S. Bureau of Labor Statistics 16 14 41 36 13 4 36 Red: 42 States Losing Jobs Arizona Ranks Near Last in Rate of Job Creation 8 20 Green = Growth 7

25
116,500 Arizona Jobs Lost Sector Dec 08 vs Dec 07 Overall -116,500 Health Care +9,400 Arts, Entertainment +1,200 Government (Fed/Local) +3,600 Employment Services -10,800 Retail Trade -25,200 Food Service -11,200 Construction -43,800
 +3,600 Employment Services -10,800 Retail Trade -25,200 Food Service -11,200 Construction -43,800")
27
Less Harmed by Recession Food, guns, alcohol Online commerce Repair & maintenance “Down market” retail Health care & related

28
Hit Hardest by Recession Discretionary & postponable Temporary worker agencies Retail outlets, restaurants Auto dealers, appliances Finance & insurance Construction, home stores

29
Thousands of Jobs 80,000 Arizona Construction Jobs Lost Since Summer of 2006 2005200720062008

30
Arizona Unemployment Rates in Recession 1976 10.3% 1982 11.5% 1992 7.5% 2008 6.9% (Dec) Unemployment at 7%?
 Unemployment at 7%")
31
1 7 2 3 5 4 6 US Census Bureau 18 17 8 11 14 9 Arizona 2 nd in Population Arizona 2 nd in Population Growth Among All States Percent Change 2008 vs 2007 10 12 16 36

32
14 th Largest State 2 nd Fastest Growth Rate 5 th in New Resident Count 3 rd in Domestic Migration Count 9 th in International Migration Count Arizona Population Rank 2008

33
Population in 2030 Population 10.7 Million 2 nd Largest State in West 10 th Largest State in US Median Age 39.3 Yrs More Children than Seniors U. S. Census Bureau

34
Every time the Arizona population increases by 2.5 people, a new housing unit is needed. Every time the Arizona population increases by 2.5 people, a new housing unit is needed.

35
AZ Housing Slump Continues Single Family Q3 ‘07 Permits - 30% Resales - 31% Prices (Phx) - 4.1% Source: National Assoc Realtors; US Census Single Family 2008 Permits - 53% Resales +10% Resale Price -26% Source: US Census, National Assoc. Realtors

36
10 Months Supply of Housing for Sale in US Market Months Supply

37
(Percent Change Dec. 2008 vs Dec. 2007) U. S. Bureau of Labor Statistics Red: Loss of 10% or More 3 States Add Construction Jobs Green = Growth

38
Population growth Population growth Employment growth Employment growth Mortgage rates Mortgage rates Mortgage standards Mortgage standards Move-up buyers Move-up buyers Investors Investors Housing Market Drivers

40
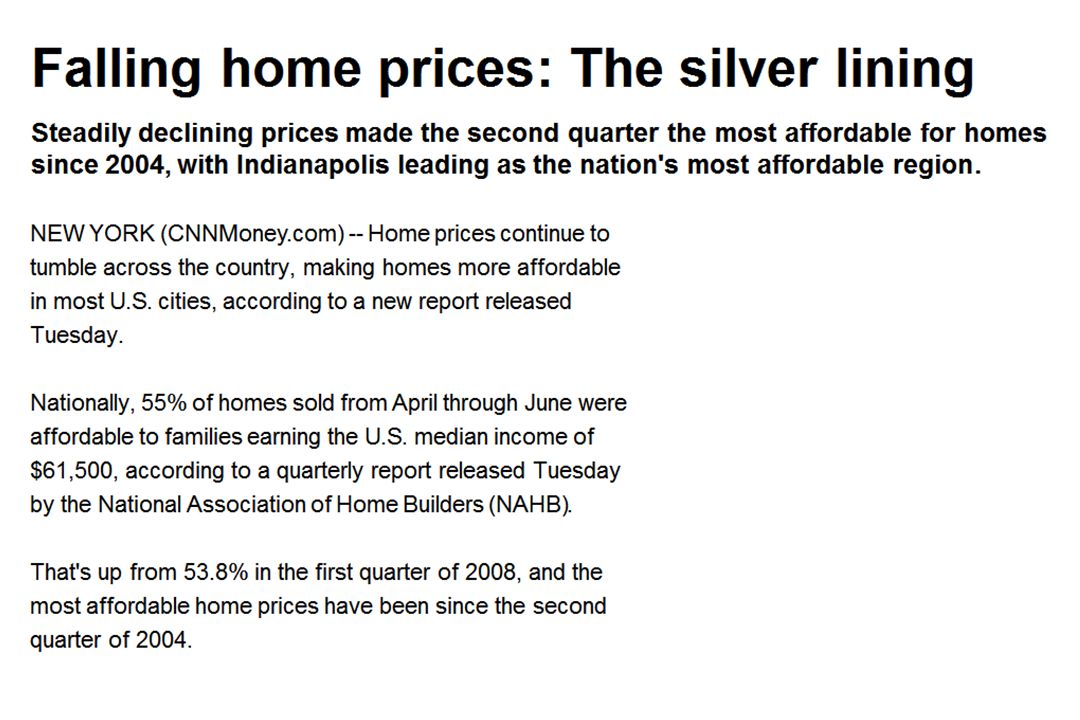
Affordability Rebounds Share of Phoenix home sales affordable at median income Phoenix Affordability National Association of Home Builders, 2008 Q3

41
Metro Phoenix Construction Single family Permits Greater Phoenix Blue Chip Forecast, 2008 Q4

42
Economic Outlook, University of Arizona, December 2008 Metro Tucson Construction Single Family Permits

43
Arizona Public Service ASU AZ Dept. Commerce Davidson Fixed Income Econ-LincEconLit Elliott Pollack Co. JLBC Maguire Co. Northern Arizona Univ. Salt River Project Stellar Capital S’west Growth Partners Univ. of Arizona VisionEcon Wells Fargo Blue Chip Forecast Panel Blue Chip Forecast Panel

44
200820092010 Annual Percent Change Personal Income3.52.54.0 Employment-1.6-0.91.8 Single Family Units-53-3.713.2 Retail Sales-5.00.23.7 Population2.31.82.0 ARIZONA BLUE CHIP ECONOMIC FORECAST

45
Arizona Employment: No Job Growth Until 2010 Annual Numeric Change In Arizona Employment

46
Annual Percent Change In Arizona Employment Arizona Employment: No Job Growth Until 2010

47
Annual CY Percent Change Source: Arizona Blue Chip Forecast Forecast Arizona Retail Sales: Recession Level Growth

48
Source: US Bureau of Labor Statistics and AZ Dept of Commerce CategoryCY2006CY2008 Building Supplies +9.2 -10.8 Apparel +8.4 -8.3 Furniture +8.4 -10.3 Restaurant/Bar+10.3 -3.5 Motor Vehicles +2.8 -28.3 Arizona Retail Sales Decline Percent Change Vs Previous Year Source: Arizona Department of Revenue, collections

49
Stagnant economy 2009 Stagnant economy 2009 No job growth until 2010 No job growth until 2010 Unemployment goes up Unemployment goes up Population growth is critical Population growth is critical Wait for US economic recovery Wait for US economic recovery Arizona Outlook Summary

50
Resale prices fall next 9 mos. Resale prices fall next 9 mos. New starts, resales up end 2009 New starts, resales up end 2009 Tighter lending standards Tighter lending standards Non residential building stops Non residential building stops Watch population growth Watch population growth Construction Outlook Summary

51
Anatomy of Recovery National economy rebounds Population growth improves Home prices stabilize Housing inventory falls Job creation increases Unemployment declines General confidence restored

52
Worse economic news ahead Worse economic news ahead Housing must bottom out Housing must bottom out Recovery late 2009? Recovery late 2009? Unemployment at 8%? 10%? Unemployment at 8%? 10%? Stimulus plan to boost growth Stimulus plan to boost growth National Outlook Summary National Outlook Summary

53
Economic Policy Options 1. Monetary policy (credit & interest rates) Lenders must lend, borrowers must borrow Works with a lag, no direct job impacts 2. Tax Cuts (give rebates & reduce rates) Smaller impact but rate cuts keep on working Rebates saved or pay off debt, one time impact 3. Spending on Infrastructure, state aid Takes time to implement, larger multiplier Job impacts end when projects end But infrastructure may support growth
 Lenders must lend, borrowers must borrow Works with a lag, no direct job impacts 2. Tax Cuts (give rebates & reduce rates) Smaller impact but rate cuts keep on working Rebates saved or pay off debt, one time impact 3. Spending on Infrastructure, state aid Takes time to implement, larger multiplier Job impacts end when projects end But infrastructure may support growth.")
54
Stimulus Plan: A HybridComponent20092010 To 2019 Total Tax Cuts/Aid$116$245 $28$389 Infrastructure $29 $83$142$254 State/Local Gov $40 $72 $32$144 Total$185$400$202$787 $787 Billion Program 2009 - 2019 http://www.cbo.gov/ftpdocs/99xx/doc9989/hr1conference.pdf

55
http://knowledge.wpcarey.asu.edu Lee.mcpheters@asu.edu

Similar presentations


 = $11,814.9B (5.5%) Q2: GDP = $2,914.38.>")


