Download presentation
Presentation is loading. Please wait.

1
RBA Results-Based Accountability The Fiscal Policy Studies Institute www.raguide.org www.resultsaccountability.com Book - DVD Orders amazon.com resultsleadership.org TM

2
SIMPLE COMMON SENSE PLAIN LANGUAGE MINIMUM PAPER USEFUL

3
Results Based Accountability is made up of two parts: Performance Accountability about the well-being of CUSTOMER POPULATIONS For Programs – Agencies – and Service Systems Population Accountability about the well-being of WHOLE POPULATIONS For Communities – Cities – Counties – States - Nations

4
COMMON LANGUAGE

5
THE LANGUAGE TRAP Too many terms. Too few definitions. Too little discipline Benchmark Target IndicatorGoal Result Objective Outcome Measure Modifiers Measurable Core Urgent Qualitative Priority Programmatic Targeted Performance Incremental Strategic Systemic Lewis Carroll Center for Language Disorders Measurable urgent systemic indicators Core qualitative strategic objectives Your made up jargon here

6
DEFINITIONS Children born healthy, Children ready for school, Safe communities, Clean Environment, Prosperous Economy Rate of low-birthweight babies, Percent ready at K entry crime rate, air quality index, unemployment rate How much did we do? How well did we do it? Is anyone better off? RESULT or OUTCOME INDICATOR or BENCHMARK PERFORMANCE MEASURE A condition of well-being for children, adults, families or communities. A measure which helps quantify the achievement of a result. A measure of how well a service, agency or service system is working. Three types: Population Performance Children born healthy Rate of low-birthweight babiesPercent ready at K entry (EDI) Children ready for school crime rate Safe communities air quality index Clean Environment unemployment rate Prosperous Economy INDICATOR RESULT PERFORMANCE MEASURE Population Performance = Customer Results 1. 2. 3.
 Children ready for school crime rate Safe communities air quality index Clean Environment unemployment rate Prosperous Economy INDICATOR RESULT PERFORMANCE MEASURE Population Performance = Customer Results")
7
POPULATION ACCOUNTABILITY

8
Community Outcomes for Christchurch, NZ ● A Safe City ● A City of Inclusive and Diverse Communities ● A City of People who Value and Protect the Natural Environment ● A Well-Governed City ● A Prosperous City ● A Healthy City ● A City for Recreation, Fun and Creativity ● A City of Lifelong Learning ● An Attractive and Well-Designed City

9
Georgia Policy Council for Children and Families RESULTS ● Healthy Children ● Children Ready for School ● Children Succeeding in School ● Strong Families ● Self Sufficient Families

10
City of London Ontario Priority Results ● A Strong Economy ● A Vibrant Diverse Community ● A Green and Growing City ● A Reliable Infrastructure ● A Safe City Source: Draft Strategic Plan Sept 2011

11
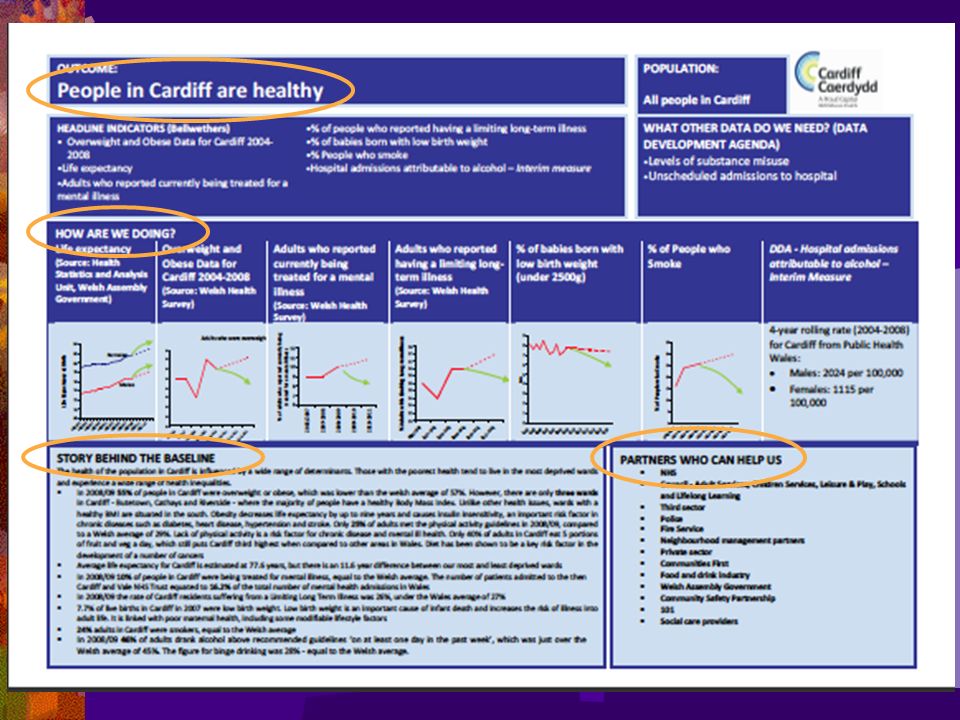
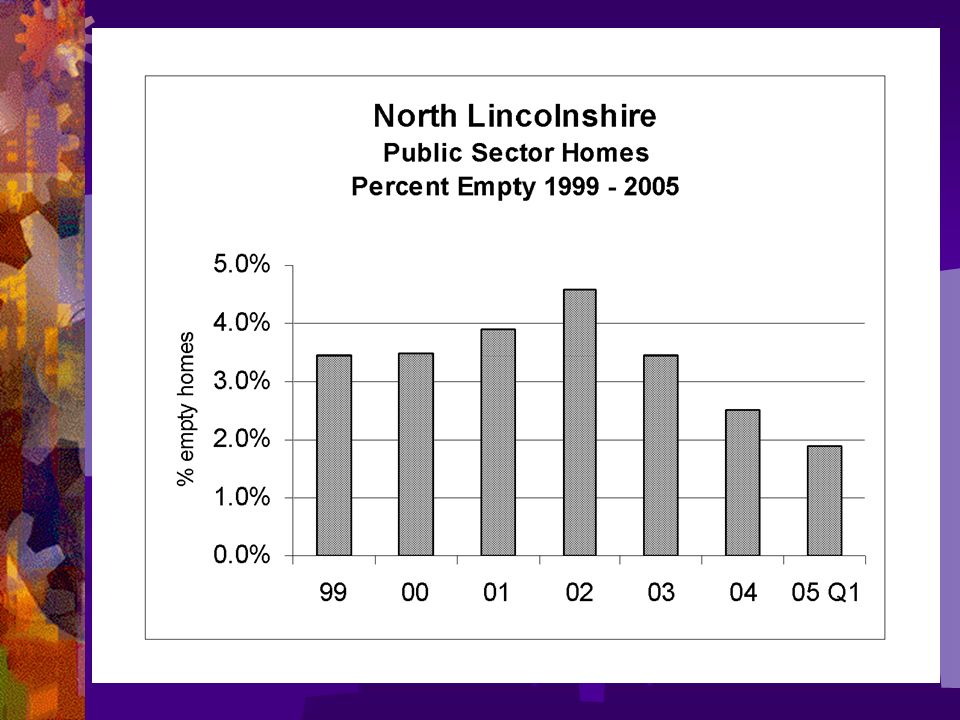
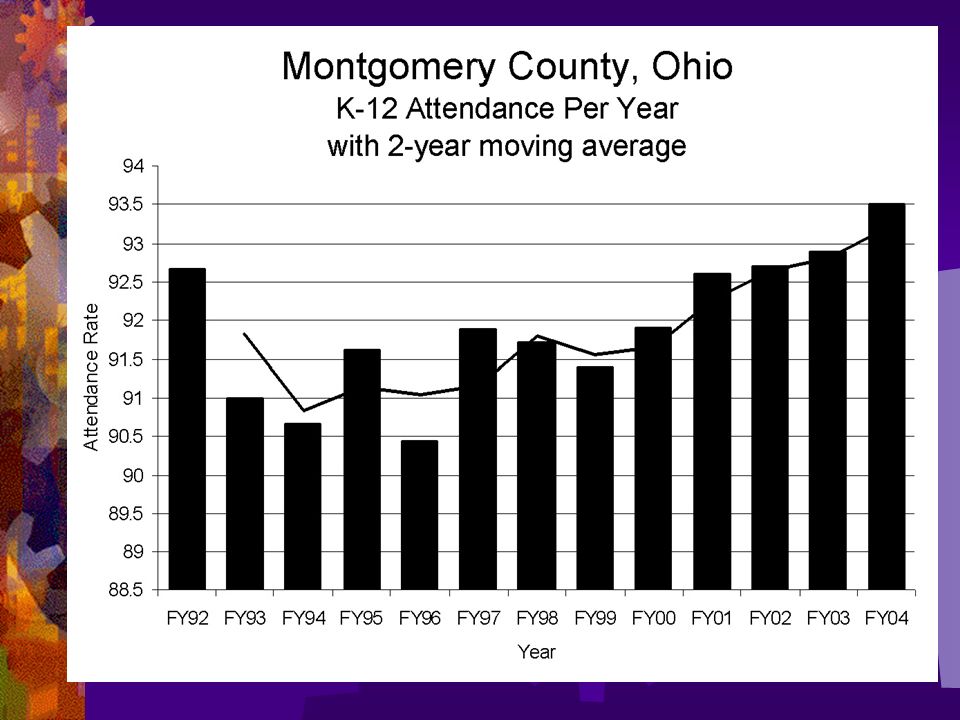
Santa Cruz County REPORT CARDS Cardiff, Wales New Zealand Dayton, OH

14
Leaking Roof (Results thinking in everyday life) Experience Measure Story behind the baseline (causes) Partners What Works Action Plan Inches of Water BASELINE ? Fixed Not OK Turning the Curve Action Plan #2

15
Results / Outcomes Indicators Baseline & Story Experience

16
45 people per day 75 people per day 2010 28 people per day MADD

18
Source: Connexions Tyne and Wear, UK Newcastle, UK Revised 9 Nov 2007 Nov 08 – Jan 09 8.5 Chancellor Sharp reference to 18 to 21 yr olds

20
Hull, UK "Woundings"

21
PERFORMANCE ACCOUNTABILITY

22
“All performance measures that have ever existed for any program in the history of the universe involve answering two sets of interlocking questions.”

23
How Much did we do? ( # ) How Well did we do it? ( % ) Quantity Quality Performance Measures
 How Well did we do it ( % ) Quantity Quality Performance Measures")
24
Effort How hard did we try? Effect Is anyone better off? Performance Measures

25
Effort Effect How Much How Well Performance Measures

26
How much service did we deliver? Performance Measures How well did we deliver it? How much change / effect did we produce? What quality of change / effect did we produce? Quantity Quality Effect Effort Output Input

27
How much did we do? Performance Measures How well did we do it? Is anyone better off? Quantity Quality Effect Effort # %

28
How much did we do? Education How well did we do it? Is anyone better off? Quantity Quality Effect Effort Number of students Student-teacher ratio Number of high school graduates Percent of high school graduates

29
How much did we do? Education How well did we do it? Is anyone better off? Quantity Quality Effect Effort Number of students Student-teacher ratio Percent of 9 th graders who graduate on time and enter college or employment after graduation Number of 9 th graders who graduate on time and enter college or employment after graduation

30
How much did we do? Drug/Alcohol Treatment Program How well did we do it? Is anyone better off? Number of persons treated Unit cost of treatment Number of clients off of alcohol & drugs - at exit - 12 months after exit Percent of clients off of alcohol & drugs - at exit - 12 months after exit

31
How much did we do? Waste Management Services How well did we do it? Is anyone better off? Quantity Quality Effect Effort # tonnes of residential waste Unit cost per tonne collected % to land fill % diverted from landfill #/amt to land fill #/amt diverted from landfill

32
How much did we do? Fire Department How well did we do it? Is anyone better off? Number of responses Response Time Quantity Quality Effect Effort # of fires kept to room of origin % of fires kept to room of origin

33
How much did we do? General Motors How well did we do it? Is anyone better off? # of production hrs # tons of steel Employees per vehicle produced # of cars sold $ Amount of Profit $ Car value after 2 years Quantity Quality Effect Effort Source: USA Today 9/28/98 % Market share Profit per share % Car value after 2 years

34
How much did we do? Not All Performance Measures Are Created Equal How well did we do it? Is anyone better off? Least Important Quantity Quality Effect Effort Most Important Least Most Also Very Important Quality

35
LR UR Primary v. Secondary Direct v. Indirect Internal v. External Baseline & Story

40
Watermain Breaks per year London Ontario

41
How Population & Performance Accountability FIT TOGETHER

42
Contribution relationship THE LINKAGE Between POPULATION and PERFORMANCE POPULATION ACCOUNTABILITY Healthy People Rate of low birth-weight babies Clean Environment Percent fully ready per K-entry assessment Prosperous Economy Rate of unemployment CUSTOMER RESULTS # persons receiving training Unit cost per person trained # who get jobs & keep jobs (at 6 months) % who get jobs & keep jobs (at 6 months) PERFORMANCE ACCOUNTABILITY POPULATION RESULTS Job Training Program
 % who get jobs & keep jobs (at 6 months) PERFORMANCE ACCOUNTABILITY POPULATION RESULTS Job Training Program")
43
CLOSING

45
3 - kinds of performance measures. How much did we do? How well did we do it? Is anyone better off? RBA in a Nutshell 2 – 3 - 7 2 - kinds of accountability Population accountability Performance accountability 7 - questions from ends to means in less than an hour. plus language discipline Results & Indicators Performance measures Baselines & Turning the Curve

46
Resources Book - DVD Orders amazon.com resultsleadership.org www.raguide.org www.resultsaccountability.com RBA Facebook Group RBA Booth: Results Leadership Group: Phil Lee and Karen Finn

47
THANK YOU ! Websites raguide.org resultsaccountability.com Book - DVD Orders amazon.com resultsleadership.org

48
- Rosell “If I include you, you will be my partner. If I exclude you, you will be my judge.”

Similar presentations
 The Fiscal Policy Studies Institute Websites raguide.org resultsaccountability.com Books & DVDs amazon.com resultsleadership.org.>")


 The Fiscal Policy Studies Institute Websites raguide.org resultsaccountability.com Book - DVD Orders amazon.com resultsleadership.org.>")


 The Fiscal Policy Studies Institute www.raguide.org www.resultsaccountability.com Coreassets.com Book - DVD Orders amazon.com.>")


