Download presentation
Presentation is loading. Please wait.

1
Diabetes is emerging as the dominant healthcare epidemic Source: Diabetes Atlas 3rd Edition. www.eatlas.idf.org. Last accessed 25 January 2007

2
The Tale of Two Epidemics SA prevalence Diabetes = 5.5% Direct cause of death = 4.3% Contributory to 14% IHD, 12% hypertensive, 12% renal + 10% stroke deaths Glycemic Control: 37% of patients have HbA levels < 7.0% Metabolic Control: 20% achieve HbA + BP + Lipid targets AIDS RELATED DEATHS 1990 - 2009 (UNAIDS 2010) (SAMJ 2007)
 (SAMJ 2007)")
3
HIV vs DM in SA Absolute No (m) Mortality Rank Mortality Growth Rate ARV vs OHA/Ins (%) VL vs HbA control (%) Medication vintage Advocacy 1 Advocacy 2 6 vs 4 1 vs 6 1 vs 3 37 vs 66 90 vs 30 2010 vs 1947 TAC vs SA Diabetes Guidelines HIV vs DM
 Mortality Rank Mortality Growth Rate ARV vs OHA/Ins (%) VL vs HbA control (%) Medication vintage Advocacy 1 Advocacy 2 6 vs 4 1 vs 6 1 vs 3 37 vs vs vs 1947 TAC vs SA Diabetes Guidelines HIV vs DM")
4
Cost of DM Care US 2006: $1 in $7 / $ 200 billion OPD: 15% / consultations / laboratory / medications In-Patients: 85% / complications / investigations / procedures / medications

5
Poor Glucose Control in SA Many patients Many undiagnosed Few health personnel Poorly skilled personnel Poorly resourced clinics Reduced patient contact time (40 min per year) Poor uptake / application of lab testing (30 % have regular tests) Delay in treatment change / up-titration Sub-optimal medication
 Poor uptake / application of lab testing (30 % have regular tests) Delay in treatment change / up-titration Sub-optimal medication")
6
Diabetes “Re-thinking the Failure”

7
Defining Mental Retardation “ achieve no result, persist in doing the same and expect and different outcome” (Albert Einstein)
")
8
UKPDS 35: Higher HbA 1c is associated with increased micro- and macrovascular complications in T2DM Each 1% rise in mean HbA 1c was associated with –21% risk increase for any diabetes endpoint (p<0.0001) –21% risk increase for diabetes-related mortality (p<0.0001) –14% risk increase for myocardial infarction (MI) (p<0.0001) –37% risk increase for microvascular complications (p<0.0001) Stratton IM, et al. BMJ 2000;321:405–12 Any diabetes endpoint Diabetes-related morbidity MI <6% 6 7% 7 8% 8 9% 9 10% ≥10% 140 120 100 80 60 40 20 0 Mean HbA 1c concentration (%) Adjusted event rate / 1,000 person years Microvascular complications
 Adjusted event rate / 1,000 person years Microvascular complications.")
10
Diagnosis – Fasting Glucose Insulin Resistance Pre-Diabetes Diabetes > 5.6 mmol/l > 6.0 mmol/l > 7.0 mmol/l

11
T2 DM and Primary Prevention Parameter Weight Loss Exercise Success Rate < 5 %

12
ADA CONCENSUS 2007 TREAT PRE-DIABETES (IFG / IGT ) LIFESTYLELIFESTYLE + METFORMIN Age < 60 y Risk Factors (BP, Lipids, BMI) HbAic > 6 % Type 2 Diabetes and Primary Prevention Cost Analysis DPP 10 y FU: Lifestyle vs Metformin:: +$1500 vs -$30 [ADA 71 st 2011]
![ADA CONCENSUS 2007 TREAT PRE-DIABETES (IFG / IGT ) LIFESTYLELIFESTYLE + METFORMIN Age < 60 y Risk Factors (BP, Lipids, BMI) HbAic > 6 % Type 2 Diabetes and Primary Prevention Cost Analysis DPP 10 y FU: Lifestyle vs Metformin:: +$1500 vs -$30 [ADA 71 st 2011]](http://images.slideplayer.com/23/6553043/slides/slide_12.jpg "ADA CONCENSUS 2007 TREAT PRE-DIABETES (IFG / IGT ) LIFESTYLELIFESTYLE + METFORMIN Age < 60 y Risk Factors (BP, Lipids, BMI) HbAic > 6 % Type 2 Diabetes and Primary Prevention Cost Analysis DPP 10 y FU: Lifestyle vs Metformin:: +$1500 vs -$30 [ADA 71 st 2011]")
13
Years HbA 1c (%) 0 9.0 0 8.5 8.0 6.5 6.0 1243 7.5 7.0 5 6 Standard therapy Intensive therapy 8.1% 7.5% 6.4% Effects of intensive glucose lowering in T2DM ACCORD Gerstein et al. N Engl J Med 2008;358:2545–59

14
Years Patients with events (%) 0 1243 56 0 25 20 15 10 5 First occurrence of non-fatal MI, non-fatal stroke or CV death HR (CI) 0.90 (0.78, 1.04) p=0.16 HR (CI) 1.22 (1.01, 1.46) p=0.04 0 25 20 15 10 5 0 1243 56 Death from any cause Effects of intensive glucose lowering in T2DM ACCORD Gerstein et al. N Engl J Med 2008;358:2545–59 Standard therapy Intensive therapy

15
Side-effects of intensive glucose lowering Hypoglycaemia* N (%) Drug interaction Weight gain >10kg N (%) Standard therapy Intensive therapy p-value Hypothesis: *hypoglycaemia defined as requiring any assistance 261 (5.1)<0.001 713 (14.1)<0.001 70% of non-insulin-treated and 60% of insulin-treated patients were taking three or more oral antidiabetic drugs at study end 830 (16.2) 1399 (27.8) ACCORD Gerstein et al. N Engl J Med 2008;358:2545–59

16
Potential mechanisms of hypoglycaemia-induced mortality Cardiac arrhythmias due to abnormal cardiac repolarisation in high-risk patients (IHD, cardiac autonomic neuropathy) Increased thrombotic tendency/decreased thrombolysis Cardiovascular changes induced by catecholamines Increased heart rate Silent myocardial ischaemia Angina and myocardial infarction
 Increased thrombotic tendency/decreased thrombolysis Cardiovascular changes induced by catecholamines Increased heart rate Silent myocardial ischaemia Angina and myocardial infarction")
17
GLP 1 Mimetics The Virtuous Therapeutic Cycle GLUCOSE CONTROL WEIGHT LOSS NO HYPOGLYCEMIA HbA = 7 %

18
Diabetes Therapy - Safety Hypoglycemia Weight gain CVS mortality Cancer

19
Strategic Rx AE / PEWt GainHypo’sWt LossBPLipids etc Met (3)no yes=no SU (0)yes no Pio (2)yesno yes DPP (3)no yes>no GLP1 (4)no yes ADVERSE POSITIVE
no yes=no SU (0)yes no Pio (2)yesno yes DPP (3)no yes>no GLP1 (4)no yes ADVERSE POSITIVE")
20
OHA and CV Protection Metformin (UKPDS) Rosi / TZD (RECORD) Tolbu / SU (UGDP) MI reduction 39% (vs insulin / chlor / gliben MI increased (OR 1.43) CV mortality increased by 30%
 Rosi / TZD (RECORD) Tolbu / SU (UGDP) MI reduction 39% (vs insulin / chlor / gliben MI increased (OR 1.43) CV mortality increased by 30%")
21
SU vs Met (Schramm T et al, Eur Heart J, April 2011) SUIncrease All- Cause Mortality Increase MI, All CVD, Stroke Glimiperide32 %21 % Glibenclamide19 %12 % Glipizide27 %17 % Tolbutamide28 %27 % [Conclusion: Metformin = protective? vs some SU bad?]

22
DM and Cancer Medications for DM can affect cancer risk and outcome - ? Insulin ? Pioglitazone Metformin reduces cancer risk Sulfonylurea: probably no effect GLP-1 agonists: currently unknown but seemingly safe

23
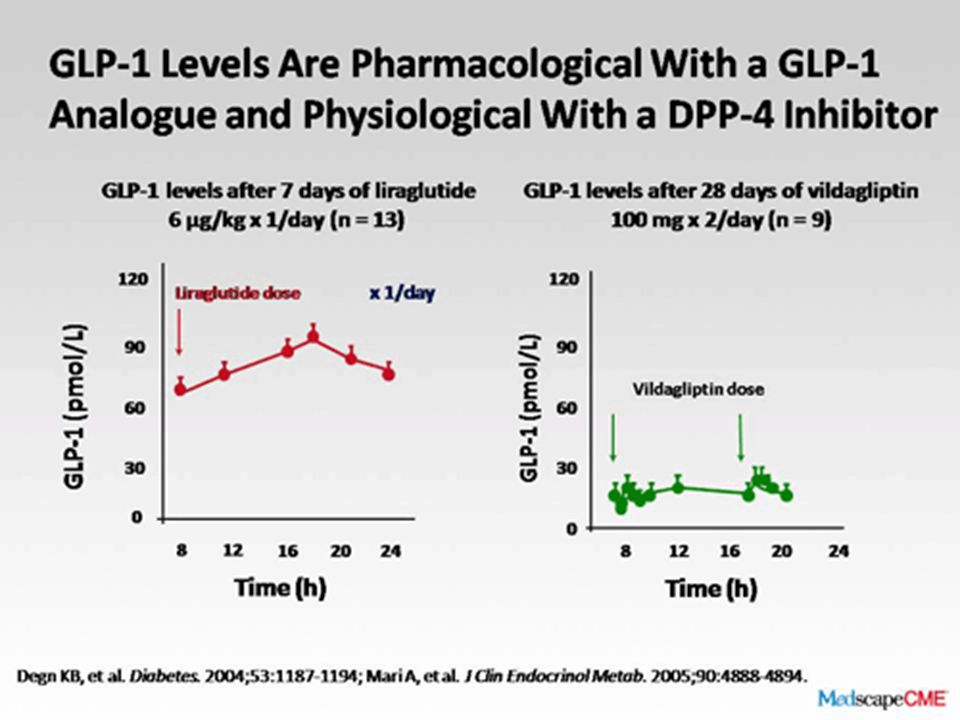
GLP-1 and DPP-4 1 CL=clearance rate; DPP-4=dipeptidyl peptidase-4; GLP-1=glucagon-like peptide-1; IV=intravenously. 1. Vilsbøll T et al. J Clin Endocrinol Metab. 2003;88(1):220–224 Plasma t ½ = 1–2 min (IV) CL = 5–10 L/min HisAlaGluGlyThrPheThrSerAsp Val Ser TyrLeuGluGlyGlnAla Lys Glu Phe IleAlaTrpLeuValLysGlyAla NH 2 36 79 DPP-4
:220–224 Plasma t ½ = 1–2 min (IV) CL = 5–10 L/min HisAlaGluGlyThrPheThrSerAsp Val Ser TyrLeuGluGlyGlnAla Lys Glu Phe IleAlaTrpLeuValLysGlyAla NH DPP-4.")
24
Incretin Therapy DPP 4 Sitagliptin ^ Vildagliptin* Alogliptin Saxagliptin GLP1 Exenatide* Liraglutide ^ Exenatide LAR Albuglutide Taspoglutide [*Available / ^ Imminent in SA]
![Incretin Therapy DPP 4 Sitagliptin ^ Vildagliptin* Alogliptin Saxagliptin GLP1 Exenatide* Liraglutide ^ Exenatide LAR Albuglutide Taspoglutide [*Available / ^ Imminent in SA]](http://images.slideplayer.com/23/6553043/slides/slide_24.jpg "Incretin Therapy DPP 4 Sitagliptin ^ Vildagliptin* Alogliptin Saxagliptin GLP1 Exenatide* Liraglutide ^ Exenatide LAR Albuglutide Taspoglutide [*Available / ^ Imminent in SA]")
25
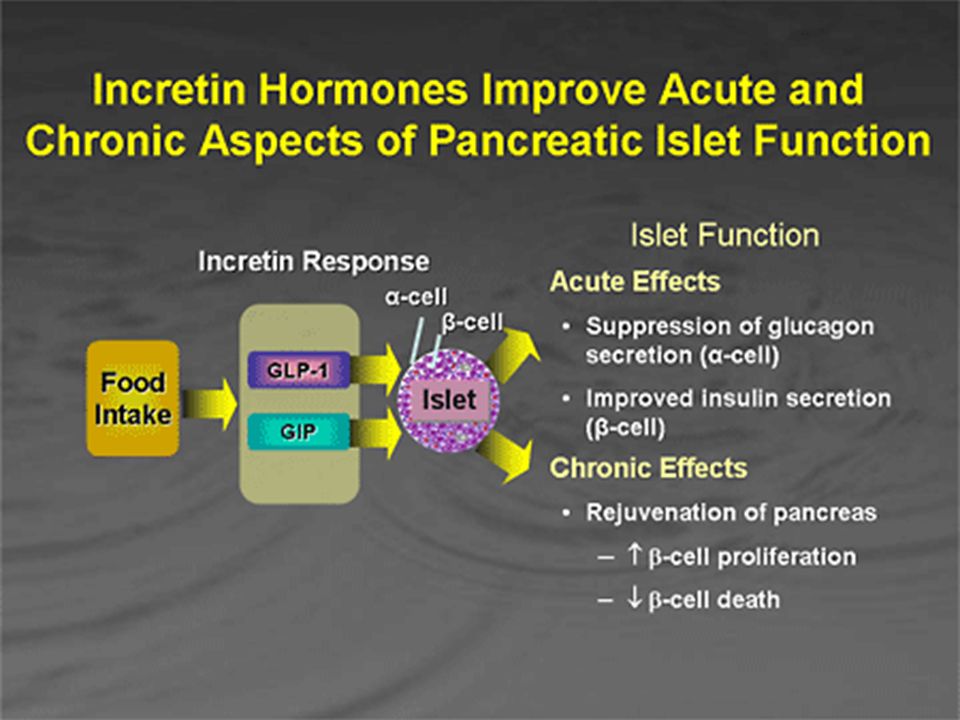
Incretin - GLP 1 Therapy Stimulates insulin secretion Insulin secretion is glucose dependent Inhibits glucagon secretion Increases beta cell mass Delays gastric emptying Inhibits appetite Secretogogue No hypoglycemia Reduces meal-related glucose peaks Maintains beta cell reserve Reduces meal-related peaks; reduces weight Reduces weight

27
Liraglutide in combination with metformin presents a low risk of hypoglycaemia Minor hypoglycaemic events are at the placebo level (LEAD 2, above) There is a small but increased risk of minor hypoglycaemia when combined with SUs (1.0 events per subject every second year; LEAD 1) Minor hypos/patient/year Liraglutide 1.2 mg PlaceboGlimepiride 0 0.2 0.4 0.6 0.8 1 1.2 1.4 Liraglutide 1.8 mg Nauck et al, Diabetes Care, published online 10.23 37/dc08-1355 (LEAD 2) and Marre et al. Diabetes 2008;57(Suppl. 1):A4 (LEAD 1).
:A4 (LEAD 1)..")
28
A quarter of patients lose an average of 7.7 kg with liraglutide Weight change (kg) 0–Q1: mean weight change for the 25% of subjects who had the largest weight loss Q1–Q2: mean weight change for the 25–50% weight loss quartile Q2–Q3: mean weight change for the 50–75% weight loss quartile Q3–Q4: mean weight change for the 75–100% weight loss quartile, that is, the 25% who had the smallest weight loss Liraglutide 1.8 mg + met Q3-Q4 Nauck et al, Diabetes Care, published online 10.23 37/dc08-1355 (LEAD 2).
 0–Q1: mean weight change for the 25% of subjects who had the largest weight loss Q1–Q2: mean weight change for the 25–50% weight loss quartile Q2–Q3: mean weight change for the 50–75% weight loss quartile Q3–Q4: mean weight change for the 75–100% weight loss quartile, that is, the 25% who had the smallest weight loss Liraglutide 1.8 mg + met Q3-Q4 Nauck et al, Diabetes Care, published online /dc (LEAD 2).")
29
Sustained weight reduction over 52 weeks with liraglutide Liraglutide 1.8 mg/day Liraglutide 1.2 mg/day Glimepiride 8 mg/day Waist circumference was reduced from baseline by 3.0 cm with liraglutide 1.8 mg Waist circumference increased by 0.4 cm with glimepiride (p<0.0001) *** ***p<0.0001 for change from baseline 52 Garber et al, The Lancet, early online publication, 25 Sept 2008 (LEAD 3).
 *** ***p< for change from baseline 52 Garber et al, The Lancet, early online publication, 25 Sept 2008 (LEAD 3).")
30
Liraglutide reduces visceral body fat Change in body fat DEXA scan -4 -3 -2 0 1 2 3 Change in body fat, kg (%) Two thirds of weight lost was fat tissue (liraglutide 1.8 mg) Liraglutide 1.2 mg + met Glimepiride + met -1.6* (-1.1%*) -2.4* (-1.2%*) +1.1 kg (+0.4%) Liraglutide 1.8 mg + met Visceral vs. subcutaneous fat CT scan -25 -20 -15 5 0 5 10 -10 VisceralSubcutaneous Change in percentage fat (%) -17.1 -16.4 -4.8 -7.8* -8.5* +3.4 Data are mean±SEM; *p<0.05 vs. glim+met; n=160. LEAD 2 substudy, originally presented as Jendle et al. Diabetes 2008;57(Suppl. 1):A32.
 * -8.5* +3.4 Data are mean±SEM; *p<0.05 vs. glim+met; n=160. LEAD 2 substudy, originally presented as Jendle et al. Diabetes 2008;57(Suppl. 1):A32..")
34
Liraglutide improves beta-cell function as measured by HOMA-B and proinsulin:insulin ratio 56.4%70.6%56.3%45.5%Baseline p=0.0313 p=0.0033 HOMA (%) 0.480.450.420.45 Change in proinsulin:insulin Liraglutide 1.8 mg Liraglutide 1.2 mg Rosi- glitazone PlaceboLiraglutide 1.8 mg Liraglutide 1.2 mg Rosi- glitazone Placebo Marre et al. Diabetes 2008;57(Suppl. 1):A4 (LEAD 1). Data are mean±2SE.
:A4 (LEAD 1). Data are mean±2SE..")
37
Diabetes Care – Future? 1)Pre-Diabetes 2)CVD Protection 3)Cancer 4)Hypoglycemia 5)Weight 6)Disease Modifying Metformin Metformin, TZD, GLP1 Metformin Metformin, TZD, GLP1 Metformin, GLP1 GLP1
Pre-Diabetes 2)CVD Protection 3)Cancer 4)Hypoglycemia 5)Weight 6)Disease Modifying Metformin Metformin, TZD, GLP1 Metformin Metformin, TZD, GLP1 Metformin, GLP1 GLP1.")
Similar presentations

>")


 8 : 20 ~ 8 : 50 B 棟 8 階カンファレンスルーム 薬剤部 TTSP 石井 英俊.>")
 Trial Overview Large international randomized controlled trial in patients with.>")
