Download presentation
Presentation is loading. Please wait.

1
A Vision of the Growth Process in a Technologically Progressive Economy: the United States, 1899-1941 Gerben Bakker, Nicholas Crafts and Pieter Woltjer

2
Introduction This paper seeks to improve on existing work that measures TFP growth at a disaggregated level It covers more sectors in detail and accounts more fully for growth of labor quality than earlier estimates It provides an account of intensive growth contributions (IGC) by sector using value-added weights
 by sector using value-added weights")
3
Questions We use the estimates to address the following questions: Was the 1930s the ‘most technologically progressive decade’ of the 20 th Century? Does the growth of TFP look like ‘yeast’ or ‘mushrooms’? What was the impact of electricity as a GPT on TFP growth in 1920s’ American manufacturing?

4
Context 2 nd Industrial Revolution Strong TFP growth (Solow, 1957; Kendrick, 1961; Abramovitz & David, 2001) The start of ‘one big wave’ (Gordon, 2000) The ‘most technologically progressive decade’ (Field, 2003)
 The start of ‘one big wave’ (Gordon, 2000) The ‘most technologically progressive decade’ (Field, 2003)")
5
Table 1. Contributions to Labor Productivity Growth in the United States (% per year) K/LCrude TFP Refined TFP Y/L 1901-19190.44 1.27 1.081.71 1919-19290.30 1.97 2.022.27 1929-1941-0.06 2.41 2.312.35 1941-19480.21 1.50 1.291.71 1948-19730.76 1.99 1.882.75 1973-19890.70 0.58 0.361.28 1989-20000.78 1.29 0.792.07 2000-20070.87 1.72 1.382.59 Notes: ‘refined TFP’ corrects ‘crude TFP for labor quality Source: derived from Field (2011, Table 2.1); post-1948 from the BLS website.
 K/LCrude TFP Refined TFP Y/L Notes: ‘refined TFP’ corrects ‘crude TFP for labor quality Source: derived from Field (2011, Table 2.1); post-1948 from the BLS website..")
6
Kendrick (1961) Is the starting point but is not wholly adequate to address the issues raised by Harberger (1998) and Field (2003) Estimates for total PDE, specific sectors = about 55%PDE, and residual 45% 1930s ends in 1937 Accounts only partly for labor quality – does not include within-occupation improvements
 Is the starting point but is not wholly adequate to address the issues raised by Harberger (1998) and Field (2003) Estimates for total PDE, specific sectors = about 55%PDE, and residual 45% 1930s ends in 1937 Accounts only partly for labor quality – does not include within-occupation improvements")
7
Going Beyond Kendrick We calculate the value-added shares of each sector (Appendix A) We add 5 more sectors - construction, distribution, FIRE, post office, spectator entertainment – to increase coverage to 80% PDE (Appendix B) We extend the sectoral analysis to 1941 (Appendix C) We construct an estimate of labour inputs taking account of age, gender, and education within each industry (Appendix D)
 We add 5 more sectors - construction, distribution, FIRE, post office, spectator entertainment – to increase coverage to 80% PDE (Appendix B) We extend the sectoral analysis to 1941 (Appendix C) We construct an estimate of labour inputs taking account of age, gender, and education within each industry (Appendix D)")
8
Labor Quality Important to take account of increased schooling within occupations (cf. Goldin & Katz, 2008) We find labor quality grew at 0.8% per year in PDE during 1899-1941 compared with 0.3% according to Kendrick Most of this difference comes from rising educational attainment So TFP growth is lower: 1.35% instead of 1.7%
 We find labor quality grew at 0.8% per year in PDE during compared with 0.3% according to Kendrick Most of this difference comes from rising educational attainment So TFP growth is lower: 1.35% instead of 1.7%.")
9
Index of Labor Input for an Industry Labor input is based on employment classified by age, gender, and education ΔHK/HK = ∑v l ΔL l /L l where L l is employment for a given set of characteristics and v l is that group’s share of labor income in the industry ΔLQ/LQ = ∑v l ΔL l /L l – ΔL/L

10
Data for Labor Quality Estimate educational attainment for workers for the pre-1940 years using 1940 census returns Construct an employment matrix for the entire period that groups workers according to (predicted) education, age, gender Derive compensation matrix on basis of average wages for each category in 1940 Robustness check: repeat exercise using Iowa wage data for 1915 in step 3
 education, age, gender Derive compensation matrix on basis of average wages for each category in 1940 Robustness check: repeat exercise using Iowa wage data for 1915 in step 3")
11
Labor Quality Growth Exhibited significant variation between sectors and over time (Table 3) Was not highly correlated with TFP growth at the sectoral level Several sectors had negative growth of labor quality in 1899-1909 as their workforces became younger and more female
 Was not highly correlated with TFP growth at the sectoral level Several sectors had negative growth of labor quality in as their workforces became younger and more female")
12
Growth Accounting We use standard neoclassical assumptions but adjust for quality of labor inputs Δ(Y/L)/(Y/L) = αΔ(K/L)/(K/L) + βΔ(HK/L)/(HK/L) + ΔA/A where α is the share of profits and β is the share of wages
/(Y/L) = αΔ(K/L)/(K/L) + βΔ(HK/L)/(HK/L) + ΔA/A where α is the share of profits and β is the share of wages")
13
TFP Estimates for New Sectors, 1899-1929 (Appendix B) Construction and Wholesale & Retail Trade: crude TFP growth proxied by labor productivity growth from Kendrick (1961) FIRE: output index based on financial intermediation (0.33) from Philippon (2014), life insurance (0.33) policies from Carter et al. (2006), rents (0.33) based on Lebergott (1996); labor force (0.5) from Kendrick (1961), capital stock (0.5) from Goldsmith (1958)
, rents (0.33) based on Lebergott (1996); labor force (0.5) from Kendrick (1961), capital stock (0.5) from Goldsmith (1958).")
14
TFP Estimates for 1929-1941 (Appendix C) Nominal output and employment from NIPA Prices from BLS, Historical Statistics, NIPA Hours of work from Kendrick (1961) supplemented by HSUS Capital input based on a PIM using investment data in BEA, Fixed Asset Tables with starting assets in 1901 based on BEA, Fixed Reproducible Tangible Wealth
 Nominal output and employment from NIPA Prices from BLS, Historical Statistics, NIPA Hours of work from Kendrick (1961) supplemented by HSUS Capital input based on a PIM using investment data in BEA, Fixed Asset Tables with starting assets in 1901 based on BEA, Fixed Reproducible Tangible Wealth")
15
(Refined) TFP Growth (% per year): New Estimates (Table 4) 1899-19091909-191919-291929-411899- 1941 PDE0.90.71.72.01.4 Kendrick PDE1.21.12.02.31.7 Construction4.4-1.60.8 1.1 FIRE0.5-0.60.2-1.3-0.4 Wholesale & Retail Trade 1.50.00.93.51.6
 TFP Growth (% per year): New Estimates (Table 4) PDE Kendrick PDE Construction FIRE Wholesale & Retail Trade")
16
A Revised View of TFP Growth Over Time Table 7 displays estimates of TFP growth for the PDE through the 20 th century The pre-1941 numbers embody our correction for labor quality growth which makes them more comparable to the later BLS estimates TFP growth in the 1930s is lower than in 1958- 1973

17
Table 7. TFP Growth in the Private Domestic Economy, 1899-2007 (% per year) 1899-19090.92 1909-19190.68 1919-19291.68 1929-19411.98 1948-19581.89 1958-19732.27 1973-19890.48 1989-20000.98 2000-20071.45 Sources: Table 5 and Bureau of Labor Statistics, “Historical Multifactor Productivity Measures”, http://www.bls.gov/mfp/home.htm (October 2014)http://www.bls.gov/mfp/home.htm
 Sources: Table 5 and Bureau of Labor Statistics, Historical Multifactor Productivity Measures , (October 2014)")
18
Intensive Growth Contributions, 1899-1941 (Table 5) Top 3 sectors are wholesale & retail trade, railroads, and foods Manufacturing contributed 45% of all TFP growth Gordon’s ‘one big wave’ technologies (10 sectors representing 4 clusters, fn.8) contributed 42% of all TFP growth; their IGC rose from 0.3% per year in 1899-1909 to 0.76% in 1929-41
 Top 3 sectors are wholesale & retail trade, railroads, and foods Manufacturing contributed 45% of all TFP growth Gordon’s ‘one big wave’ technologies (10 sectors representing 4 clusters, fn.8) contributed 42% of all TFP growth; their IGC rose from 0.3% per year in to 0.76% in")
19
The 1930s Compared with the 1920s Field (2011) emphasized that IGCs were broadly based in the 1930s whereas manufacturing dominated in the 1920s We re-worked Field’s decomposition in Table 8 and we agree (Appendix C) However, we think the contrast between the 2 periods is bigger; manufacturing accounted for 85.6% of TFP growth in the1920s compared with 32.1% in the 1930s
 emphasized that IGCs were broadly based in the 1930s whereas manufacturing dominated in the 1920s We re-worked Field’s decomposition in Table 8 and we agree (Appendix C) However, we think the contrast between the 2 periods is bigger; manufacturing accounted for 85.6% of TFP growth in the1920s compared with 32.1% in the 1930s")
20
Table 8. Decomposition of TFP Growth in the PNE, 1919-1929 1929 Weight (%) TFP Growth (% p.a.) IGC (% p.a.) Midperiod Weight (%) TFP Growth (% p.a.) IGC (% p.a.) Manufacturing 32.935.121.6930.744.471.37 Transport and Public Utilities 14.101.860.2612.662.550.32 Wholesale & Retail Trade 20.300.500.1015.670.350.05 Mining 2.903.200.09 Other 32.67-0.09-0.0338.03-0.65-0.25 Total PNE 2.02 Field 1.60 BCW Sources: Field (2011, Tables 2.5 and 2.10); derived from Tables 4 and 5.
 TFP Growth (% p.a.) IGC (% p.a.) Midperiod Weight (%) TFP Growth (% p.a.) IGC (% p.a.) Manufacturing Transport and Public Utilities Wholesale & Retail Trade Mining Other Total PNE 2.02 Field 1.60 BCW Sources: Field (2011, Tables 2.5 and 2.10); derived from Tables 4 and 5..")
21
Table 8. Decomposition of TFP Growth in the PNE, 1929-1941 1941 Weight (%) TFP Growth (% p.a.) IGC (% p.a.) Midperiod Weight (%) TFP Growth (% p.a.) IGC (% p.a.) Manufacturing 42.422.601.1031.042.270.70 Transport and Public Utilities 12.284.600.5711.953.270.39 Wholesale and Retail Trade 22.232.390.5315.813.490.55 Mining 2.771.820.05 Other 23.070.480.1138.441.260.48 Total PNE 2.31 Field 2.18 BCW Sources : Field (2011, Tables 2.5 and 2.10); derived from Tables 4 and 5.
 TFP Growth (% p.a.) IGC (% p.a.) Midperiod Weight (%) TFP Growth (% p.a.) IGC (% p.a.) Manufacturing Transport and Public Utilities Wholesale and Retail Trade Mining Other Total PNE 2.31 Field 2.18 BCW Sources : Field (2011, Tables 2.5 and 2.10); derived from Tables 4 and 5..")
22
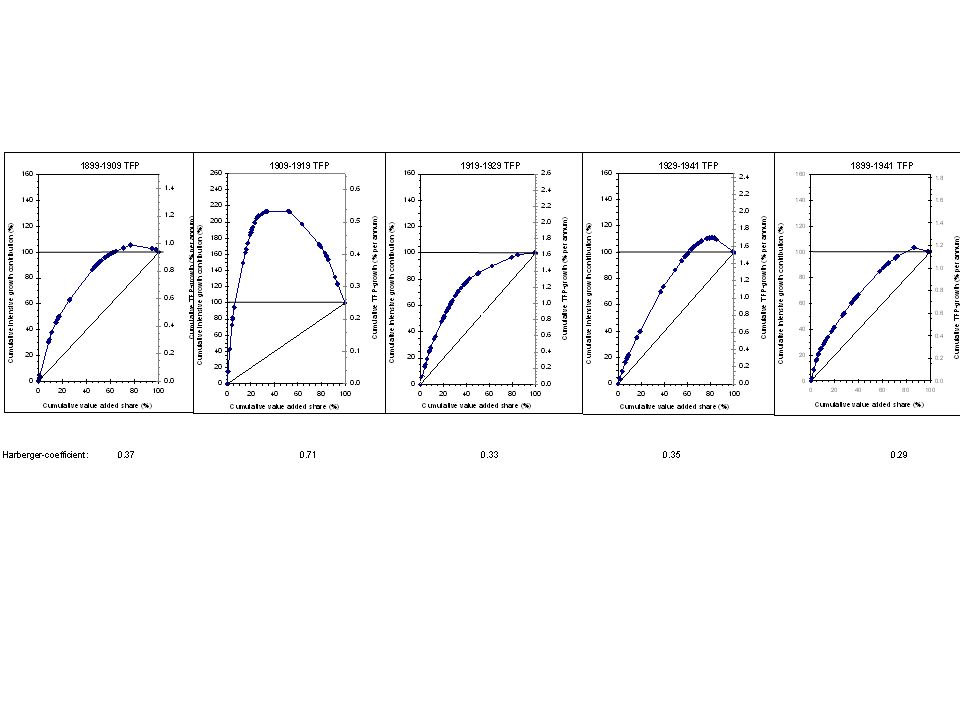
Harberger Curves (Harberger, 1998) Rank sectors by TFP growth, plot cumulative IGC vs. cumulative VA share Harberger Coefficient is area under curve and above diagonal divided by total area under curve; ‘yeast’ has low H and ‘mushrooms’ has high H Harberger (1998) thought growth process usually ‘mushroomy’ looking at short periods after the ‘one big wave’
 thought growth process usually ‘mushroomy’ looking at short periods after the ‘one big wave’.")
23
- 23 - Harberger Curve: Yeast

24
- 24 - Harberger Curve: Mushrooms

25
GPTs and Harberger Curves GPT might be expected to have pervasive effect on labor productivity growth through GPT capital-deepening effect Own TFP growth for the GPT will be sectorally concentrated and will not of itself deliver a ‘yeasty’ Harberger Curve However, if the GPT also has widespread TFP spillovers, as David (1991) suggested for electricity in 1920s’ U.S. manufacturing, this could deliver a yeast-like growth process with a low H

26
Mushrooms or Yeast?: PDE Most periods are quite yeasty: H = 0.37 in 1899- 1909, 0.33 in 1919-29 and 0.35 in 1929-41; IGCs broadly based in both1920s and 1930s These numbers are smaller than in OECD economies recently; Inklaar and Timmer (2007) report H =0.49 to 0.76 in 1987-95 and 0.40 to 0.76 for 1995-2004 H is 0.71 in 1909-19 when TFP growth is negative in many sectors.. is this period affected by the war?

28
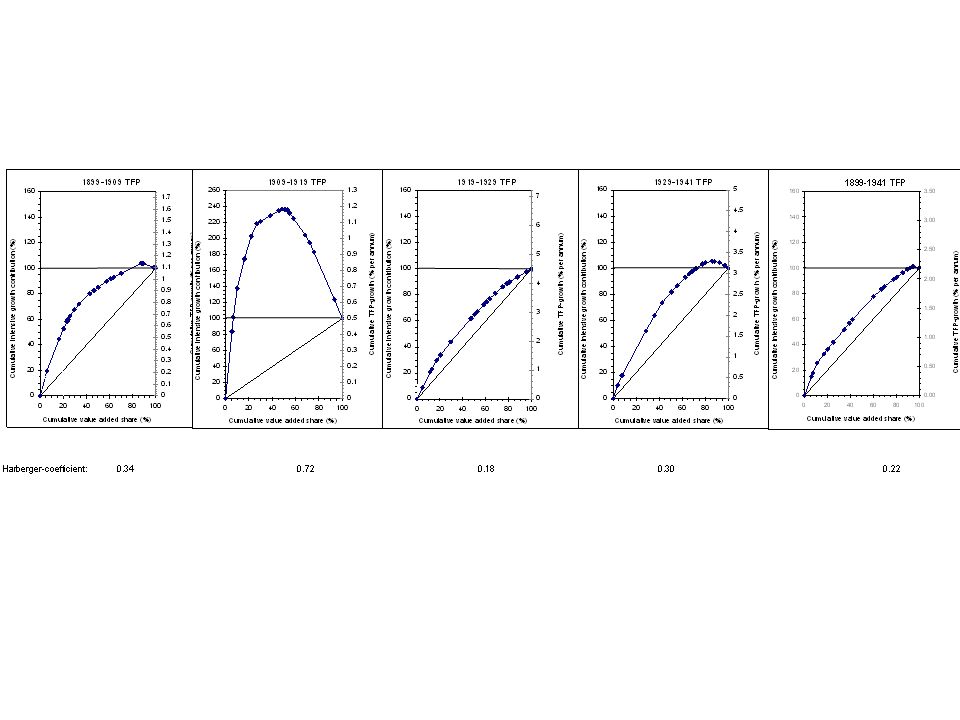
Mushrooms or Yeast?: Manufacturing Similar picture: H is quite low except for 1919-29 H = 0.34 in 1899-1909, 0.72 in 1909-19, 0.18 in 1919-29 and 0.30 in 1929-41 Again not what Harberger expected Is this the impact of electricity as a GPT with TFP spillovers?

30
Electricity in 1920s’ Factories The shift from drive-shafts to wires (Devine, 1983) Adoption of unit drive as HP in secondary motors grew very rapidly David (1991) and David & Wright (1999) found acceleration of TFP growth at the industry level correlated with growth of this HP Improved design of factories, improved materials handling, saved capital
 Adoption of unit drive as HP in secondary motors grew very rapidly David (1991) and David & Wright (1999) found acceleration of TFP growth at the industry level correlated with growth of this HP Improved design of factories, improved materials handling, saved capital")
31
David & Wright (1999) Revisited With our new estimates of TFP growth we still obtain the basic correlation between secondary motors HP growth and the change in TFP growth but with a lower magnitude Effect for manufacturing as whole in the 1920s is 6.2*0.2 = 1.25 percentage points No TFP-spillovers effect in the 1930s Does this explain the very ‘yeasty’ Harberger curve for 1920s’ manufacturing?
 Revisited With our new estimates of TFP growth we still obtain the basic correlation between secondary motors HP growth and the change in TFP growth but with a lower magnitude Effect for manufacturing as whole in the 1920s is 6.2*0.2 = 1.25 percentage points No TFP-spillovers effect in the 1930s Does this explain the very ‘yeasty’ Harberger curve for 1920s’ manufacturing")
32
Table 9. TFP Spillover Regressions for a Cross- Section of Manufacturing Industries. 1919-291929-41 Constant 2.465*** (4.02) -2.518* (-2.29) HP Growth 0.203* (2.25) -0.042 (-0.22) Adjusted R 2 0.18-0.06 N19 Notes: The dependent variables are (TFP growth 1919-29 – TFP growth 1899-19) and (TFP growth 1929-41 – TFP growth 1919-29) derived from Table 4; the independent variables are the average annual rates of growth of horsepower in secondary motors in 1919-29 and 1929-39 from DuBoff (1979).
 * (-2.29) HP Growth 0.203* (2.25) (-0.22) Adjusted R N19 Notes: The dependent variables are (TFP growth – TFP growth ) and (TFP growth – TFP growth ) derived from Table 4; the independent variables are the average annual rates of growth of horsepower in secondary motors in and from DuBoff (1979)..")
33
Growth Accounting with Electricity Augment standard formula to allow 2 types of capital, own TFP growth in 2 sectors, and TFP spillovers Δ(Y/L)/(Y/L) = α 1 Δ(K O /L)/(K O /L) + α 2 Δ(K E /L)/(K E /L) + βΔ(HK/L)/(HK/L) + ηΔA O /A O + ϕ ΔA E /A E + γΔ(K E /L)/(K E /L) The final 3 terms are each part of TFP growth and the last one is TFP spillovers from electrical capital deepening
/(Y/L) = α 1 Δ(K O /L)/(K O /L) + α 2 Δ(K E /L)/(K E /L) + βΔ(HK/L)/(HK/L) + ηΔA O /A O + ϕ ΔA E /A E + γΔ(K E /L)/(K E /L) The final 3 terms are each part of TFP growth and the last one is TFP spillovers from electrical capital deepening")
34
Implementing This Method at the Industry Level (Appendix C) Rate of growth of horsepower in electric motors (DuBoff, 1979) is rate of growth of electrical capital Assume share of total profits accruing to electrical capital equals share of electrical capital in total capital using NIPA and investment by asset type for 1921-29 from BEA Take electrical capital to be the sum of E160 (electrical transmissions, distribution and industrial apparatus) and E070 (electrical equipment nec)
 Rate of growth of horsepower in electric motors (DuBoff, 1979) is rate of growth of electrical capital Assume share of total profits accruing to electrical capital equals share of electrical capital in total capital using NIPA and investment by asset type for from BEA Take electrical capital to be the sum of E160 (electrical transmissions, distribution and industrial apparatus) and E070 (electrical equipment nec)")
35
- 35 -

36
Accounting for Electricity Electricity accounts for about 28 per cent of TFP growth and 24 per cent of labor productivity growth in manufacturing in the 1920s Electrical TFP growth (based on spillovers and own TFP growth in electrical machinery) varies more than non-electrical TFP growth Overall yeastiness of manufacturing productivity growth may not primarily reflect the impact of electricity as a GPT
 varies more than non-electrical TFP growth Overall yeastiness of manufacturing productivity growth may not primarily reflect the impact of electricity as a GPT")
38
Table 11. Harberger Coefficients for Contributions to Productivity Growth in the Manufacturing Sector, 1919-29. TFP GrowthY/L Growth Electrical0.30 Non-Electrical0.220.20 Total0.180.17

39
Conclusions The 1930s did not see the fastest TFP growth of the 20 th century in the PDE Productivity growth contributions by sector before WWII were much more broadly based (yeasty) than Harberger thought TFP spillovers from electricity do not fully explain the yeastiness of manuaftcuring growth in the 1920s
 than Harberger thought TFP spillovers from electricity do not fully explain the yeastiness of manuaftcuring growth in the 1920s")
Similar presentations


![[ 1 ] Sweden and Spain: two contrasting growth experiences Matilde Mas University of Valencia and Ivie Productivity Conference at Saltsjöbaden Stockholm.](/18/5713835/big_thumb.jpg "[ 1 ] Sweden and Spain: two contrasting growth experiences Matilde Mas University of Valencia and Ivie Productivity Conference at Saltsjöbaden Stockholm.>")


