Download presentation
Presentation is loading. Please wait.

1
Orientation to data collection processes and inaugural quarterly discussion of latest data on ICAP programs MER April 25 2007 ICAP quarterly data meeting

2
Objectives Review and discuss the process of data collection, cleaning, analysis and dissemination in NY and in-country Share latest data on ICAP supported programs across 14 countries –Discuss how data are or can be used for program improvement Discuss format of future ICAP quarterly data meetings

3
Outline Unified Reporting System (URS) Site Census Program and Facility Characteristics Tracking System (P-FaCTS) Care and treatment data PMTCT(+) data TB/HIV data Patient-level data Open discussion
 Site Census Program and Facility Characteristics Tracking System (P-FaCTS) Care and treatment data PMTCT(+) data TB/HIV data Patient-level data Open discussion")
4
ICAP/CU-supported countries

5
ICAP supports an estimated 694 programmatic activities at 260 facilities in 14 countries (2.7 activities per site) Need to capture standard donor and ICAP indicators on the scale and quality of ICAP-supported programs on a quarterly basis. –Care & treatment: 166 indicators (203 of 222 sites reporting as of 4/07) –PMTCT+: 37 indicators (105/115 sites reporting as of 04/07) –TB/HIV: 22 indicators (not yet started, expected from 141 sites) –Testing & counseling, infant diagnosis, adherence support in the works Programs are expanding, diversity of programming is expanding –Need for more indicators?!
 –PMTCT+: 37 indicators (105/115 sites reporting as of 04/07) –TB/HIV: 22 indicators (not yet started, expected from 141 sites) –Testing & counseling, infant diagnosis, adherence support in the works Programs are expanding, diversity of programming is expanding –Need for more indicators !.")
6
Unified Reporting System (URS) What: Central reporting system that utilizes a web-based application for capturing and disseminating data on multiple ICAP- supported activities and programs Purpose: To streamline, standardize, and increase the efficiency and utilization of routinely collected data by any ICAP staff member
 What: Central reporting system that utilizes a web-based application for capturing and disseminating data on multiple ICAP- supported activities and programs Purpose: To streamline, standardize, and increase the efficiency and utilization of routinely collected data by any ICAP staff member")
7
URS structure CIEISIN Donor/MOH reports Maps Web components Data processing Outputs Datasets Data checks & cleaning QA Canned/ ad hoc reports Data entry Data collection Detailed analyses

8
Site Census module What: Real-time inventory of all planned, current, and closed ICAP sites. Supported activities, funding source(s) and their targets are also captured Purpose: To have one up to date master list of sites, activities and targets that all ICAP staff can refer to for planning and evaluation
 and their targets are also captured Purpose: To have one up to date master list of sites, activities and targets that all ICAP staff can refer to for planning and evaluation.")
9
Source: ICAP Site Census, March 2007 Number of ICAPsupported sites by activity, March 2007

10
Source: ICAP Site Census, March 2007 Number of ICAP-supported sites by country, March 2007 (n=274)
")
11
Program and Facility Characteristics Tracking System (P-FaCTS) module What: Collects program and facility information on ICAP-supported care and treatment programs semi-annually Purpose: To describe the scope, diversity, and comprehensiveness of ICAP-supported care and treatment programs, and evaluate multi-level factors that influence program performance and patient-level outcomes
 module What: Collects program and facility information on ICAP-supported care and treatment programs semi-annually Purpose: To describe the scope, diversity, and comprehensiveness of ICAP-supported care and treatment programs, and evaluate multi-level factors that influence program performance and patient-level outcomes")
12
Context: (e.g., Washington Heights, NYC) Urban/rural, adult and antenatal HIV prevalence, TB incidence Site: (i.e., CU Presbyterian Hosp) Services: e.g., pMTCT, labor and delivery, TB, VCT Characteristics: Type, catchment population, number of beds Facility: (i.e., an HIV clinic within the site) Physical plant: e.g., # exam rooms, area of facility Programmatic: e.g., patient support groups, nutritional support, adherence support Staffing: # of physicians, nurses, counselors, pharmacists Laboratory: CD4, HIV RNA, infant diagnosis, liver function test P-FaCTS nomenclature and examples of information collected
 Urban/rural, adult and antenatal HIV prevalence, TB incidence Site: (i.e., CU Presbyterian Hosp) Services: e.g., pMTCT, labor and delivery, TB, VCT Characteristics: Type, catchment population, number of beds Facility: (i.e., an HIV clinic within the site) Physical plant: e.g., # exam rooms, area of facility Programmatic: e.g., patient support groups, nutritional support, adherence support Staffing: # of physicians, nurses, counselors, pharmacists Laboratory: CD4, HIV RNA, infant diagnosis, liver function test P-FaCTS nomenclature and examples of information collected")
13
Location and type of ICAP-supported care and treatment facilities (n=162) Source: P-FaCTS January 2007
 Source: P-FaCTS January 2007")
14
Availability and comprehensiveness of on-site services at ICAP-supported care and treatment facilities (n=162) Source: P-FaCTS January 2007
 Source: P-FaCTS January 2007")
15
Availability and comprehensiveness of patient support services at ICAP-supported care and treatment facilities (n=162) Source: P-FaCTS January 2007
 Source: P-FaCTS January 2007")
16
Availability and comprehensiveness of on-site laboratory services at ICAP-supported care and treatment facilities (n=162) Source: P-FaCTS January 2007
 Source: P-FaCTS January 2007")
17
Number of providers per 1000 patients on ART at ICAP-supported care and treatment facilities (n=162)) Source: P-FaCTS January 2007
) Source: P-FaCTS January 2007")
18
P-FaCTS summary Care and treatment programs vary in comprehensiveness of services offered Activities and components of ICAP- supported care and treatment programs are dynamic, therefore necessary to conduct routine surveys PFaCTS data can be used in conjunction with program data for program planning and evaluation

19
Care and treatment

20
Number of ICAP-supported care and treatment sites by country, March 2007 (n=222) Source: ICAP Site Census, March 2007
 Source: ICAP Site Census, March 2007")
21
Care and treatment aggregate indicators received on quarterly basis by facility (currently 209/222 in 10 countries) Pre-ART and ART care enrollment by age, sex and pregnancy status CD4 count for ART patients (baseline, 6 and 12 months) ART regimens by age ART discontinuation and reasons Number of trainings on ART and palliative care
 Pre-ART and ART care enrollment by age, sex and pregnancy status CD4 count for ART patients (baseline, 6 and 12 months) ART regimens by age ART discontinuation and reasons Number of trainings on ART and palliative care")
22
Care and treatment indicator collection and submission M&E Officer On-line reporting module (URS) MER Data Analyst Automated data checks Site BSite A Site B Automated data checks Manual data checks MER Liaison MER C&T Lead CDC-Atlanta Data queries M&E & Clinical staff Program Review M&E & Clinical staff USG
 MER Data Analyst Automated data checks Site BSite A Site B Automated data checks Manual data checks MER Liaison MER C&T Lead CDC-Atlanta Data queries M&E & Clinical staff Program Review M&E & Clinical staff USG")
23
Uses of care and treatment data In-country USG reporting Track 1.0 reporting (Atlanta) Dissemination of data for program evaluation and planning –Summary tables and graphs By country and time period –Slide set for presentations Important trends –In-depth analyses Abstracts from Implementer and IAS meeting
 Dissemination of data for program evaluation and planning –Summary tables and graphs By country and time period –Slide set for presentations Important trends –In-depth analyses Abstracts from Implementer and IAS meeting")
24
Example of quarterly summary data table – country over time

25
Example of facility line list for each country

26
Number of ICAP-supported care and treatment sites reporting by country, July 2004 – December 2006 (Total number of sites reporting = 165)
")
27
Kenya Rwanda So. Africa Tanzania HIV care (pre-ART and ART) ART Care Mozambique added Ethiopia added Nigeria, Swaziland, Zambia added Cumulative enrollment in HIV care (pre-ART and ART) & ART care at ICAP-supported sites, July 2004 - December 2006 Lesotho added
 ART Care Mozambique added Ethiopia added Nigeria, Swaziland, Zambia added Cumulative enrollment in HIV care (pre-ART and ART) & ART care at ICAP-supported sites, July December 2006 Lesotho added.")
28
Cumulative pediatric enrollment in HIV care (pre-ART and ART) & ART care at ICAP-supported sites, July 2004 - December 2006 Kenya Rwanda So. Africa Tanzania HIV care (pre-ART and ART) ART Care Mozambique added Ethiopia added Lesotho added Nigeria, Swaziland, Zambia added
 ART Care Mozambique added Ethiopia added Lesotho added Nigeria, Swaziland, Zambia added.")
29
Total in care (n=185,903)ART care (n=87,746) Cumulative enrollment in ICAP-supported sites by ART status and country, July 2004 - December 2006
ART care (n=87,746) Cumulative enrollment in ICAP-supported sites by ART status and country, July December 2006")
30
N=23,908N=13,056N=21,616N=4,417N=26,532N=22,746N=59,079 Cumulative enrollment in pre-ART vs. ART care in ICAP-supported care and treatment sites by country as of December 2006* (Total in care = 185,903) N=3,118N=11,431 *Swaziland data not available
 N=3,118N=11,431 *Swaziland data not available.")
31
Cumulative enrollment in HIV care (pre-ART and ART) by age, sex and country at ICAP-supported sites as of December 2006 (Total in care = 185,903) *Swaziland data not available
 by age, sex and country at ICAP-supported sites as of December 2006 (Total in care = 185,903) *Swaziland data not available")
32
Cumulative enrollment on ART by age, sex and country at ICAP-supported sites as of December 2006 (Total on ART = 87,746)
")
33
Mean number of patients enrolled in ICAP- supported care and treatment facilities

34
Mean number of patients enrolled in ICAP-supported care and treatment facilities (and country variability)
")
35
ART eligibility and initiation for patients receiving care at ICAP-supported care and treatment sites, October to December 2006 (Total received care during quarter = 127,943)
")
36
ART regimens in adults and children at ICAP-supported sites October-December 2006 EthiopiaKenyaMozambiqueNigeriaRwandaSouth AfricaTanzaniaOverall N=9,643N=5,405N=11,146N=769N=7,493N=7,617N=4,766N=46,839 d4T-3TC-NVP53787746 98056 d4T-3TC-EFV20 8101 986 424 ZDV-3TC-NVP19 3 34929 11011 ZDV-3TC-EFV 8 1 4413 2 6 6 2 nd line regimen 0 3 60 2 1 0 2 Unknown 0 5 00 2 0 0 1 EthiopiaKenyaMozambiqueNigeriaRwandaSouth AfricaTanzaniaOverall N=514N=460N=616N=10N=754N=981N=319N=3,644 d4T-3TC-NVP1958501004826529 d4T-3TC-EFV 6 17 40 962 322 ZDV-3TC-NVP6912 43026 27230 ZDV-3TC-EFV 4 2 1016 15 8 9 Other*000001404 2 nd line regimen 1 230 1 1812 7 Unknown 010 00 1 0 0 2 Adults 15+ (%) Children <15 (%) *In South Africa, d4T-3TC-LPV/r is also prescribed as a first-line regimen
 Children <15 (%) *In South Africa, d4T-3TC-LPV/r is also prescribed as a first-line regimen")
37
Average median CD4 count (cells/µL) at baseline and 6 and 12 months after ART initiation by country at ICAP-supported sites as of December 2006* *CD4 data not available for all ART patients. Data not available for Nigeria, Swaziland, and Zambia.

38
Reasons for ART discontinuation at ICAP-supported sites as of December 2006

39
Reasons for ART discontinuation by country at ICAP-supported sites as of December 2006* N=1241N=1989N=2,701N=1,103N=3,119 * Transfers not considered discontinuers N=634N=4N=319

40
Comparing results and targets

41
ART patients in more comprehensive programs may have better follow-up care 1 or 2 activities3 or 4 activities Median=44% Median=74% Support activities include peer- educator program, outreach program nutritional support, adherence support Source: Quarterly report data and PFaCTS, January 2007

42
PMTCT/PMTCT-plus

43
Number of ICAP/CU-supported pMTCT(+) sites, March 2007 (n=115) Source: ICAP Site Census, March 2007
 sites, March 2007 (n=115) Source: ICAP Site Census, March 2007")
44
PMTCT(+) Currently: 115 facilities in 5 countries Developed list of 39 indicators (counseling and testing in ANC, prophylaxis to mother and infant, maternity, follow-up of exposed infant) 95 of 115 sites in 5 countries reported 4 key indicators (Oct-Dec 2006) –Next round will include all 39 indicators Expect close collaboration and communication btwn M&E and PMTCT program staff
 Currently: 115 facilities in 5 countries Developed list of 39 indicators (counseling and testing in ANC, prophylaxis to mother and infant, maternity, follow-up of exposed infant) 95 of 115 sites in 5 countries reported 4 key indicators (Oct-Dec 2006) –Next round will include all 39 indicators Expect close collaboration and communication btwn M&E and PMTCT program staff")
46
ICAP model Family focused care PMTCT is the entry point for HIV-infected women to access care and ART if eligible ANC testing is the first step of the process –But need to go beyond that to ensure that: women are accessing care and treatment and; HIV-exposed infants receive follow-up

47
Women tested in ANC and received results 95 ICAP-supported PMTCT sites, October-December, 2006

48
Women receiving SD-NVP* in ANC 95 ICAP-supported PMTCT sites, October-December, 2006

49
Provision of services to pregnant women in ICAP-supported PMTCT programs in Mozambique, Nigeria, Rwanda, Tanzania (February, 2005-September, 2006)
")
50
Enrollment and outcomes from 20 UTAP supported PMTCT sites in Mozambique, 2006

51
Provision of services to pregnant women in ICAP-supported PMTCT programs in 4 countries (Mozambique, Nigeria, Rwanda, Tanzania) (February, 2005-September, 2006)
 (February, 2005-September, 2006)")
52
Early Infant Diagnosis 4 sites in Tanzania, Oct 1, 2006-March 21, 2007

53
Limitations of aggregate data Cannot evaluate whether pregnant women are enrolled in care and treatment when eligible Difficult to measure efficacy of PMTCT program without linking mother’s PMTCT and infant prophylaxis and infant outcome

54
MTCT-Plus: pMTCT and pregnancy/infant monitoring Example: Following the “index” pregnancy 196 HIV-inf women enrolled ≤ Dec 05, all eventually initiated ART for tx 24: not recently pregnant 172: enrolled AP/ recently PP 153: live births 6: pregnancy ended prior to term 13: unk pregnancy outcome (for investigation) 129: mom rec’d pMTCT/ or initated ART tx 10: mom’s pMTCT unk 14: children not enrolled in M+ (for investigation) 139: children enrolled in M+ Adult women Infants Monitoring for new/subsequent pregnancies at HIV clinical care visits Infant HIV testing & diagnosis Breastfeeding monitoring Clinical monitoring CTX prophylaxis linked by mom’s ID Data source: 2 MTCT-Plus sites (1 in Kenya, 1 in South Africa)
 129: mom rec’d pMTCT/ or initated ART tx 10: mom’s pMTCT unk 14: children not enrolled in M+ (for investigation) 139: children enrolled in M+ Adult women Infants Monitoring for new/subsequent pregnancies at HIV clinical care visits Infant HIV testing & diagnosis Breastfeeding monitoring Clinical monitoring CTX prophylaxis linked by mom’s ID Data source: 2 MTCT-Plus sites (1 in Kenya, 1 in South Africa)")
55
Targeted Evaluations Addresses “Why” Helps identify barriers and facilitating factors Provides details

56
Reasons for not taking SD-NVP among women who received it

57
Newborn brought to health facility for SD-NVP among women who delivered at home If newborn brought to facility, timing of visit

58
Conclusions Excellent uptake of counseling and testing in ANC –MZ: 81% –TZ: 86% –RW: 99% Within countries, seroprevalence in ANC consistent over time TZ: 83% of exposed children receiving PCR; 85% started CTX Linking maternal and infant outcomes Linking mother to Care and Treatment

59
TB/HIV

60
Number of ICAP/CU-supported TB/HIV sites (n=141), March 2007 Source: ICAP Site Census, March 2007
, March 2007 Source: ICAP Site Census, March 2007")
61
TB/HIV Developed list of 20 indicators (TB screening, diagnosis, and treatment; HIV counseling and testing at TB clinics and enrolment into HIV care and treatment) Integrated 4 SOC indicators 114 sites in 6 countries expected to report Jan- March 07 data by end of May 07 Expect close collaboration and communication between M&E and TB/HIV program staff
 Integrated 4 SOC indicators 114 sites in 6 countries expected to report Jan- March 07 data by end of May 07 Expect close collaboration and communication between M&E and TB/HIV program staff")
62
TB Screening among HIV-positive patients receiving care & treatment in ICAP-supported TB Model Centers in Mozambique & Rwanda Mozambique (August-November, 2006)Rwanda (January-December, 2006)
Rwanda (January-December, 2006)")
63
HIV testing among TB patients in ICAP-supported sites in Rwanda and South Africa South Africa (September-December, 2006)Rwanda (January-December, 2006)
Rwanda (January-December, 2006)")
64
Conclusions Good implementation of TB screening in Rwanda and Mozambique (SOC target is over 90%) HIV counseling and testing at TB clinics is efficient way to identify patients Hard to capture linkages data TB clinic HIV clinic; HIV clinic TB clinic
 HIV counseling and testing at TB clinics is efficient way to identify patients Hard to capture linkages data TB clinic HIV clinic; HIV clinic TB clinic")
65
Patient-level data on care and treatment

66
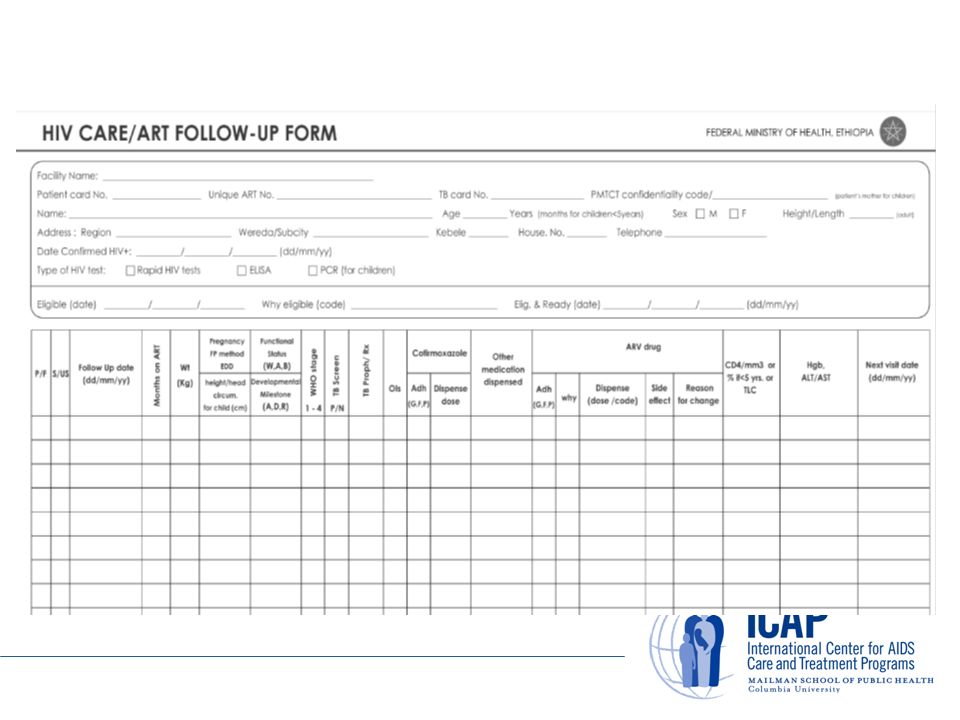
What is meant by patient-level data? Information collected for each patient at every clinic visit: * Clinical data * Laboratory results * Medication * Patient disposition/status

67
Purpose of collecting patient-level data with electronic databases Consistent with MOH priorities Improve quality of care (e.g. tracked missed visits, identify patients who have missed visits) Automate routine reporting (e.g. reduce burden of MOH and other routine reporting) Compare patient outcomes across sites to evaluate models of care
 Automate routine reporting (e.g. reduce burden of MOH and other routine reporting) Compare patient outcomes across sites to evaluate models of care.")
69
Mozambique N=11,557 n (%) 5 facilities Ethiopia N=7197 N (%) 6 facilities Rwanda N=7672 n (%) 7 facilities 6 additional countries N=5844 (adults only) n (%) 6 facilities Total N=32,270 n (%) 24 facilites MTCT-plus supported sites PEPFAR supported 389 (3) 11,168 (97) 0 (0) 7197 (100) 321 (4) 7351 (96) 5844 (100) 0 (0) 6554 (20) 25,716 (80) Female Male Missing 6782 (59) 4677 (40) 98 (<1) 4111 957) 3084 (43) 2 (<1) 4985 (65) 2460 (32) 227 (3) 4874 (83) 963 (16) 7 (<1) 19,048 (59) 10,735 (33) 2487 (8) ART care Non-ART care 3876 (34) 7681 (66) 1185 (16) 6012 (84) 3177 (41) 4495 (59) 2163 (37) 3681 (63) 10,401 (32) 21,869 (68) Age at enrolment: 0-14 y yrs 15-25 yrs 26-35 yrs 36-45 yrs >45 yrs Missing 141 (1) 2069 (18) 4621 (40) 2976 (26) 1750 (15) 0 (0) 716 (10) 1281 (18) 3041 (42) 1589 (22) 570 (8) 0 (0) 585 (8) 1016 (13) 2747 (36) 2156 (28) 1092 (14) 76 (<1) n/a 1860 (32) 3190 (55) 704 (12) 77 (1) 13 (<1) 1446 (4) 6226 (19) 13,599 (42) 7425 (23) 3489 (11) 85 (<1) Patient-level data
 5 facilities Ethiopia N=7197 N (%) 6 facilities Rwanda N=7672 n (%) 7 facilities 6 additional countries N=5844 (adults only) n (%) 6 facilities Total N=32,270 n (%) 24 facilites MTCT-plus supported sites PEPFAR supported 389 (3) 11,168 (97) 0 (0) 7197 (100) 321 (4) 7351 (96) 5844 (100) 0 (0) 6554 (20) 25,716 (80) Female Male Missing 6782 (59) 4677 (40) 98 (<1) ) 3084 (43) 2 (<1) 4985 (65) 2460 (32) 227 (3) 4874 (83) 963 (16) 7 (<1) 19,048 (59) 10,735 (33) 2487 (8) ART care Non-ART care 3876 (34) 7681 (66) 1185 (16) 6012 (84) 3177 (41) 4495 (59) 2163 (37) 3681 (63) 10,401 (32) 21,869 (68) Age at enrolment: 0-14 y yrs yrs yrs yrs >45 yrs Missing 141 (1) 2069 (18) 4621 (40) 2976 (26) 1750 (15) 0 (0) 716 (10) 1281 (18) 3041 (42) 1589 (22) 570 (8) 0 (0) 585 (8) 1016 (13) 2747 (36) 2156 (28) 1092 (14) 76 (<1) n/a 1860 (32) 3190 (55) 704 (12) 77 (1) 13 (<1) 1446 (4) 6226 (19) 13,599 (42) 7425 (23) 3489 (11) 85 (<1) Patient-level data")
70
Mozambique N=11,557 n (%) 5 facilities Ethiopia N=7197 N (%) 6 facilities Rwanda N=7672 n (%) 7 facilities 6 additional countries N=5844 (adults only) n (%) 6 facilities Total N=32,270 n (%) 24 facilities WHO stage at enrolment Stage 1 Stage 2 Stage 3 Stage 4 Missing 1140 (10) 1105 (10) 2465 (21) 451 (4) 6396 (55) 164 (2) 314 (4) 697 (10) 174 (2) 5848 (81) 2042 (27) 1852 (24) 2008 (26) 197 (3) 1573 (20) 3560 (61) 1207 (21) 931 (16) 140 (2) 6 (<1) 6906 (21) 4478 (14) 6101 (19) 962 (3) 13823 (43) CD4 count at enrolment in care: Median (range) 199 (1,1812) n=5282 Missing 328 (0,1996) n=6501 345 (1,1845) n=5120 297 (0,1996) N=16,903 Point of entry into care: pMTCT VCT In-patient Out-patient Other Missing 445 (4) 5286 (46) 530 (5) 2910 (25) 1559 (13) 827 (7) 33 (<1) 3399 (47) 1 (<1) 4 (<1) 756 (11) 3004 (42) 1585 (21) 4710 (61) 400 (5) 158 (2) 396 (5) 423 (6) 5844 (100) 0 (0) 13,395 (42) 931 (3) 7907 (24) 2711 (8) 3072 (10) 4254 (13) Patient-level data
 5 facilities Ethiopia N=7197 N (%) 6 facilities Rwanda N=7672 n (%) 7 facilities 6 additional countries N=5844 (adults only) n (%) 6 facilities Total N=32,270 n (%) 24 facilities WHO stage at enrolment Stage 1 Stage 2 Stage 3 Stage 4 Missing 1140 (10) 1105 (10) 2465 (21) 451 (4) 6396 (55) 164 (2) 314 (4) 697 (10) 174 (2) 5848 (81) 2042 (27) 1852 (24) 2008 (26) 197 (3) 1573 (20) 3560 (61) 1207 (21) 931 (16) 140 (2) 6 (<1) 6906 (21) 4478 (14) 6101 (19) 962 (3) (43) CD4 count at enrolment in care: Median (range) 199 (1,1812) n=5282 Missing 328 (0,1996) n= (1,1845) n= (0,1996) N=16,903 Point of entry into care: pMTCT VCT In-patient Out-patient Other Missing 445 (4) 5286 (46) 530 (5) 2910 (25) 1559 (13) 827 (7) 33 (<1) 3399 (47) 1 (<1) 4 (<1) 756 (11) 3004 (42) 1585 (21) 4710 (61) 400 (5) 158 (2) 396 (5) 423 (6) 5844 (100) 0 (0) 13,395 (42) 931 (3) 7907 (24) 2711 (8) 3072 (10) 4254 (13) Patient-level data")
71
MTCT-Plus patient-level data: Example 1 Plot of CD4 cell count measurements by time on ART for a cohort of 1321 adult patients from 13 sites initiating ART 6m12m18m Data as of August 2005

72
MTCT-Plus patient-level data: Example 2 Plot of CD4 cell count measurements, stratified by baseline CD4 count group, by time on ART for a cohort of 1836 pediatric patients from 13 sites initiating ART Data as of August 2005

73
MTCT-Plus patient-level data: Example 3 Program losses* in a cohort of >2000 adult patients from 13 sites who initiated ART, over time since ART initiation K-M by Gender K-M Overall K-M by Gender Log-rank test (p=0.22) * voluntary program withdrawals, deaths, LTF Data as of August 2005
 * voluntary program withdrawals, deaths, LTF Data as of August 2005")
74
Future patient-level data analyses Measure outcomes (e.g. survival, change in CD4 count) of patients in more ICAP- supported care and treatment programs Identify facility and program-level characteristics that independently influence patient outcomes
 of patients in more ICAP- supported care and treatment programs Identify facility and program-level characteristics that independently influence patient outcomes.")
75
Current assessment of indicator reporting for ICAP-supported activities by country CountrySite Care & TreatmentPMTCTTBHIV Counseling TestingLab Cameroon1 Cote dIvoire2 Ethiopia35 Kenya29 Lesotho5 Mozambique40 Nigeria42 Rwanda37 South Africa41 Swaziland13 Tanzania24 Thailand1 Uganda2 Zambia2 14274222115141103108

76
Key messages and recommendations

77
Discussion Implications for country work plans Ideas for future format for quarterly data meeting How better we can feedback data to country offices? –Currently indicator tables, graphs, line listings –Dataset of indicators for local analysis –PFaCTS summary tables, linelistings, and datasets Future: –Online canned and ad hoc reports from URS –Combine info from all URS modules –Online mapping capabilities from URS –Country profiles (annual, semiannual)? –In-country quarterly data reviews? – Other formats/fora?
. –In-country quarterly data reviews. – Other formats/fora .")
78
Where to find MER outputs P/MER Public Eventually on web

Similar presentations


 Track 1.0 Meeting - Maputo August 2010.>")


: What Will it Take to Eliminate MTCT? Jessica Rodrigues Presentation for UNICEF Written.>")

 Programs in 7 countries: Rosalind Carter, PhD Epidemiologist, PMTCT, Pediatrics.>")


