Download presentation
Presentation is loading. Please wait.

1
Food chains, Food Webs, and Trophic Levels
Energy Transfer Food chains, Food Webs, and Trophic Levels

2
Energy flow Solar energy Producers Consumers

3
Producers/ Autotrophs
Organisms that can make their own food. Ex. Green plants, some protists, algae, and bacteria Add biomass to an ecosystem. Biomass: the organic material produced in an ecosystem

4
Consumers/ Heterotrophs
Organisms that consume organic molecules made by other organisms. Herbivores: eat producers Carnivores: eat other consumers Omnivores: eat producers and consumers

5
Food Chain A single pathway of the feeding relationships in an ecosystem that results in energy transfer.

6
Eagle Mouse Cricket Flowers Snake
For Example Primary producer Primary consumer Secondary consumer Tertiary consumer Quaternary consumer Flowers Cricket Mouse Snake Eagle Eagle Mouse Cricket Flowers Snake

7
Food Web The feeding relationships usually are more complex because organisms feed on more than one type of food. The interrelated food chains in an ecosystem.

8
eagle fox snake mouse cricket rabbit grass

9
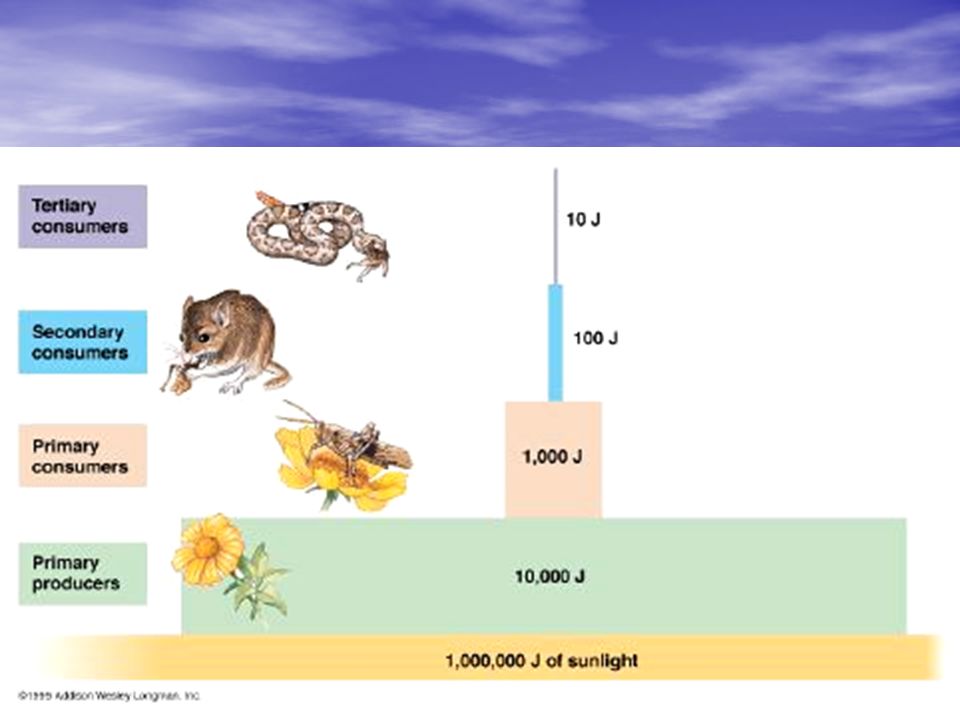
Trophic Levels An organism’s position in the sequence of energy transfers. Producers: 1st trophic level Herbivores: 2nd trophic level Carnivores: 3rd & 4th trophic levels

10
10% Rule Energy is stored in each trophic level in the biomass Generally, only 10% of the energy available at one trophic level is transferred to the next.

11
Most is lost because: not all organisms of a trophic level are eaten, not all molecules of the prey can be used, energy used by prey in cell respiration is not available to the consumer, heat energy is always lost in energy transfer

12
Energy pyramid Greatest amount of biomass and energy found in the lowest trophic level and decreases as it goes up. Energy limits how many levels, usually 3-4 trophic levels.

14
What happens to the biomass?
Decomposers: consumers that cause decay and break down complex molecules into simpler molecules. Makes molecules available for producers to use. This recycles the chemical nutrients. Energy is NOT recycled.

15
What happens when humans destroy habitats or over hunt populations?
Accelerates rate of extinction Decreases biodiversity. Negatively impacts other species because they interact with each other.

16
For example: fisheries
Almost 70% of fisheries are exploited. Compared to 1950’s, the population of big predatory fish, like tuna, has declined 90%.

17
Tuna are large predatory fish
Tuna are large predatory fish. How do you think overfishing effects the marine communities?

18
Think! Generally, what costs more, vegetables or meat? Why? Why don’t we farm carnivores, like bears or wolves?

19
Biogeochemical Cycles

20
Forms of Carbon CO2 in atmosphere and dissolved in water
Carbonate in limestone Organic molecules

21
Forms of Oxygen As oxygen gas in: atmosphere and dissolved in water

22
Carbon and Oxygen Cycle
Carbon fixation (photosynthesis): CO2 is taken from atmosphere and put into organic molecules, while O2 is released.
: CO2 is taken from atmosphere and put into organic molecules, while O2 is released.")
23
Carbon molecules are passed through the food web.
Decomposition: when organic molecules break down, CO2 is released into atmosphere, and some carbon becomes fossil fuels.

24
Cellular Respiration: CO2 is released into atmosphere as O2 is removed.
Combustion: Burning organic matter and fossil fuels uses O2 and releases CO2

25
What happens when we burn lots of fossil fuels?
Global warming?! Greenhouse gases: CO2, methane, water vapor

26
Greenhouse effect: Light energy passes through atmosphere and is absorbed by earth, Infrared radiation (heat) energy is reflected back to atmosphere, Greenhouse gases trap and reflect IR radiation back to Earth.
 energy is reflected back to atmosphere, Greenhouse gases trap and reflect IR radiation back to Earth.")
27
Effects of Global Warming
Changes ecosystems, especially in sensitive polar regions: Melting of polar ice caps and glaciers, sea levels rising. Changing habitat effecting polar bears, penguins Prediction for changes in rainfall, more severe storms.

28
Water cycle Availability of water is critical to life.

29
Water on Earth Oceans & seas – 96.5% Groundwater – 1.7% Lakes, rivers, swamps – < 0.1% Atmosphere – 0.001% Biological – %

30
Water cycle: the movement of water between these various reservoirs.

31
Evaporation- water vapor added to the atmosphere from bodies of water.
Transpiration – water evaporates from leaves of plants.

32
Precipitation – water condenses and leaves atmosphere.
Runoff- water that falls on land eventually flows into rivers and back to the ocean. Percolation- water filters through the soil and reaches the groundwater table.

33
Acid rain Burning fuels releases oxides into the air: nitrogen oxide, sulfur oxide. Combines with water vapor and form acids. Carried through the water cycle. Changes in environmental pH levels is damaging to wildlife.

34
Forms of Nitrogen Nitrogen is used in organisms to make proteins and nucleic acids. N2 gas makes up 78% of atmosphere. Plants cannot use N2 gas.

35
Nitrogen Cycle mutualistic
Nitrogen fixation- converting N2 gas into useable nitrate (NO3) Nitrogen-fixing bacteria- convert N2 to NO3 Live in soil, or in roots of certain plants in a __________ relationship. mutualistic
 Nitrogen-fixing bacteria- convert N2 to NO3. Live in soil, or in roots of certain plants in a __________ relationship. mutualistic.")
36
Plants can absorb nitrates. Animals must consume nitrogen.
Organisms produce nitrogen waste in urine and dung. Bodies of dead organisms contain nitrogen.

37
Ammonification: Decomposers break down material and release ammonium (NH4)
Nitrification: soil bacteria convert NH4 into nitrates. Denitrification: anaerobic bacteria break down nitrates and release nitrogen into the atmosphere.

38
Other Human impact Human activity has had many effects on the natural balance in the ecosystems.

39
Sustainability Human activity is unsustainable by the ecosystem when we use more than the ecosystem can replenish.

40
Renewable resources Rate that the resource is replenished by nature is faster than it is used up. Example: land, forests, air, freshwater

41
Non-renewable resource
rate that the resource is replenished by nature is slower than it is used up. For example: fossil fuels

42
Pollution Substances added into the air, water, or soil by human activity that causes harm.

43
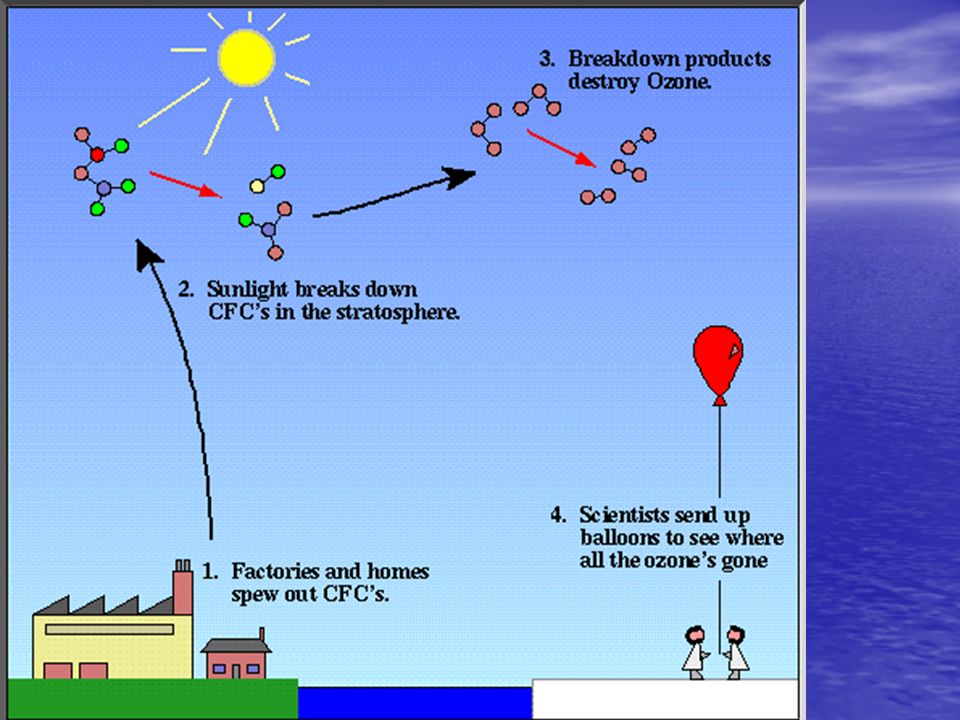
Ozone depletion Ozone (O3) in the stratosphere absorbs UV rays from the sun. Chlorofluorocarbons (CFCs): gases used in refrigerator coolant, aerosol cans, and manufacturing of plastic-foam. CFCs catalyze chain reactions that break down ozone (O3).
: gases used in refrigerator coolant, aerosol cans, and manufacturing of plastic-foam. CFCs catalyze chain reactions that break down ozone (O3).")
44
Ozone depletion Ozone (O3) in the stratosphere absorbs UV rays from the sun. Chlorofluorocarbons (CFCs): gases used in refrigerator coolant, aerosol cans, and manufacturing of plastic-foam. CFCs catalyze chain reactions that break down ozone (O3).
: gases used in refrigerator coolant, aerosol cans, and manufacturing of plastic-foam. CFCs catalyze chain reactions that break down ozone (O3).")
46
Ozone hole history 1956: first measurements of ozone in Antarctica 1985: first paper published on the decline of ozone level in Antarctica

47
Ozone hole cont. Measurements of ozone levels showed a steady decline. 1987: Montreal Protocol banned CFCs by 1995 2050: ozone will be restored

Similar presentations