Download presentation
Presentation is loading. Please wait.

1
Nashville Homeless System Assessment and Right-Sizing Recommendations Project Launch Presentation and Discussion May 7, 2015 Hosted by MHC and MDHA Presentation by Focus Strategies

2
Agenda Overview 1.Welcome & Background - Will Connelly & Erik Cole 2.Presentation by Focus Strategies Who we are/what we do What work we will be doing in Nashville What local stakeholders can expect Examples of results from other communities 3.How This Project Advances Nashville’s Goals for Ending Homelessness – Will C. & Angie Hubbard 4.Questions and Answers

3
Setting the Context Homelessness System in Nashville o Rare, Brief, & One Time o Person-centered: assist individuals/families experiencing homelessness attain permanent housing as quickly as possible o Data-informed o Mediocre performance: continuing the same strategies will yield the same results

4
FocusStrategies.net ABOUT FOCUS STRATEGIES We believe the HEARTH Act and Opening Doors lead the way to finally ending homelessness.

5
FocusStrategies.net A System to End Homelessness Ending homelessness means building systems that: Divert people from becoming homeless Prioritize those with highest needs for housing Quickly engage people in the least expensive intervention to end their homelessness Have short lengths of stay in programs Have high rates of permanent housing exits Maximize cost-effectiveness Use data to achieve continuous improvement

6
FocusStrategies.net Purpose of Our Work in Nashville Assess what the existing homeless system and programs are accomplishing; Identify what is working and what needs improvement; Recommend a new and more comprehensive set of system objectives and strategies to “right size” the homeless system in Nashville; Recommend changes to governance structure to best advance identified strategies

7
FocusStrategies.net Project Overview Activity Timeline BeginEnd Project LaunchMay 2015 Information Gathering Review plans and reports Interview key stakeholders Collect program data (HMIS, budgets) May 2015July/August 2015 Data Analysis – SWAP ToolsJuly/AugustAugust/Sept System Assessment And Right Sizing ReportAugust/SeptSept/Oct In-Person Presentation of ResultsSept/OctOct/Nov Final Report – Governance RecommendationsOct/NovNov/Dec
 May 2015July/August 2015 Data Analysis – SWAP ToolsJuly/AugustAugust/Sept System Assessment And Right Sizing ReportAugust/SeptSept/Oct In-Person Presentation of ResultsSept/OctOct/Nov Final Report – Governance RecommendationsOct/NovNov/Dec")
8
FocusStrategies.net Stakeholder Involvement HMIS data extracted by CoC/HMIS staff Budget data – collected from providers Opportunity to review results, ask questions, request changes Comment on final report

9
FocusStrategies.net Performance Measures to be Analyzed 1.HMIS Data Quality 2.System Capacity in Relation to Need 3.Bed/Unit Utilization 4.Entries from Homelessness 5.Length of Stay 6.Exits to Permanent Housing (PH) 7.Cost per Permanent Housing Exit 8.Returns to Homelessness
 7.Cost per Permanent Housing Exit 8.Returns to Homelessness")
10
FocusStrategies.net Common Themes in Results Data quality compromised in certain programs or fields Array of programs not precisely matched to populations Rapid re-housing outperforms transitional housing Within program types, superstars and low performers Across program types, highest need households not prioritized and served/housed Returns to homelessness not significant issue

11
FocusStrategies.net Typical & Sample Results Performance Improvement Calculator (PIC), averages over 14 communities across country – PIC is system right-sizing tool developed by FS for National Alliance to End Homelessness Communities with comparable characteristics – Richmond, Virginia – Pierce County, Washington – Winston-Salem/Forsyth County, North Carolina
, averages over 14 communities across country – PIC is system right-sizing tool developed by FS for National Alliance to End Homelessness Communities with comparable characteristics – Richmond, Virginia – Pierce County, Washington – Winston-Salem/Forsyth County, North Carolina")
12
FocusStrategies.net Match: Population to Resources Richmond, Virginia, Presented at Virginia’s Governor’s Housing Conference, November 2013

13
FocusStrategies.net SYSTEM Performance

14
FocusStrategies.net W-S/F Adult Household Entries to TH More than half of entries into Transitional Housing were from Housed Locations, which is typical

15
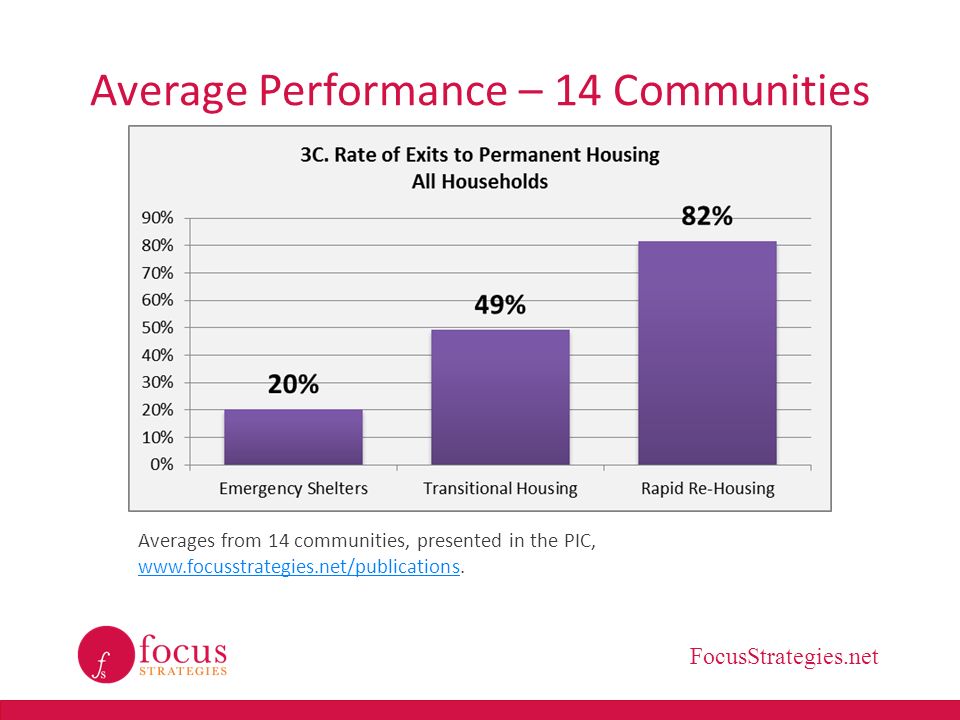
FocusStrategies.net Average Performance – 14 Communities Averages from 14 communities, presented in the PIC, www.focusstrategies.net/publications. www.focusstrategies.net/publications
16
FocusStrategies.net Investments: Wide Variation in Performance Pierce County, Washington, 2013 data compared with national averages from PIC, 2011-12 data Average Cost Per Unit Pierce CountyNational Averages Unit Type Adult OnlyFamilyTotalAdult OnlyFamilyTotal ES$1,181$7,162$2,285$10,000$13,333$11,034 TH$4,954$15,246$10,560$10,588$12,500$11,707 PSH$7,335$10,763$7,660$13,514$18,750$15,094

17
FocusStrategies.net Measuring Cost vs. Cost Effectiveness Typical: Cost per bed or unit Outcomes-oriented: Cost per permanent housing exit

18
FocusStrategies.net Cost Effectiveness Averages from 14 communities across the country, presented in the Performance Improvement Calculator, www.focusstrategies.net/publications.www.focusstrategies.net/publications

19
FocusStrategies.net Winston-Salem/Forsyth County Cost-Effectiveness 2011-13 HMIS and budget data – Presented at July 2013 National Alliance to End Homelessness Conference W-S/F & Nashville have similar population & inventory distributions

20
FocusStrategies.net WITHIN PROGRAM TYPES Performance

21
FocusStrategies.net Sample Results from Averaged Dataset, Distribution of Results Typical

22
Solving Homelessness in Nashville Homelessness is preventable, and solvable. We have demonstrated that we know how to end homelessness for many: o 900 people experiencing chronic homelessness housed in 2013/2014. o 240 Veterans/chronic housed already between Jan and March 2015. o 77% retained housing for at least 1 year.

23
Solving Homelessness in Nashville We must now pivot to our next chapter, learning from the past and anticipating future needs. o Ensure more people are prevented/diverted from homelessness. o Move beyond chronic and Veteran homelessness to include families and youth. o Realign our housing and services to match the strengths and needs of people experiencing homelessness. o Engage and hold accountable the whole community in the solution.

24
What Success Looks Like o Fewer people experiencing homelessness, and more housed. o Homelessness for fewer days. o Fewer returns to homelessness. o Increased support and accountability from all partners. o A framework to help guide our community’s focus and future funding decisions.

25
Questions

Similar presentations


 Webinar Series Priority 1/Surge National Kick-Off October 16, 2014.>")


