Download presentation
Presentation is loading. Please wait.

1
Unit 2 Supply & Demand

2
Demand Basics Demand Schedule and Demand Curve

3
Demand Basics Demand versus Quantity Demanded Demand- quantities consumers are willing and able to buy at various prices Quantity Demanded- quantity consumers are willing and able to buy at a given price

4
Demand Basics Demand versus Quantity Demanded Demand- the whole curve Quantity Demanded- a point on the curve

5
Demand Basics Demand versus Quantity Demanded Change in Demand- the whole curve shifts Change in Quantity Demanded- move from one point on the curve to another

6
Demand Basics Changes in Demand –C–Consumer Income Normal v. Inferior Goods –P–Population –P–Preference/Taste –P–Price of Other Goods Compliments Substitutes –E–Expectation of Change in Price

7
Why Demand Slopes Downward? Income Effect Substitute Effect Diminishing Marginal Utility

8
Why Demand Slopes Downward? Income Effect –Higher price = Lower purchasing power –Lower price = Higher purchasing power –“ability to buy”

9
Why Demand Slopes Downward? Substitute Effect- think opportunity cost –Higher price = Lower relative price of substitutes –Lower price = Higher relative price of substitutes

10
Why? 1 st pizza for full price ($11.00), get a 2 nd for $5?
, get a 2 nd for $5")
11
Why? Buy one pair at regular price and get the second pair half off? BOGO Days!

12
Why Demand Slopes Downward? Diminishing Marginal Utility

13
Why Demand Slopes Downward? Diminishing Marginal Utility –MU= satisfaction quantified in dollars of an additional unit of consumption –Marginal Utility ALWAYS* decreases with additional consumption

14
Why Demand Slopes Downward? Diminishing Marginal Utility/Benefit Cost-Benefit Analysis –How many slices will you consume? –MU=MC –MB=MC

15
Individual & Market Demand Curve Horizontal sum of individual demand curves

16
Supply Basics Supply Schedule and Supply Curve

17
Supply Basics Supply versus Quantity Supplied Supply - quantities producers are willing and able to sell at various prices Quantity Supplied- quantity producers are willing and able to sell at a given price

18
Supply Basics Supply versus Quantity Supplied Supply - the whole curve Quantity Supplied- a point on the curve

19
Supply Basics Change in Supply - the whole curve shifts Change in Quantity Supplied- move from one point on the curve to another

20
Supply Basics- Changes # of Producers Technology Price of Inputs Substitutes of Production Compliments of Production Taxes and Subsidies Other Regulations

22
Individual & Market Supply Curve Horizontal sum of individual supply curves

24
What if they both shift? Equilibrium Price? Equilibrium Quantity? One change is certain The other is ambiguous

25
What if they both shift? Coffee –New Rebecca Black Song –New Fertilizer

26
What if they both shift? Same Shift- know Q Opposite Shift- know P

27
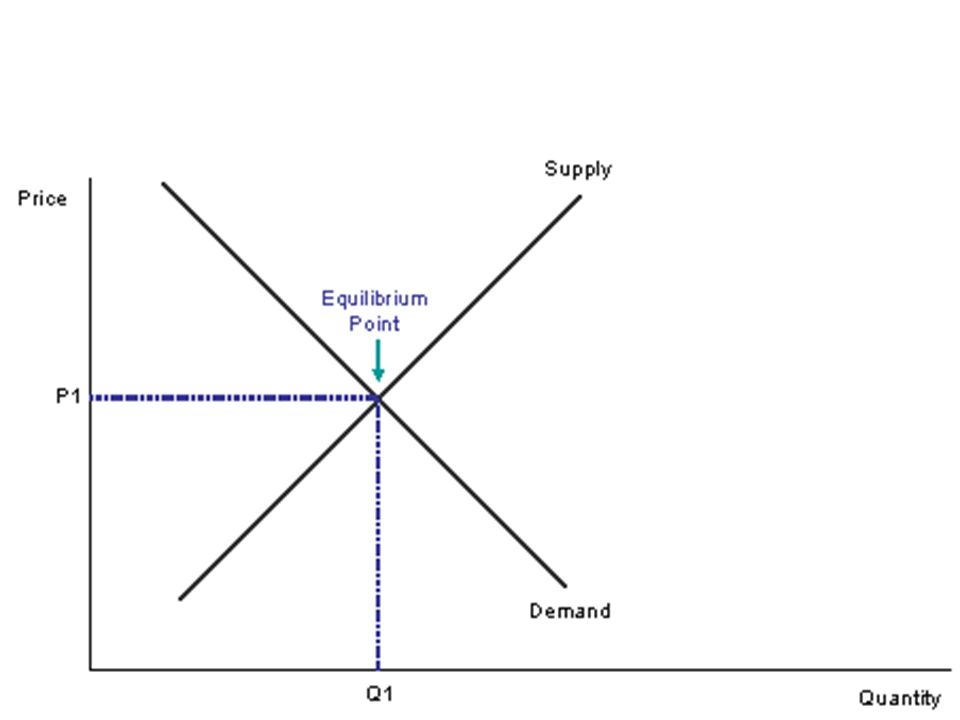
Equilibrium Price = Market Clearing Price

28
Let’s Review Shifts Double Shifts Ceilings and Floors Shortage and Surplus ------------------------------------------ Quantifying Shortage and Surplus Other Effects of Ceilings and Floors

34
PED

35
Relationship between % change in price and % change in quantity

36
PED Perfectly Inelastic = 0 Unit Elastic = 1 Perfectly Elastic =

37
PED Perfectly Inelastic = 0 Unit Elastic = 1 Perfectly Elastic = Inelastic <1 Unit Elastic = 1 Elastic > 1

38
If the market price is above equilibrium price…

39
If the market price is below equilibrium price…

42
S & D for Non-Smart Phones (inferior good) Decrease in unemployment P Q
 Decrease in unemployment P Q")
43
S & D for Non-Smart Phones (inferior good) Increase in the price of Smart Phones P Q P Q
 Increase in the price of Smart Phones P Q P Q")
44
S & D for Non-Smart Phones (inferior good) Gov’t subsidy for the production of smart phones P Q P Q
 Gov’t subsidy for the production of smart phones P Q P Q")
45
Price Controls Effects beyond Surpluses and Shortages

46
BOTH reduce the quantity of a good bought and sold

47
Price Ceilings Shortages Inefficiencies Black Markets

48
Price Ceilings- Inefficiencies Misallocation of Resources –Need and willingness to pay Wasted Resources –Time and money spent overcoming the shortage Inefficiently Low Quality

49
Price Ceilings- Black Markets Illegal Markets Prices ABOVE equilibrium –Prices account for additional cost in the form of risk

50
How to stop Canal Street Sales?

51
Price Ceilings Non-Binding Set above equilibrium Market prices will remain below the ceiling

52
Price Floors Non-Binding Set below equilibrium Market prices will remain above the floor

53
Price Floors Surpluses Inefficiencies Black Markets

54
Price Floors- Inefficiencies Misallocation of Resources –Those willing to sell at the lowest price do not always succeed Wasted Resources Inefficiently High Quality

55
Price Floors- Black Markets Illegal Markets Prices below equilibrium –Prices account for the relatively low number of consumers willing to break the law

Similar presentations