Download presentation
Presentation is loading. Please wait.

1
Influence of Nutrition and Stress on Sugar Maple at a Regional Scale Scott W. BaileyRichard A. Hallett Robert P. Long Stephen B. Horsley Philip M. Wargo USDA Forest Service, Northern Research Station

2
Sugar Maple Decline Scattered, episodic occurrences First documented in 1913 Increasing frequency since 1960 Throughout range (WI, ON, QC, VT, MA) Recent declines in northern Pennsylvania
 Recent declines in northern Pennsylvania")
3
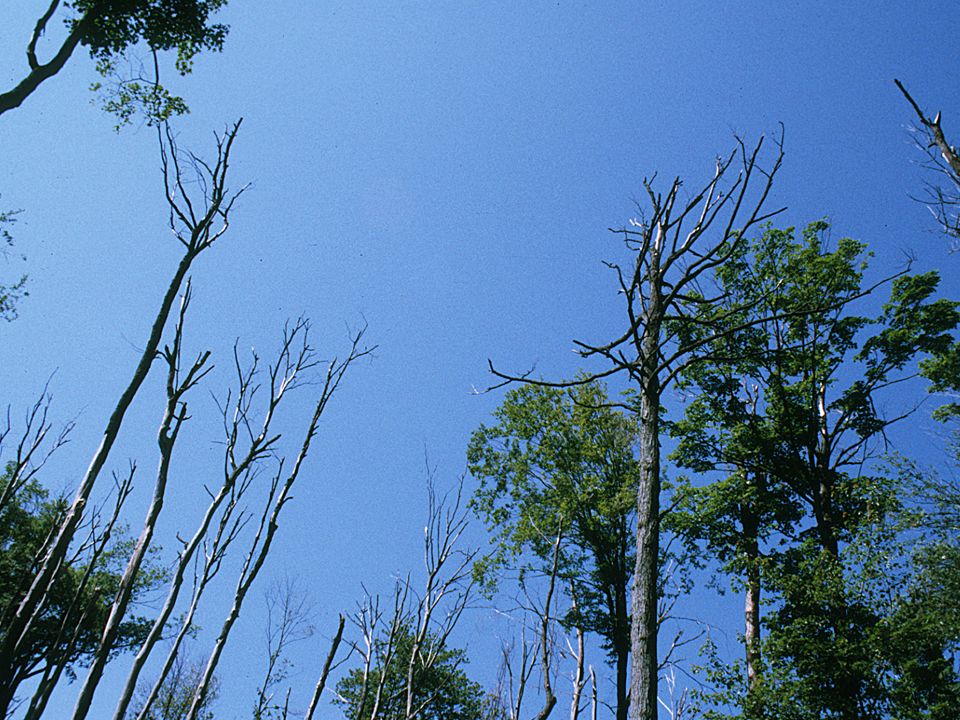
Symptoms of Declines Reduced growth Shoot and diameter Shorter internodes produce tufted appearance Premature fall coloration Unusual levels of twig and branch dieback Individual trees showing these symptoms are randomly dispersed in the stand.

4
Decline Disease Characteristics Interaction of multiple causal factors Abiotic and biotic factors Gradual general deterioration, often ending in death of trees Often poorly understood after Manion (1991) Tree Disease Concepts
 Tree Disease Concepts")
5
Stress Factors 1. Predisposing factors Imbalanced Nutrition Calcium Magnesium Manganese (Aluminum)
")
6
Stress Factors 2. Inciting factors Defoliating Insects Drought Soil Freezing Winter Injury

7
3. Contributing factors Fungi (esp. Armillaria) Borers Viral infections Stress Factors
 Borers Viral infections Stress Factors")
8
The Allegheny Problem 1994 survey showed 38,000 hectares with severe mortality on the Allegheny National Forest An additional 19,000 hectares with severe mortality were on state forests across the northern tier Sugar maple is the most severely impacted species with unusual mortality levels first noted in the early 1980’s

11
Dead Basal Area % Vigor Class upperlowerupperlower unglaciatedglaciated 1 2 3 0 10 20 30

12
Foliar N % P K 0.3 0.6 0.05 0.10 1.0 2.0 0.9 0.15 upperlowerupperlower unglaciatedglaciated

13
Foliar Ca % Mg Mn upperlowerupperlower unglaciatedglaciated 0 0.1 0.2 0 0.05 0.10 0 0.5 1.0

14
Insect Defoliation Between 1984 and 1996 eighty-six percent of the Allegheny National Forest received from 1 to 5 moderate to severe defoliations by: Fall Cankerworm, elm spanworm, forest tent caterpillar, saddled prominent, gypsy moth and pear thrips.

15
Dead Maple (% Basal Area) Foliar Magnesium (%) 0 10 20 30 40 50 0.05 0.10 0.15
 Foliar Magnesium (%)")
16
Vermont and New Hampshire Stands The additional stands were all glaciated and the till quality was variable. The range in nutrient status was similar to the stands in PA/NY. Generally lacked defoliation events during the past 20 years.

17
Foliar Nutrients 3300 300600900 1200150018002100240027003000 Calcium Magnesium PA/NY NH/VT 2000430066008900 11200135001580018100204002270025000 PA/NY NH/VT 5500 ppm 700 ppm ? ? Will these low nutrient status stands that have NOT been stressed have poorer health?

18
Sugar Maple Fine Twig Dieback vs. Foliar Mg and Ca Foliar Ca (ppm) Sugar Maple Dieback Plateau - mild defoliation Plateau - severe defoliation Foliar Mg (ppm) Sugar Maple Dieback 05000100001500020000 25000 30000 0% 5% 10% 15% 20% 25% 050010001500200025003000 0% 5% 10% 15% 20% 25% Northern New England Health Threshold
 Sugar Maple Dieback Plateau - mild defoliation Plateau - severe defoliation Foliar Mg (ppm) Sugar Maple Dieback % 5% 10% 15% 20% 25% % 5% 10% 15% 20% 25% Northern New England Health Threshold.")
19
Dead Sugar Maple Basal Area 0% 5% 10% 15% 20% 25% 30% 35% 40% NH/VTPA/NY Low Defoliation Stress High Defoliation Stress High Mg High Ca Low Mg Low Ca Putting it all together: Stress, Ca, Mg, and Dead Sugar Maple Defoliation stress does not impact SM mortality when nutrient thresholds are exceeded. In addition SM mortality is not effected in low nutrient status stands when defoliation stress is low. However when nutrient status is low AND trees are stressed, sugar maple mortality increases.

20
Fine Twig Dieback 0% 5% 10% 15% NH/VTPA/NY Low Defoliation Stress High Defoliation Stress High MgHigh Ca Low MgLow Ca Putting it all together: Stress, Ca, Mg, and Fine Twig Dieback Fine twig dieback is a less severe health indicator than mortality. Again, adequate nutrients result in good health regardless of stress. However we see that poor nutrient status results in poorer health even when there is no defoliation stress.

21
Fine Twig Dieback 0% 5% 10% 15% NH/VTPA/NY Low Defoliation Stress High Defoliation Stress Low MnHigh Mn Putting it all together: Manganese Toxicity Dead Sugar Maple Basal Area 0% 5% 10% 15% 20% 25% 30% 35% 40% NH/VTPA/NY Low Defoliation Stress High Defoliation Stress High Mn Low Mn High Mn High Manganese and high stress result in higher mortality and more fine twig dieback. But again we see that even without defoliation stress, high Mn results in poorer health in NH/VT. Although Mn is an essential nutrient, in high enough quantities it becomes toxic to sugar maple trees.

22
These data suggest that low Mg and Ca OR high Mn AND excessive stress (≥2 moderate – severe defoliations in 10 years) are required for mortality to occur. In addition poor nutrient status stands that have not been severely stressed are likely to be less healthy and are considered to be at risk. Sugar Maple Health: Regional Implications Calcium 2000 4300 6600 8900 11200 13500158001810020400 2270025000 PA/NY NH/VT 5500 ppm 3300 300 600900 120015001800 2100 240027003000 Magnesium PA/NY NH/VT 700 ppm

23
Growth and Health Available Base Cations - Net Photosynthesis - Carbohydrate Supply Secondary Stressors + + + Available Al Available Mn Acidification - - + + - - Conceptual Model Defoliation Deep soil freezing Drought Air pollution Root compaction Armillaria Reduce chlorophyll Reduce Photosynthesis Interfere with carb transport Acid rain also increases Al availability which along with Mn can have a negative impact on available Ca and Mg.

24
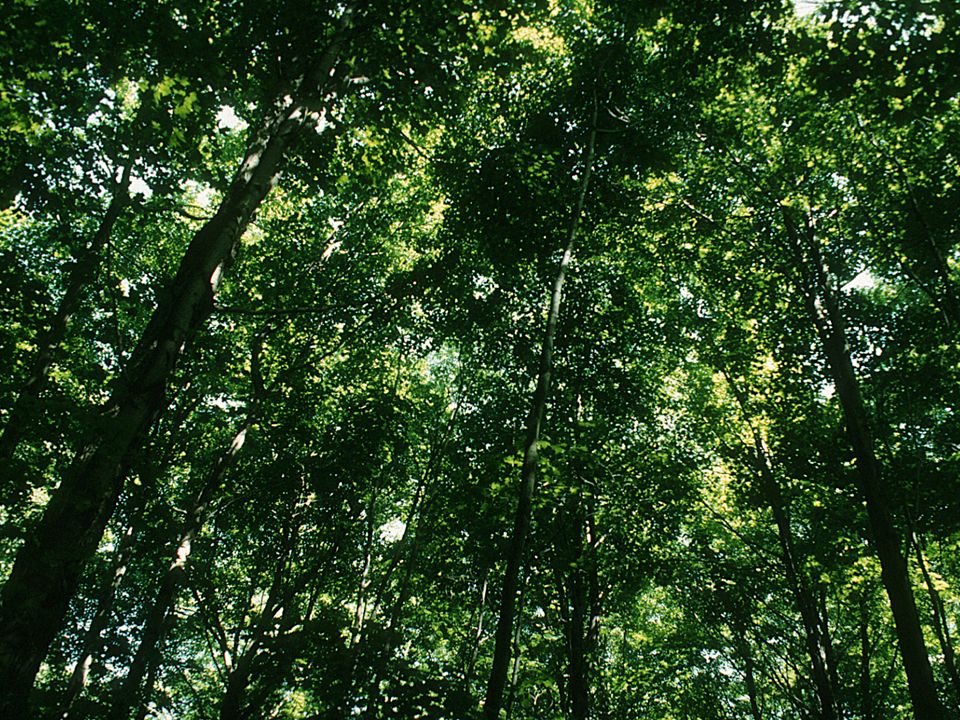
Summary Overall, sugar maple health region-wide is good. However, decline syndrome is a concern range-wide. Tailoring management to site specific conditions can minimize occurrence of decline.

25
Recommendations Choosing appropriate sites for sugar maple culture. Examining nutrition. Monitoring stress events. Managers can take positive steps to maintain the health of sugar maple by:

Similar presentations