Download presentation
Presentation is loading. Please wait.

1
What factors are most responsible for height?
Outcome = (Model) Error
 + Error.")
2
Analytics & History: 1st Regression Line
The first “Regression Line”

3
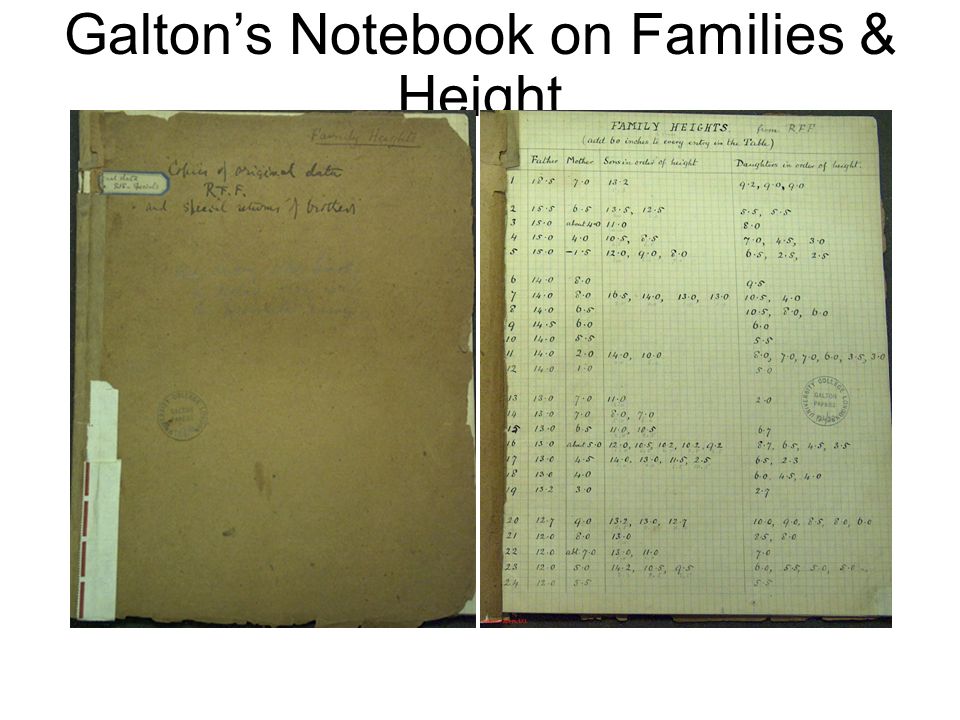
Galton’s Notebook on Families & Height
4
Galton’s Family Height Dataset
X1 X2 X3 Y

5
> getwd() [1] "C:/Users/johnp_000/Documents" > setwd()
![> getwd() [1] C:/Users/johnp_000/Documents > setwd()](http://slideplayer.com/slide/6421384/22/images/5/%3E+getwd%28%29+%5B1%5D+C%3A%2FUsers%2Fjohnp_000%2FDocuments+%3E+setwd%28%29.jpg "> getwd() [1] C:/Users/johnp_000/Documents > setwd()")
6
Dataset Input h <- read.csv("GaltonFamilies.csv") Object Function
Filename Data()
")
7
str() summary() Data Types: Numbers and Factors/Categorical
 summary() Data Types: Numbers and Factors/Categorical")
8
Outline One Variable: Univariate Two Variables: Bivariate
Dependent / Outcome Variable Two Variables: Bivariate Outcome and each Predictor All Four Variables: Multivariate

9
Variable Type Steps Y X1, X2 X3 Histogram Child’s Height Continuous
Dad’s Height X1, X2 Scatter Continuous Mom’s Height X3 Gender Categorical Boxplot Linear Regression

10
Frequency Distribution, Histogram
hist(h$child) Frequency Distributions: A graph plotting values of observations on the horizontal axis, with a bar showing how many times each value occurred in the data set.
 Frequency Distributions: A graph plotting values of observations on the horizontal axis, with a bar showing how many times each value occurred in the data set.")
11
Density Plot plot(density(h$childHeight)) Area = 1
) Area = 1")
12
Mode, Bimodal hist(h$childHeight,freq=F, breaks =25, ylim = c(0,0.14))
curve(dnorm(x, mean=mean(h$childHeight), sd=sd(h$childHeight)), col="red", add=T)
, sd=sd(h$childHeight)), col= red , add=T)")
13
Asst. Professor of Statistics at Rice University
Industries / Organizations Creating and Using R Hadley Wickham Asst. Professor of Statistics at Rice University Industry Pct. Research 24% Higher Education 7% Information Technology 9% Computer Software Financial Services 6% Banking 2% Pharmaceuticals 4% Biotechnology Market Research 3% Management Consulting Total 69% ggplot2 plyr reshape rggobi profr Source: LinkedIN R Group (Sept, 2011)
")
14
ggplot2 library(ggplot2) h.gg <- ggplot(h, aes(child))
h.gg + geom_histogram(binwidth = 1 ) + labs(x = "Height", y = "Frequency") h.gg + geom_density()
 + labs(x = Height , y = Frequency ) h.gg + geom_density()")
15
ggplot2 h.gg <- ggplot(h, aes(child)) + theme(legend.position = "right") h.gg + geom_density() + labs(x = "Height", y = "Frequency") h.gg + geom_density(aes(fill=factor(gender)), size=2)
), size=2)")
16
Variable Type Steps Y X1, X2 X3 Histogram Child’s Height Continuous
Dad’s Height X1, X2 Scatter Continuous Mom’s Height X3 Gender Categorical Boxplot Linear Regression

17
Correlation and Regression

19
Covariance Calculate the difference between the mean and each person’s score for the first variable (x). Calculate the difference between the mean and their value for the second variable (y). Multiply these “error” values. Add these values to get the cross product deviations. The covariance is the average of cross-product deviations
. Multiply these error values. Add these values to get the cross product deviations. The covariance is the average of cross-product deviations.")
20
Covariance Y X Persons 2,3, and 5 look to have similar magnitudes from their means

21
Covariance Calculate the error [deviation] between the mean and each subject’s score for the first variable (x). Calculate the error [deviation] between the mean and their score for the second variable (y). Multiply these error values. Add these values and you get the cross product deviations. The covariance is the average cross-product deviations:
![Covariance Calculate the error [deviation] between the mean and each subject’s score for the first variable (x).](http://slideplayer.com/slide/6421384/22/images/21/Covariance+Calculate+the+error+%5Bdeviation%5D+between+the+mean+and+each+subject%E2%80%99s+score+for+the+first+variable+%28x%29..jpg "Calculate the error [deviation] between the mean and their score for the second variable (y). Multiply these error values. Add these values and you get the cross product deviations. The covariance is the average cross-product deviations:")
22
Standardizing the Covariance
Covariance depends upon the units of measurement Normalize the data Divide by the standard deviations of both variables. The standardized version of covariance is known as the correlation coefficient

23
Correlation ?cor cor(h$father, h$child)
")
24
Scatterplot Matrix: pairs()
")
25
Correlations Matrix library(car) scatterplotMatrix(heights)
 scatterplotMatrix(heights)")
26
ggplot2

27
Variable Type Steps Y X1, X2 X3 Histogram Child’s Height Continuous
Dad’s Height X1, X2 Scatter Continuous Mom’s Height X3 Gender Categorical Boxplot Linear Regression

28
Box Plot

29
Children’s Height vs. Gender
boxplot(h$child~gender,data=h, col=(c("pink","lightblue")), main="Children's Height by Gender", xlab="Gender", ylab="")
), main= Children s Height by Gender , xlab= Gender , ylab= )")
30
Descriptive Stats: Box Plot
69.23 64.10 ====== 5.13

31
Subset Males men<- subset(h, gender=='male')
")
32
Subset Females women <- subset(h, gender==‘female')
")
33
Children’s Height: Males
hist(men$childHeight) qqnorm(men$childHeight) qqline(men$childHeight)
 qqnorm(men$childHeight) qqline(men$childHeight)")
34
Children’s Height: Females
hist(women$child) qqnorm(women$child) qqline(women$child)
 qqnorm(women$child) qqline(women$child)")
35
ggplot2 library(ggplot2)
h.bb <- ggplot(h, aes(factor(gender), child)) h.bb + geom_boxplot() h.bb + geom_boxplot(aes(fill = factor(gender)))
, child)) h.bb + geom_boxplot() h.bb + geom_boxplot(aes(fill = factor(gender)))")
Similar presentations


 STEM & LEAF BOXPLOT BIVARIATE SCATTERPLOT (review correlation) Overlays; jittering Regression line.>")


![Project Categories and Questions How to improve [Financial Metric]? Business Science What Determines Height? Government Sports How are School Districts.](/22/6412081/big_thumb.jpg "Project Categories and Questions How to improve [Financial Metric]? Business Science What Determines Height? Government Sports How are School Districts.>")