Download presentation
Presentation is loading. Please wait.

1
Sales Management 8 Estimating Demand

2
Time Sales 0 Market Potential Industry Forecast Company Potential Company Forecast (Industry Forecast ≤ Market Potential) (Company Forecast ≤ Company Potential)
 (Company Forecast ≤ Company Potential)")
3
Key Terms Market Potential: All possible sales Industry Forecast: Likely sales, all companies Company Potential: All possible sales for one company Company Sales Forecast: Likely company sales NB: All figures are expressed for a period of TIME.

4
So how do you estimate demand? Determine WHO will use the product. –Which segment(s)?; Size? Determine their RATE of use. –New/Replacement; Frequency. WHO buys product? –Purchasing agent, parent, lover, uncle WHAT is their motivation to purchase? –Life event, new business, new market, fun
 ; Size. Determine their RATE of use. –New/Replacement; Frequency. WHO buys product. –Purchasing agent, parent, lover, uncle WHAT is their motivation to purchase. –Life event, new business, new market, fun.")
6
Why Forecast Sales? Allocate resources Control operations Project Cash Flow (Important!) Capital/operating budgets Production schedules & Inventory control Hiring; collective bargaining Planning marketing and sales plans
 Capital/operating budgets Production schedules & Inventory control Hiring; collective bargaining Planning marketing and sales plans.")
7
Methods of Forecasting Subjective –Users’ Expectations –Sales Force Composite –Jury of Executive Opinion Delphi Technique

8
Users’ Expectations Also called Buyers’ Intentions method Focus Groups Surveys Intention ≠ Behavior, but does correlate

10
Sales Force Composite Salespeople are boundary-spanners Close to customers, competitors Fingers on the pulse of the market Survey sales force, and add up estimates Good starting point; need adjustment

12
Jury of Executive Opinion Top/key executives, perhaps outside consultants, give best estimate Not boundary spanners, but see “Big Picture” May need discussion to reach an estimate that everyone can agree on

13
Group Think

14
Delphi Technique Similar to Executive Opinion Iterative/Secret Process Convergence

15
Methods of Forecasting Objective –Market Test –Time Series Analysis Moving Averages Exponential Smoothing Decomposition –Statistical Demand Analysis

16
Test Market Pick “representative” city Full marketing effort Extrapolate results to rest of nation Expensive Takes time Tip your hand Competitors can skew results

17
Time Series Analysis Use historical (not hysterical) data to predict future Like driving by looking in the rear-view mirror Estimate starts in “ballpark” (not the franks)
 data to predict future Like driving by looking in the rear-view mirror Estimate starts in ballpark (not the franks)")
18
Moving Averages Average last n (=2,4, whatever) years sales to predict the coming year 2005: 5,000 units 2006: 8,000 units 2007: 8,000 units 2008: 7,000 units estimated
 years sales to predict the coming year 2005: 5,000 units 2006: 8,000 units 2007: 8,000 units 2008: 7,000 units estimated")
19
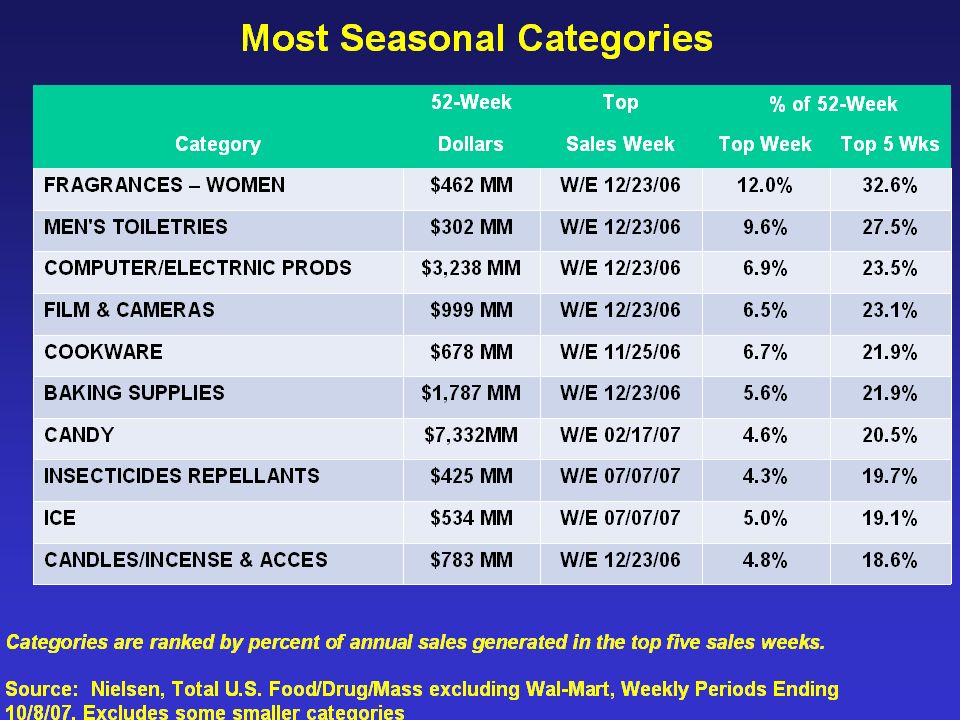
Decomposition Apply to monthly or quarterly data Account for: –Trends –Cycles –Seasons –Random occurrences

21
Statistical Demand Analysis Use regression or other techniques to determine relationship between sales and predictor factors. Need good data and analytical skills. Example: –Home heating oil demand = Function of temperature, sun, last fill, tank size, & history.

22
What do companies use? They tend to rely more heavily on qualitative than quantitative. Especially sales force composite and jury of executive opinion. Easier, quicker, perhaps accurate enough

23
Sales Territories Design territories –Need a market index to compare Industrial Goods –Standard Industrial Classification –North American Industrial Classification System Consumer goods –Buying Power Index = (5I + 2P + 3R)/10 % disposable personal Income % US Population % total Retail sales
/10 % disposable personal Income % US Population % total Retail sales")
Similar presentations