Download presentation
Presentation is loading. Please wait.

1
Weather…Climate… Climate Change… Ozone Depletion…
…what does it all MEAN?

2
Question: What’s in the atmosphere?
Ar (0.9%) WV CO2 O3 Particulates (greenhouse gas) (greenhouse gas)
 WV. CO2. O3. Particulates. (greenhouse gas) (greenhouse gas)")
3
Thermosphere

4
TROPOSPHERE Gases here moderate flow of energy to E.
10 mi tropics; 5 mi higher lats. Contains all the WV & clouds. Weather occurs here! Temp ↓ as altitude ↑. Pollutants can rise to top within days... TROPOPAUSE caps it...temp stops decreasing.

5
(higher...) STRATOSPHERE
Temp ↑ as altitude ↑... Contains O3 (it absorbs radiation). Persistent substances
. Persistent substances.")
7
What happens to TEMP as you go farther away from E
What happens to TEMP as you go farther away from E? Why does it warm up in the stratosphere?

8
What happens to the TEMP as you move farther from E?

9
Good to know... Weather: day-to-day variations in temp, precip, wind, pressure, & humidity. Climate: long-term regional weather patterns. Factors affecting climate: Latitude Atmospheric circulation Oceanic circulation Topography Solar activity Volcanic activity

10
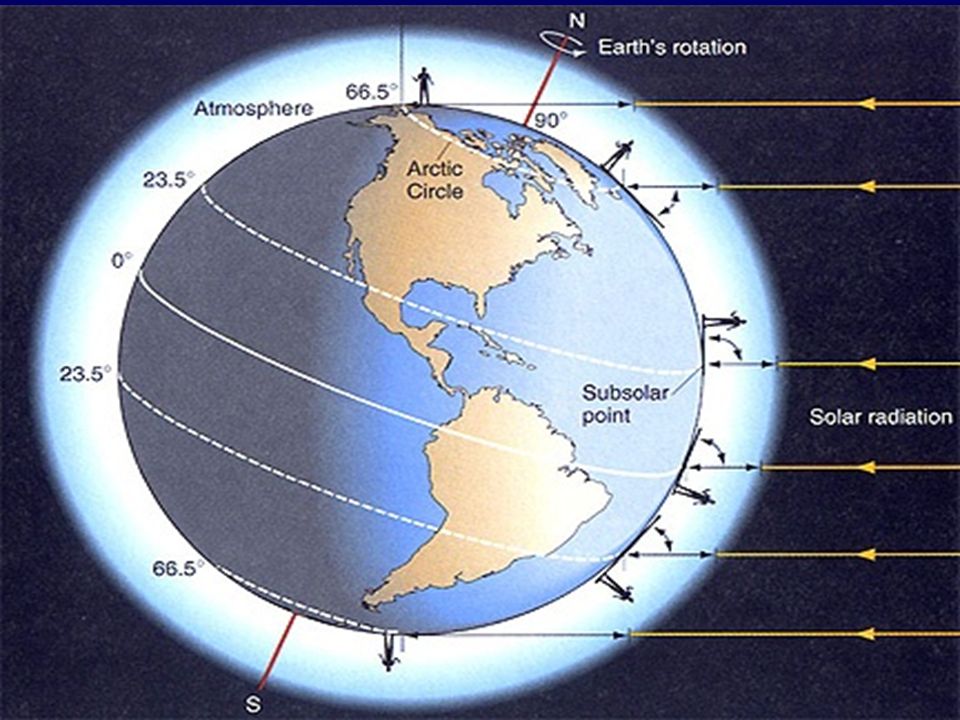
Latitude

11
Latitude LOW latitudes close to equator receive more direct (vertical) rays; more concentrated E per surface area. No winter…no summer…all hot. HIGH latitudes receive less direct (oblique) rays; less concentrated E per surface area. Wider temp range, seasons!
 rays; less concentrated E per surface area. Wider temp range, seasons!")
12
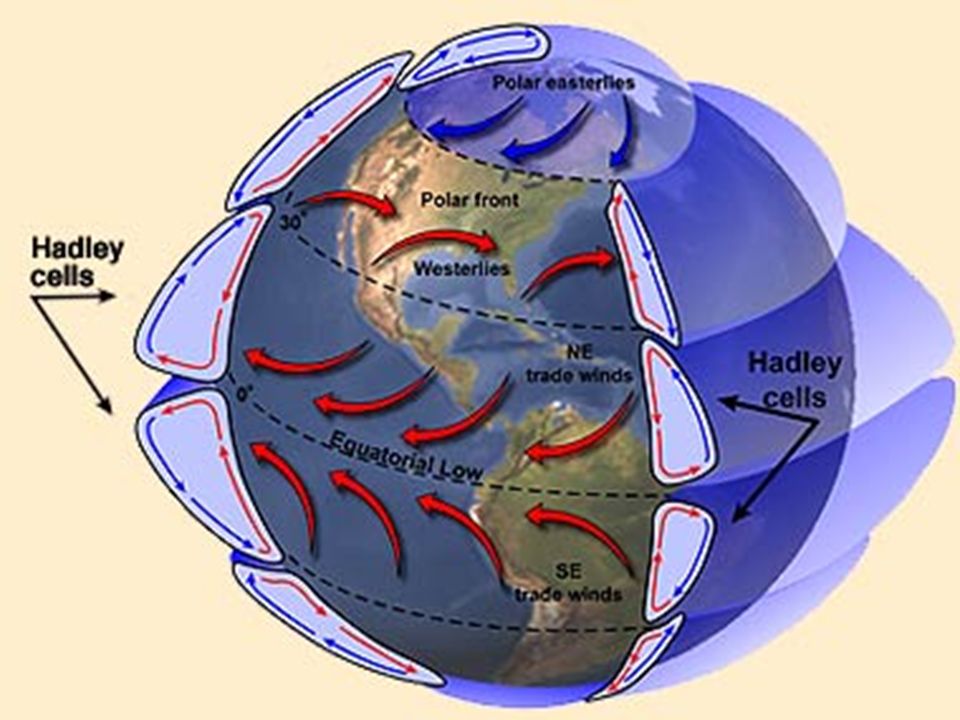
Atmospheric Circulation (wind…) Warm air rises (low pressure...) Cold air sinks (high pressure...) Pressure flows from HIGH to low
 Warm air rises (low pressure...) Cold air sinks (high pressure...) Pressure flows from HIGH to low.")
14
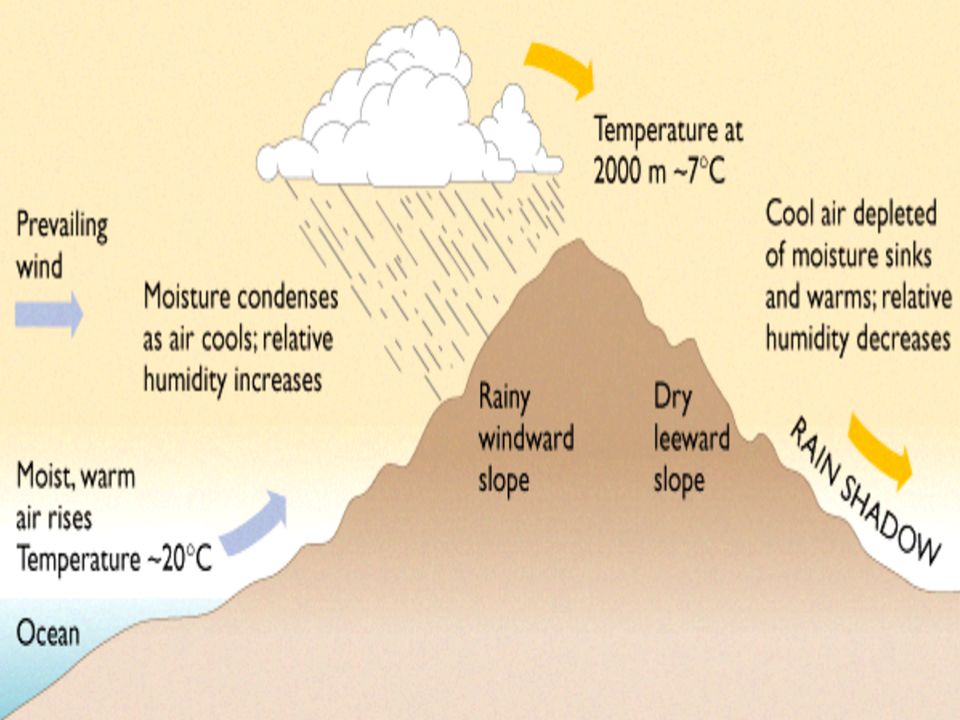
Latent Heat Warm air holds more WV than cool air
Warm air rises (less dense) As moist/warm air rises, it cools & WV condenses to liquid…clouds form… Latent heat (“trapped” in WV) is released Energy source for t-storms, tornadoes, hurricanes. QUESTION: will increased temps lead to more WV…more latent heat…resulting in more intense severe weather?
 As moist/warm air rises, it cools & WV condenses to liquid…clouds form… Latent heat ( trapped in WV) is released. Energy source for t-storms, tornadoes, hurricanes. QUESTION: will increased temps lead to more WV…more latent heat…resulting in more intense severe weather")
15
How OCEANS affect temp... HEAT CAPACITY: water stores heat more effectively than solid earth (heats up & cools more slowly than land). HEAT TRANSFER: ocean currents carry warm equatorial water towards poles. SOURCE for WV: when wv condenses in the atmosphere it releases latent heat.

16
Surface Currents

17
One cycle: 1,000 years

18
El Nino-Southern Oscillation (ENSO)
")
20
Solar Maximum - Increased UV - Increased O3 - Increased temps

21
- SO2 gas reaches upper atmosphere. SO2 & dust & WV form haze. - Haze reflects sun- light, global temps decrease.

22
…the seasons! And finally…

23
Greenhouse Effect Analogy: sunlight pours into your car & heats up the interior (gets absorbed by seats, dash, etc) as it’s converted from light energy to heat energy (IR). The light energy escapes back out through the glass...but the heat energy is blocked by the glass and so cannot leave the car. Much like a “greenhouse.”
 as it’s converted from light energy to heat energy (IR). The light energy escapes back out through the glass...but the heat energy is blocked by the glass and so cannot leave the car. Much like a greenhouse.")
24
Greenhouse Effect The Greenhouse Gases - WV, CO2,CH4,& N2O are analogous to the glass in a greenhouse. Light energy from Sun passes through them, strikes E and is converted to heat energy (IR)...the converted IR is absorbed and re-radiated back into the troposphere by the GHGs.
...the converted IR is absorbed and re-radiated back into the troposphere by the GHGs.")
25
Your diagram goes here!

26
ABSORBED: 70% REFLECTED: 30%

27
An important 70%... The solar energy not reflected back into space (70%) gets transferred to the atmosphere as IR energy... This warmed-up air becomes less dense, rises, and creates air currents called convection cells.

29
...it’s actually a good thing...
The greenhouse effect moderates the temp and makes it warm enough for many ( a word that often leaves you guessing) life forms to exist...
 life forms to exist...")
30
...a force to be reckoned with.
HOWEVER... If the concentration of these GHGs changes, their insulating effect changes also...and so will our climate.

31
Enhanced Greenhouse Effect
1958: Charles Keeling begins measuring CO2 levels on Mauna Loa

32
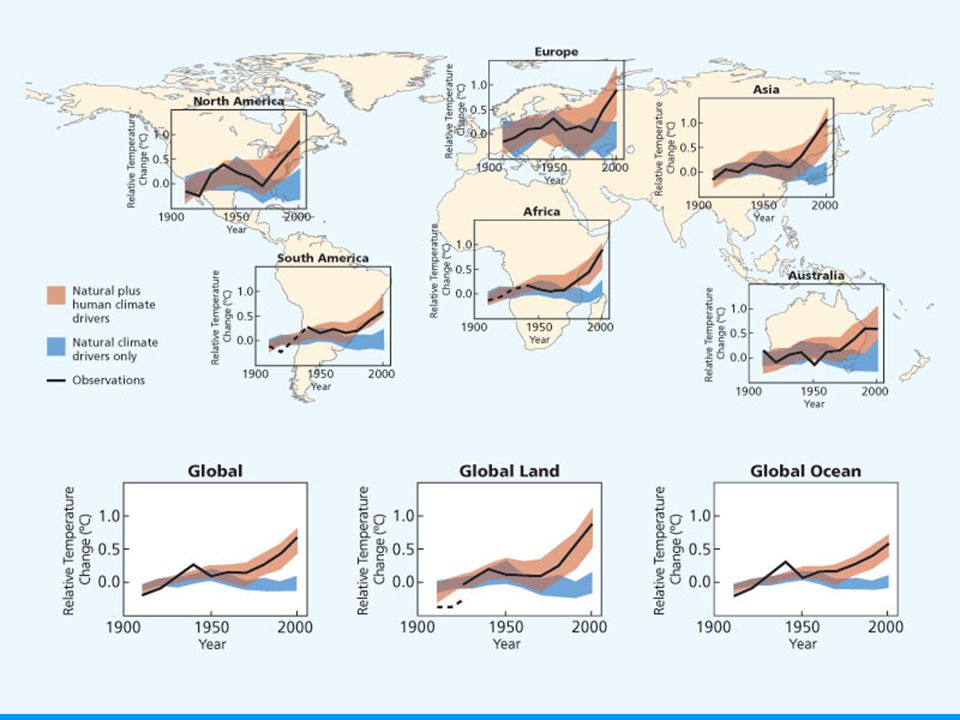
Anthropogenic warming
Warming of the Earth derived from human activity

33
...climate change is such an important issue today because we depend on those orgs for vital goods & services we need to survive...

34
If the global climate changes, can these ecosystems change with it - so those vital goods & services continue?

35
CLIMATES ...remember how ecosystems & biomes result from different combo’s of temp & precip? ...and the orgs that inhabit a particular biome are adapted to those limits? HUMANS can live anywhere (we don’t have to adapt – we control the environment...)
")
36
Past Climates Global surface temps fluctuate! This chart is
modern... stats come from actual weather stations.

37
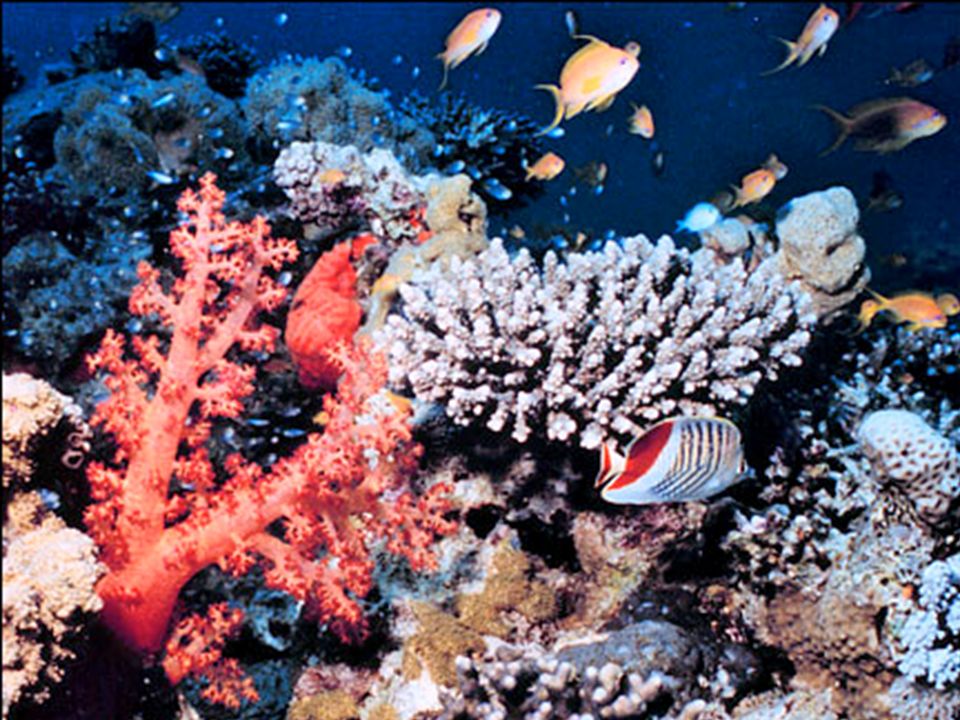
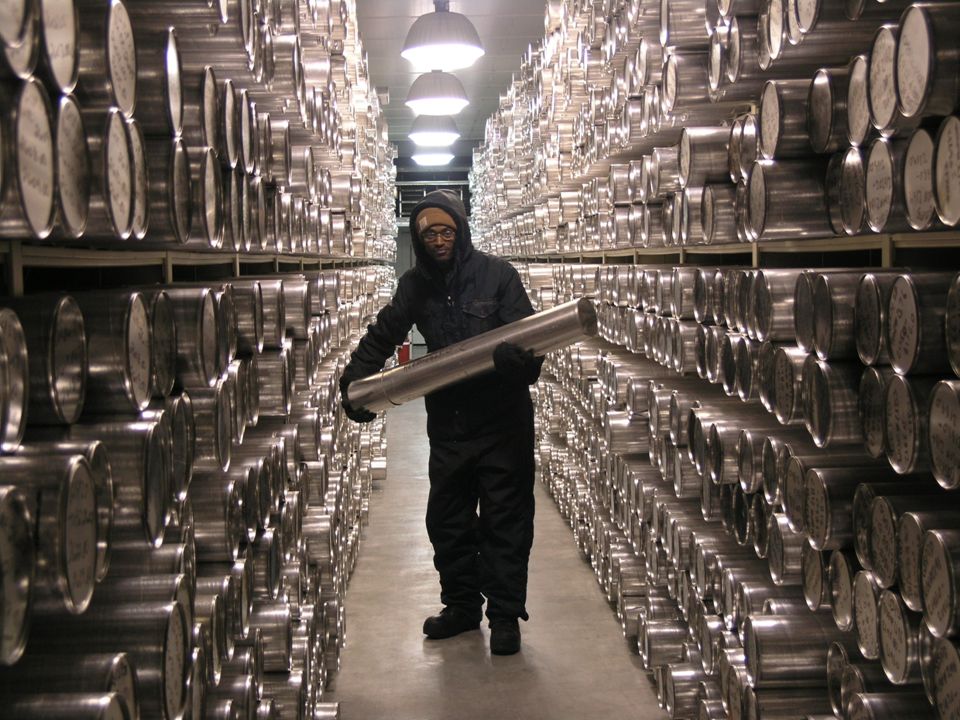
...but what about long ago? Proxies are used to provide info about ancient climate conditions. Pollen deposits...marine sediments...coral...ice cores... historical data…

38
Pollen!

39
Marine sediments Biological Inorganic
Changes in fossilized orgs (type & amount) Oxygen isotope concentrations in shelled remains Inorganic Clay mineralogy Aeolian dust
 Oxygen isotope concentrations in shelled remains. Inorganic. Clay mineralogy. Aeolian dust.")
42
Coral “Greer and Swart were investigating the relationship between non-radioactive or stable isotopes of oxygen in the calcium carbonate of the coral. The ratio of normal to heavier oxygen depends on the temperature of the water the coral grew in and its salinity. In warmer water, the coral incorporates more of the normal oxygen into its structure, but if the water is cooler, the coral will incorporate a higher percentage of the heavier oxygen isotope.”

47
Medieval Warming Period Little Ice Age

48
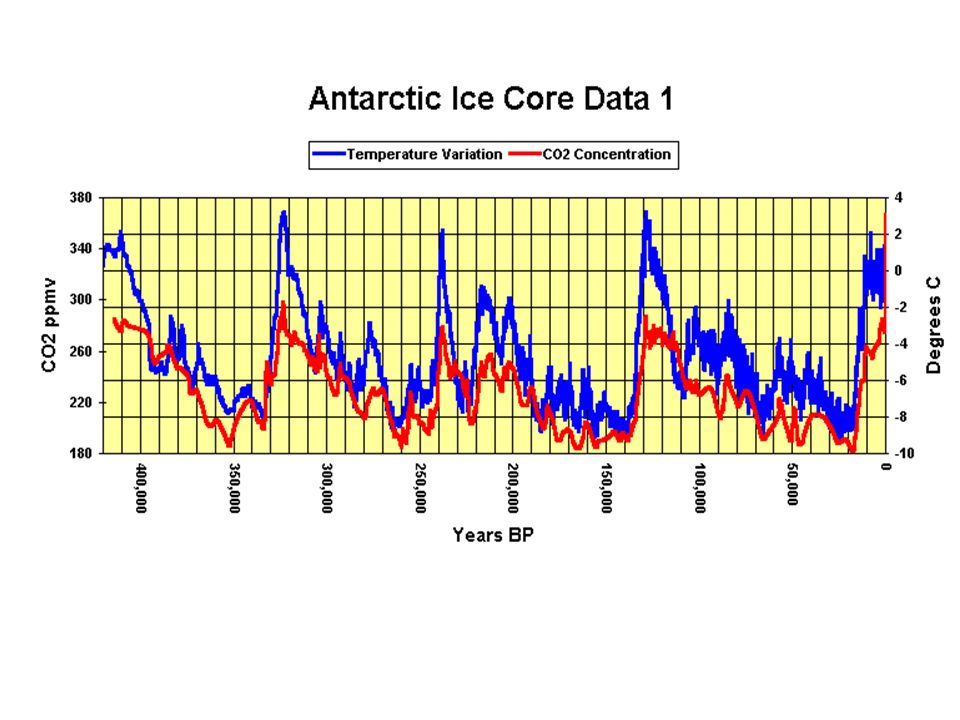
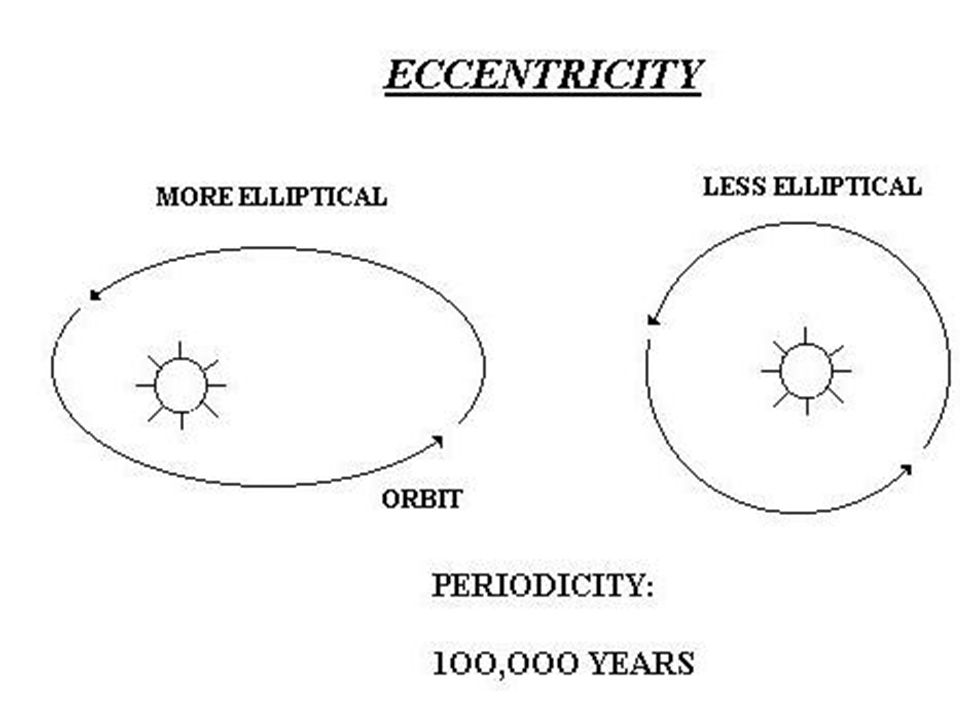
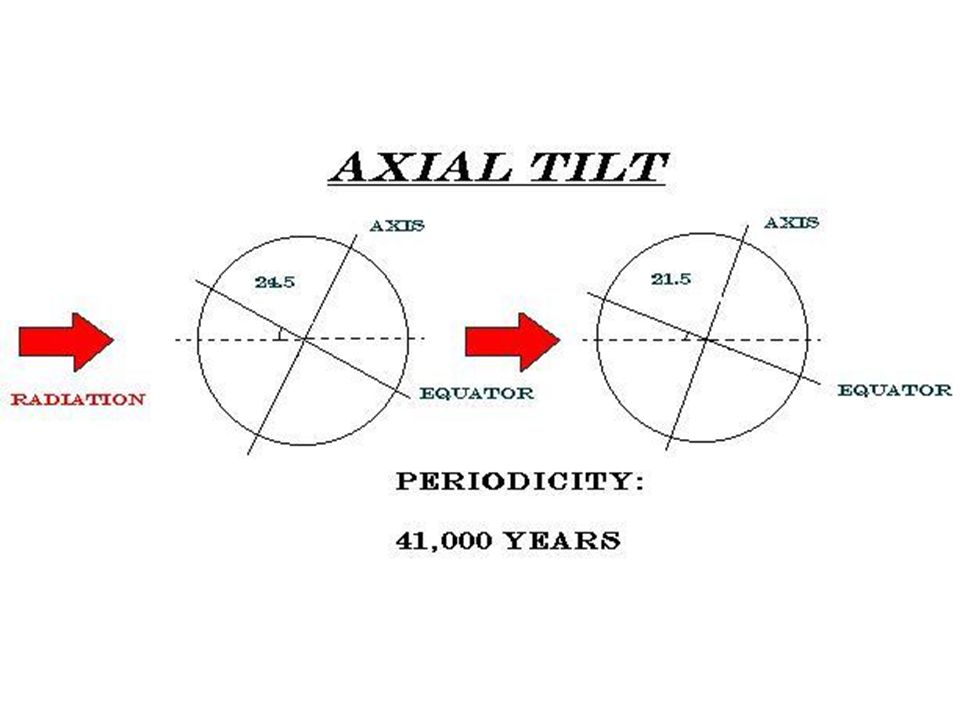
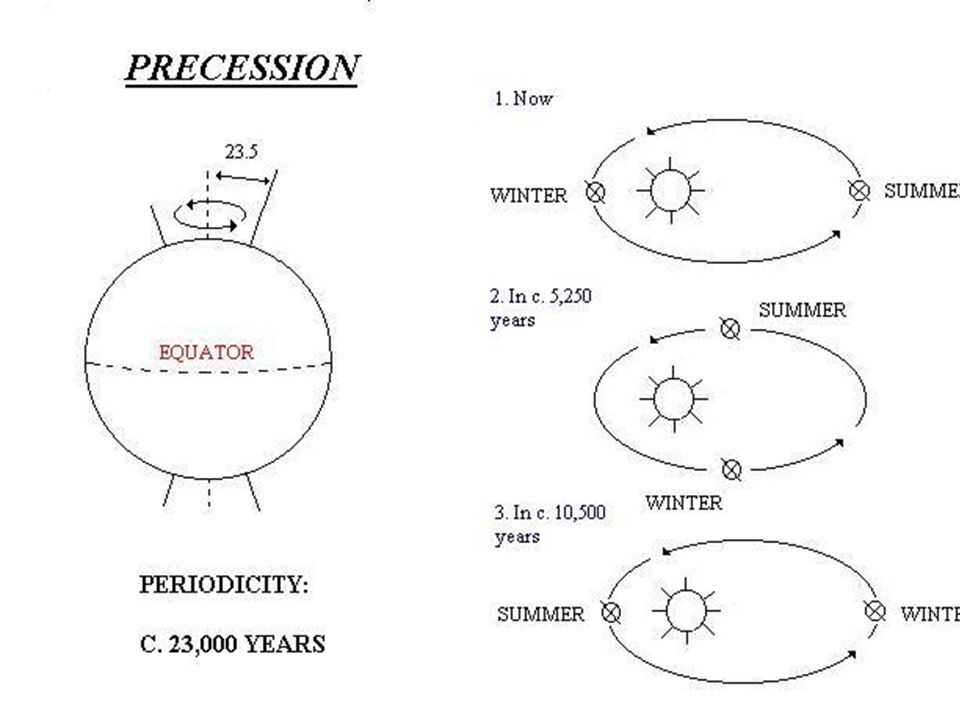
What does it MEAN? E’s climate has oscillated between ice ages and warm periods. Milankovich cycles : Earth rotational & revolutionary movements combine to affect global climate. Theory: Ice ages are caused by 100,000 year coincidences of these cycles.

52
...during the ice ages, major amounts of water were “tied up’ in glaciers & ice sheets...sea levels dropped hundreds of feet below current levels.

53
Rapid changes... Younger-Dryas Event: at the end of the last ice age, E warmed up 7o C in just 50 years! Scientists scratch heads: most likely due to atmosphere / ocean / global temp combo... kind of an El Nino gone bad...

54
THERMOHALINE Circulation
What’s THAT mean? Thermo: heat......Haline: salty... Cold water is more dense than warm water ; Saltier water is more dense than fresher water. Warm salty water cools; poles...flows along ocean bottom towards equator where it warms & rises.

55
One cycle: 1,000 years

56
...could the conveyor belt be STOPPED?
Recent evidence shows that it has been interrupted in the past...six times. Large quantities of fresh water in the North Atlantic (glacier/ice pack melting...) would lower the salinity (density) of the water up there... water would stop sinking... The northward flow of warm water would be blocked and the belt shifts south. Results in ABRUPT global cooling. Scientists are monitoring salinity in the northern ocean...
 would lower the salinity (density) of the water up there... water would stop sinking... The northward flow of warm water would be blocked and the belt shifts south. Results in ABRUPT global cooling. Scientists are monitoring salinity in the northern ocean...")
57
Climate Change: the DATA.

58
#1: CO2 Released by burning of fossil fuels!
Annual oscillations are due to seasonal changes in NH terrestrial ecosystems photosynthesis: Apr-Sep: CO2 ↓ respiration: Oct-Mar: CO2↑ As of 2012, CO2 399ppm (40% higher than before the Industrial Revolution)...higher than they’ve been in 400,000 years!
...higher than they’ve been in 400,000 years!")
59
Sources & Sinks 1 kg combusted fossil fuel = 3kg CO2
6.6 GtC (gigaton: billion metric tons) per year of fossil fuel carbon. 1.6 GtC per year from burning forests. Sinks: carbon sequestration. Oceans: uptake by 2 GtC/year 3 GtC/year
 per year of fossil fuel carbon. 1.6 GtC per year from burning forests. Sinks: carbon sequestration. Oceans: uptake by 2 GtC/year. 3 GtC/year.")
60
#2: WV Absorbs IR...the most abundant GHG! Atmospheric concentration variable... Major factor in “Supergreenhouse effect”: in South Pacific, wv traps/reradiates heat over ocean, resulting in MORE evaporation, thus more wv, thus more greenhouse effect...positive feedback.

61
#3: Methane (CH4) Sources: microbial fermentation (swamps, livestock, landfills, coal mines, natgas production, rice cultivation, manure). Atmospheric methane has doubled since Industrial Revolution; is leveling off!

62
#4: Nitrous Oxide (N2O) Sources: agriculture & biomass burning; fossil fuel combustion 15% increase in past 200 years. Particularly unwelcome because it’s so persistent: residence time 114 YEARS! Also bad for O3...

63
#5: O3 Sources: motor vehicle exhaust, biomass burning.
Short-lived, but potent.

64
#6: CFC’s & Halocarbons, et al
Entirely anthropogenic. Sources: refrigerants, fire retardants, solvents. Extraordinary capability for IR absorption (x10,000 CO2’s rate) Long residence time (100+ years) Double whammy: GHG AND O3 destroyers! Good news: manufacture & use has been curtailed.
 Long residence time (100+ years) Double whammy: GHG AND O3 destroyers! Good news: manufacture & use has been curtailed.")
65
IPCC Intergovernmental Panel on Climate Change.
est by UN and World Meteorological Society to provide accurate, relevant information on anthropogenic climate change. Three working groups: I: Assessment of scientific issues II: Impact of climate change & possible adaptations III: Mitigation of effects

66
IPCC More than 2,000 experts from over a hundred countries.
Unpaid...recoup only the cost of their research & associated professional activities.

67
Most recent report: Sep 2013

68
The report finds that it is “very likely” that emissions of heat-trapping gases from human activities have caused “most of the observed increase in globally averaged temperatures since the mid-20th century...”

69
”...evidence that human activities are the major cause of recent climate change is even stronger than in prior assessments...”

70
“It is unequivocal that Earth’s climate is warming...”

71
“...as is now evident from observations of increases in global average air and ocean temperatures, widespread melting of snow and ice, and rising global mean sea level...”

72
“...atmospheric concentrations of CO2 and methane exceed by far the natural range over the last 650,000 years.”

73
Further findings/evidence
11 of last 12 years rank among top 12 hottest years on record since 1850. Tropical storms, precipitation, and severe drought incidence have all increased. Mountain glaciers and snow fields are in world-wide decline. Summer Arctic sea ice has decreased 20% since 1978. Global mean sea level is rising.

74
What’s been done... Rio ’92: Earth Summit calls for voluntary reduction of GHGs. Failure: all increased... Kyoto ’97: binding agreement to reduce emissions. Failure: major players non-participants. Copenhagen ‘09: ill-will…mistrust between developed/developing nations. Details of the “accord:”

75
Latest IPCC Report (Sep 2013)
The warming is unequivocal. Humans caused the majority of it. The warming is largely irreversible. Most of the heat is going into the oceans. Current rates of ocean acidification are unprecedented. We have to choose which future we want very soon. To stay below 2°C of warming, the world must become carbon negative. To stay below 2°C of warming, most fossil fuels must stay buried in the ground.

76
Carbon Credit Trading Countries (both developed & developing) receive an allowance of carbon production. Developing countries can initiate cleaner technologies using less carbon. They can trade unused carbon credits to other countries and use the profit to grow. Developed countries will either pay or change… Market based.

77
The future...? Confidence in computer models to predict future scenarios has increased... Human influences will continue to change atmospheric composition throughout the 21st century.

79
pop↑ then↓, global shift to non-fossil fuel energy sources
B1 scenario pop↑ then↓, economies & governments cooperate to achieve sustainability A1T scenario pop↑ then↓, global shift to non-fossil fuel energy sources B2 scenario pop↑, significant efforts to achieve sustainability A1B scenario pop↑ then↓, balance of all energy sources A2 scenario pop↑ then↓, countries act independently with varied economic/technological change A1F1 scenario pop↑ then↓, fossil fuel intensive society

80
Projected Surface Temp./Sea-Level Rise at Year 2090
(oF Change @ yr 2090) Sea-Level Rise yr 2090) Case Best Estimate Likely Range Model-based range (excluding future rapid dynamical changes in ice flow) Constant Year 2000 concentrations 1.1 NA B1 scenario 3.2 2.0 – 5.2 A1T scenario 4.3 B2 scenario A1B scenario 5.0 A2 scenario 6.1 A1F1 scenario 7.2
 Sea-Level Rise. yr 2090) Case. Best Estimate. Likely Range. Model-based range (excluding future rapid dynamical changes in ice flow) Constant Year 2000 concentrations NA. B1 scenario – A1T scenario B2 scenario A1B scenario A2 scenario A1F1 scenario")
81
Projected Surface Temp./Sea-Level Rise @ Year 2090
(oF Change @ yr 2090) Sea-Level Rise yr 2090) Case Best Estimate Likely Range Model-based range (excluding future rapid dynamical changes in ice flow) Constant Year 2000 concentrations 1.1 NA B1 scenario 3.2 2.0 – 5.2 A1T scenario 4.3 B2 scenario A1B scenario 5.0 A2 scenario 6.1 A1F1 scenario 7.2
 Sea-Level Rise. yr 2090) Case. Best Estimate. Likely Range. Model-based range (excluding future rapid dynamical changes in ice flow) Constant Year 2000 concentrations NA. B1 scenario – A1T scenario B2 scenario A1B scenario A2 scenario A1F1 scenario")
82
What Must Be Done. World-wide cap on GHG emissions.
Investment in, & deployment of renewable energy technologies. Removal of fossil-fuel subsidies. &10 billion/yr in Europe...$15-35 billion/yr U.S.A. Develop nuclear power. Cost-effective, reliable, waste, spent fuel... More stringent energy conservation measures.

83
What Must Be Done. Stop TRF loss; plant more trees.
Reduce the amount of fuels used in transportation. Sequester CO2 emissions. Slow HPG.

84
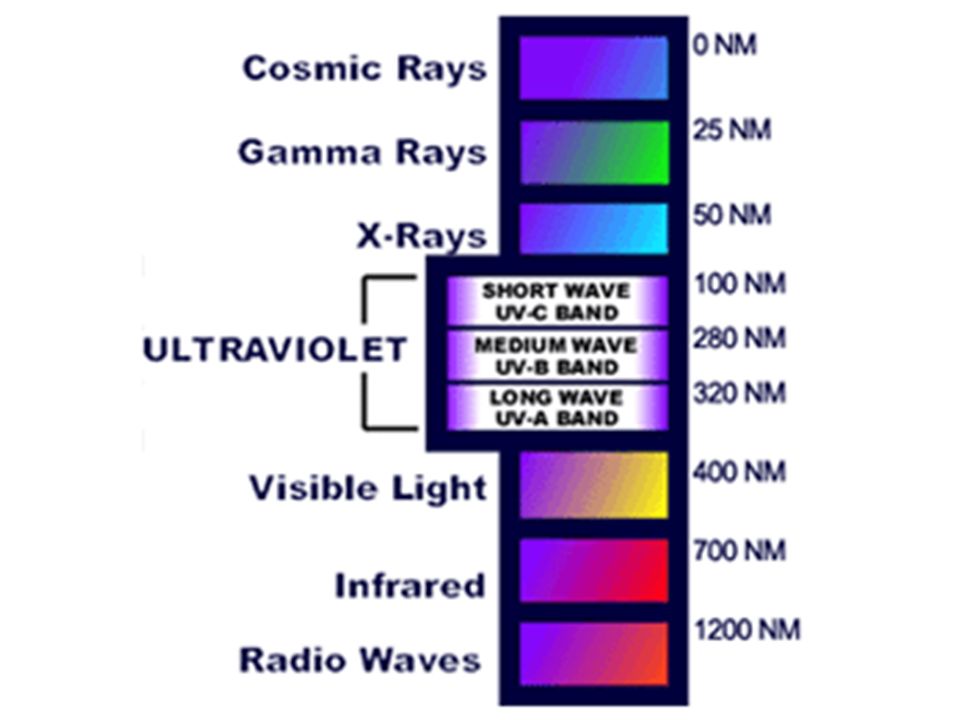
Depletion of the Ozone Layer

86
UV that penetrates the atmosphere may be absorbed by biological tissues, where it damages proteins and DNA molecules.

87
If the full amount of UV from the sun reached E’s surface (without being absorbed by the atmosphere), it is doubtful that any life forms could survive.
, it is doubtful that any life forms could survive.")
88
Fortunately, over 99% of UV is absorbed by ozone in the stratosphere...

89
...the small amount that does reach E is responsible for more than 700,000 cases of skin cancer/precancerous conditions per year, just in North America.

90
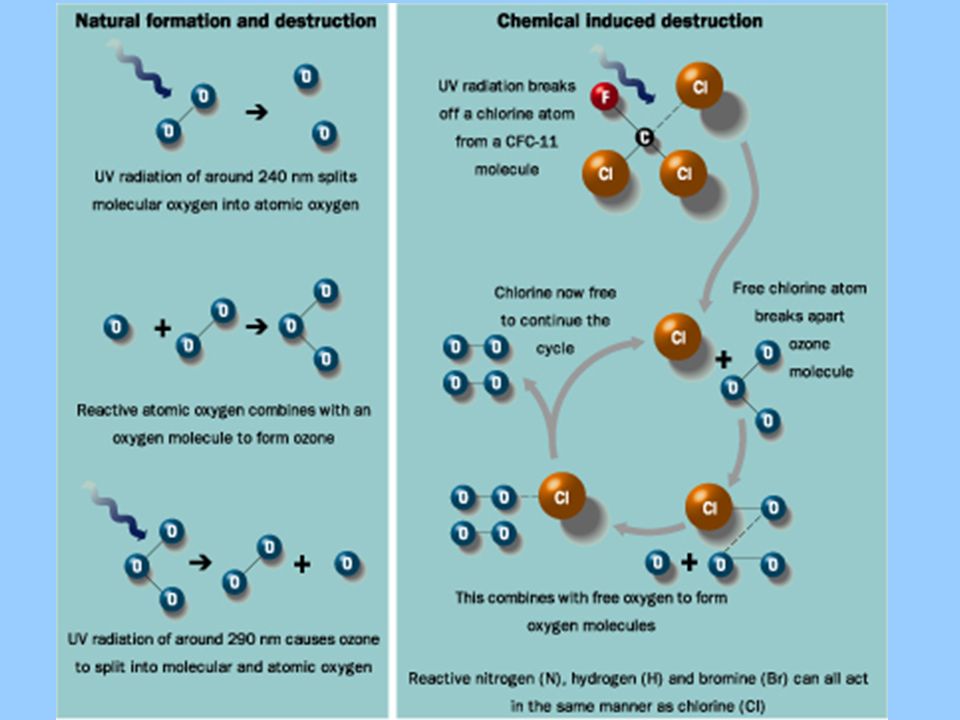
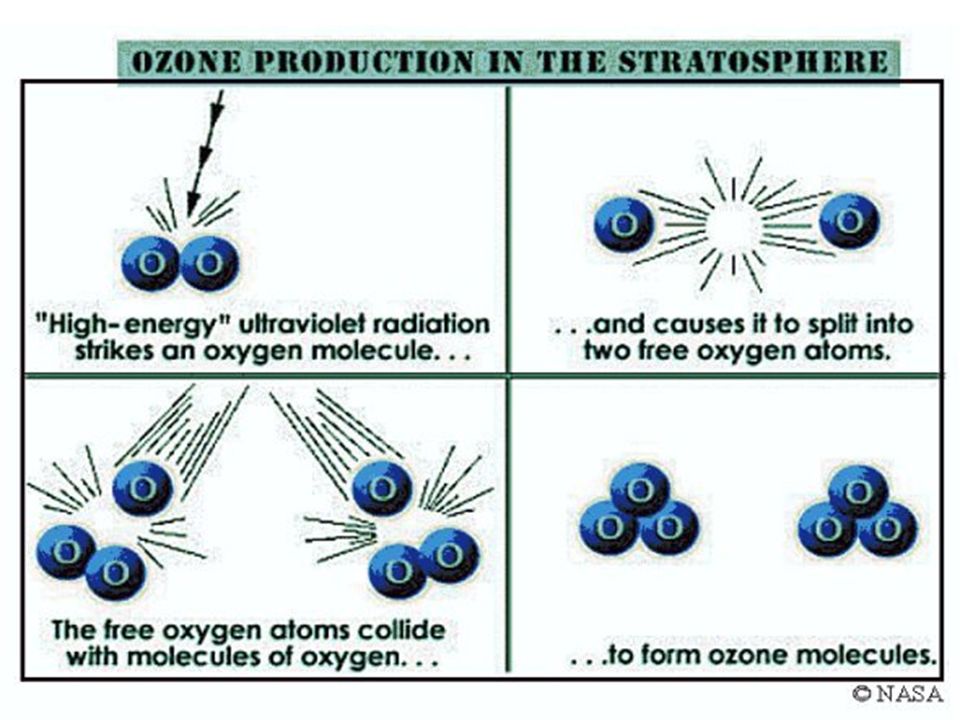
Formation and Destruction of Stratospheric O3
O2 + UVB → O + O O + O2 → O3 O + O3 → O2 + O2 O3 + UVB → O + O2

92
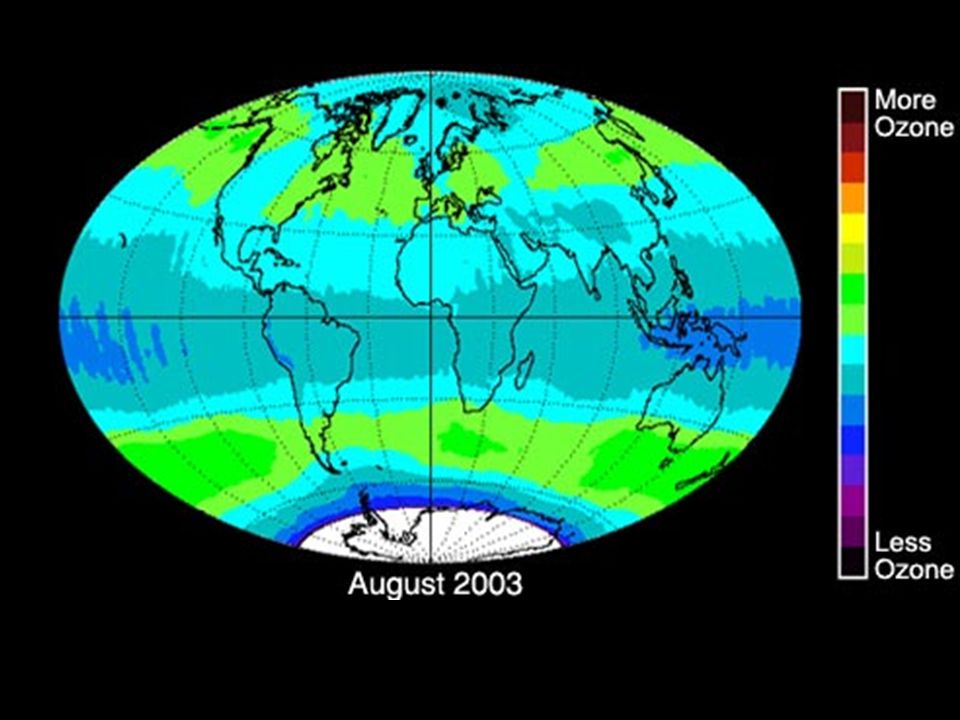
(High in summer, low in winter)
Seasonal changes in distribution of solar radiation cause ozone concentrations to vary... (High in summer, low in winter)
")
93
Ozone concentrations are higher near the equator, and diminish as latitude increases...also a function of distribution of solar radiation.

96
CFC (chlorofluorocarbon)
Nonreactive, nontoxic, nonflammable organic molecules in which Cl & Fl have replaced hydrogens; normal temp & pressure... ...they liquefy at modest pressure, giving off heat in the process, becoming cold... ...used in refrigerators, heat pumps, production of foam plastic, & as propellants in aerosol cans.

97
CFCs break down O3 in stratosphere
CFCI3 +UV → Cl + CFCI2 CI + O3 → ClO + O2 CIO + ClO→ 2 Cl + O2

98
Chlorine acts as a catalyst: a chemical that promotes a chemical reaction without itself being used up in the reaction. ...each chlorine can last from 40 to 100 years in the stratosphere...it has the potential to break down 100,000 molecules of ozone.

99
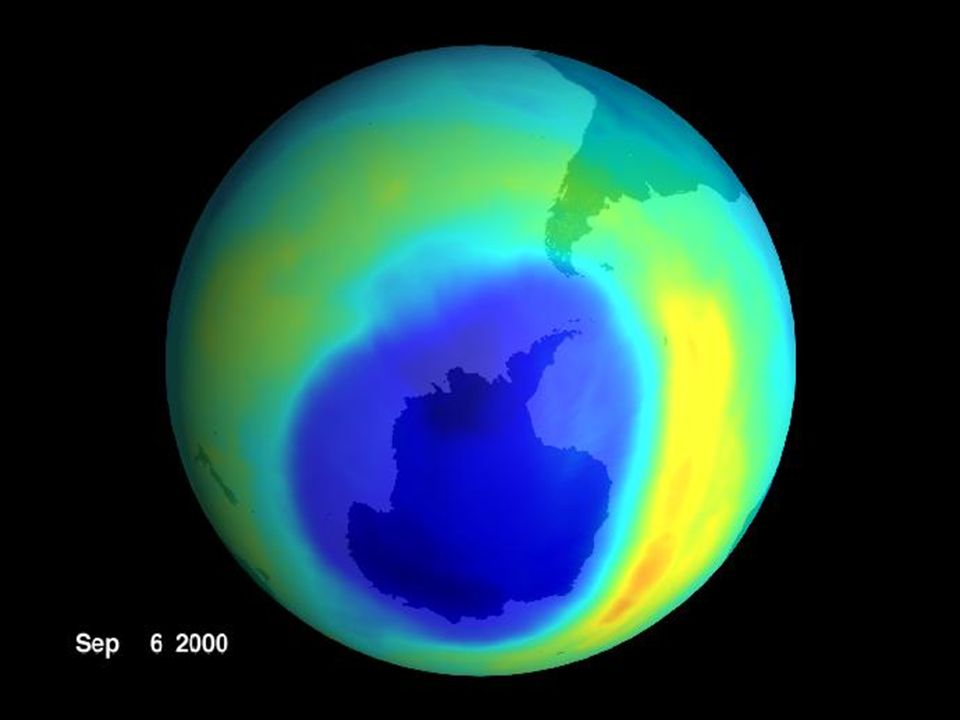
...it’s not really so much a hole...
...it’s more like a bald spot.

100
Rowland & Molina Called it in published a paper that concluded CFCs would damage the stratospheric ozone layer, increasing UV radiation on E’s surface, resulting in more skin cancer. Won Nobel Prize for their work (1995).
.")
101
1985 British researchers in Antarctica report a “hole” over the South Pole (about the size of the United States) in the fall of ’85...levels were 50% lower than normal. NASA satellites would have discovered it first; but they were programmed to reject anything over a 30% drop as an instrument failure!
 in the fall of ’85...levels were 50% lower than normal. NASA satellites would have discovered it first; but they were programmed to reject anything over a 30% drop as an instrument failure!")
103
Surprise... Scientists thought that ozone loss would be gradual & uniform all over the planet – not a “hole!” The “hole” came as a surprise...if it had happened anywhere other than South Pole, UV damage to life would have been extensive.

104
Why it happens where it happens:
Summertime creates chlorine reservoirs (Cl gets “locked up” in methane & nitrogen compounds) Wintertime’s extreme cold traps stratospheric gases within a ring of air circulating around the Antarctic...clouds form...clouds provide surfaces on which Cl2 gets “unlocked” from its reservoir. When sunlight returns in spring, UV attacks the Cl2, releasing free Cl – which begins the ozone destruction cycle.
 Wintertime’s extreme cold traps stratospheric gases within a ring of air circulating around the Antarctic...clouds form...clouds provide surfaces on which Cl2 gets unlocked from its reservoir. When sunlight returns in spring, UV attacks the Cl2, releasing free Cl – which begins the ozone destruction cycle.")
105
Sad days in the Outback, mate...
Ozone-poor air shifts over the Southern Hemisphere... UV radiation increases up to 20% above normal in Australia... Three out of four in Queensland (thinnest layer) are expected to develop skin cancer.
 are expected to develop skin cancer.")
106
Montreal Protocol 184 participating nations must phase out ozone-destroying chemicals by 2000 (developed countries) and 2010 (developing countries). ..in most industrialized countries, CFCs are no longer produced or used. Prediction: the ozone shield will reach full recovery by 2050.

Similar presentations


![Climate: What we know about it, How we know about it, and What we’re doing to it.]](/17/5339947/big_thumb.jpg "Climate: What we know about it, How we know about it, and What we’re doing to it.]>")


 McGraw Hill Ryerson 2007 11.1 Natural Climate Change “Climate” describes the average conditions of a region. Climate is usually measured over a minimum.>")
