Download presentation
Presentation is loading. Please wait.

1
Forecast Surveys

2
Introduction Two Philadelphia Fed surveys of private-sector forecasters – Livingston Survey – Survey of Professional Forecasters (SPF) Provide timely forecasts for policymakers and economic analysts Used to answer numerous research questions
 Provide timely forecasts for policymakers and economic analysts Used to answer numerous research questions")
3
Introduction Philadelphia Fed economists pushed to have surveys here – Livingston Survey: Don Mullineaux (?) – SPF: Dean Croushore Current research department keeps them here & makes them ever more useful – Loretta Mester (research director) – Tom Stark (maestro)
 – SPF: Dean Croushore Current research department keeps them here & makes them ever more useful – Loretta Mester (research director) – Tom Stark (maestro)")
4
Introduction Both surveys – Available to the public at no charge (Fed’s public education mission) – Used by news media, policymakers, economic analysts, labor unions, consumers
 – Used by news media, policymakers, economic analysts, labor unions, consumers")
5
Introduction Livingston Survey – Begun in 1946 – Joe Livingston, journalist – 1970s: economists discover survey – 1978: Philadelphia Fed takes over database – 1990: Philadelphia Fed takes over administration of survey

6
Introduction SPF – ASA/NBER survey begun in 1968 – Victor Zarnowitz & other founders – ASA/NBER folds survey in 1990 – Philadelphia Fed takes over in 1990 – Renamed Survey of Professional Forecasters

7
What Variables Do the Participants Forecast? Both surveys: Nominal GDP Real GDP Inflation (CPI) Unemployment rate Industrial production Interest rate: 3-month T- bills Interest rate: 10-year T- notes Corporate profits after tax Housing starts Business fixed investment
 Unemployment rate Industrial production Interest rate: 3-month T- bills Interest rate: 10-year T- notes Corporate profits after tax Housing starts Business fixed investment.")
8
What Variables Do the Participants Forecast? Livingston survey: Producer price index S&P 500 stock prices Average weekly earnings Retail trade sales Auto sales Prime interest rate Average over the next 10 years: – Real GDP growth – CPI inflation rate

9
What Variables Do the Participants Forecast? SPF: GDP price index Payroll employment Interest rate: AAA bonds Remaining GDP components Inflation rates: – CPI excluding food & energy prices (core CPI) – PCE price index – PCE price index excluding food & energy prices (core) Probability that real GDP will decline Distribution forecasts: – Real GDP – GDP price index – Core CPI – Core PCE price index Long-term forecasts: – CPI price index – PCE price index
 – PCE price index – PCE price index excluding food & energy prices (core) Probability that real GDP will decline Distribution forecasts: – Real GDP – GDP price index – Core CPI – Core PCE price index Long-term forecasts: – CPI price index – PCE price index.")
10
What Variables Do the Participants Forecast? SPF: First Quarter: – Long-term projections Real GDP growth Productivity growth Stock returns Long-term bond returns Short-term bond returns Third Quarter: – Estimates of natural rate of unemployment Special Questions – Declines in house prices – Effects of stimulus package – Effect of Y2K

11
Anonymity Both surveys promise anonymity – Can’t match forecaster to a forecast – Allows forecasters to reveal their true forecast, without attribution – Prevents herding and extreme forecasts

12
Evaluating the Survey Forecasts Are the forecasts accurate? Statistical tests – Unbiasedness (forecast errors have zero mean) – Efficiency (forecast errors are uncorrelated with information known when forecast was made)
 – Efficiency (forecast errors are uncorrelated with information known when forecast was made).")
13
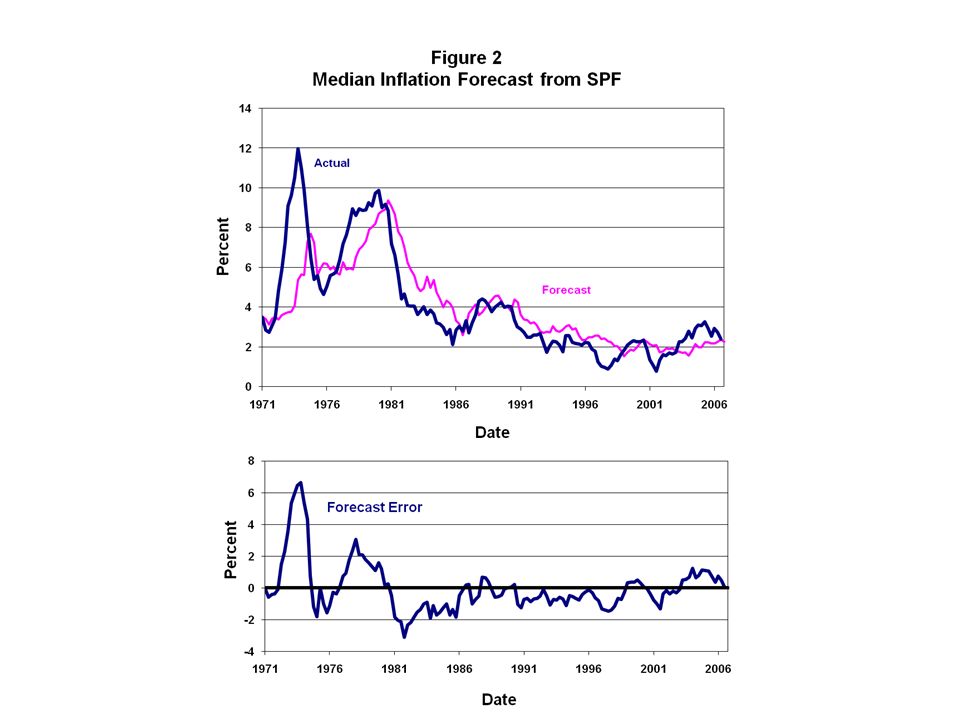
Evaluating the Survey Forecasts Unbiasedness – Over long samples, forecasts of major variables appear unbiased (Figure 1)
")
15
Evaluating the Survey Forecasts Unbiasedness – Over long samples, forecasts of major variables appear unbiased (Figure 1) – Formal statistical tests: Test: α = 0, β = 1
 – Formal statistical tests: Test: α = 0, β = 1")
16
Evaluating the Survey Forecasts Unbiasedness – Or: Test: α = 0

17
Evaluating the Survey Forecasts Sub-periods show poor performance

19
Evaluating the Survey Forecasts Sub-periods show poor performance Persistent forecast errors in 1970s and 1990s Those periods require explanation: failure to recognize impact of faster money growth; errors in evaluating natural rate of unemployment and rate of potential GDP growth

20
Evaluating the Survey Forecasts Inefficiency with respect to other variables Test: forecast errors should be uncorrelated with other variables known when survey was conducted – Example from Ball-Croushore (Figure 3)
")
22
Evaluating the Survey Forecasts Inefficiency with respect to other variables – Example from Ball-Croushore (Figure 3) – SPF forecasters seem not to change output forecasts enough in response to change in monetary policy
 – SPF forecasters seem not to change output forecasts enough in response to change in monetary policy")
23
Evaluating the Survey Forecasts Accuracy of probability distribution forecasts – Results from Diebold-Tay-Wallis (1999) Forecasts are reasonably accurate But too much probability of a large reduction in inflation Persistent inflation forecast errors
 Forecasts are reasonably accurate But too much probability of a large reduction in inflation Persistent inflation forecast errors")
24
Evaluating the Survey Forecasts Conclusion – SPF & Livingston survey forecasts fairly accurate— passing most tests – Some imperfections

Similar presentations


 = $11,814.9B (5.5%) Q2: GDP = $2,914.38.>")
 measures the dollar value of all goods and services produced in the U.S. economy in.>")


