Download presentation
Presentation is loading. Please wait.

1
Review of Assignment 3, Loose Ends, Web-based Data Collection Michael A. Kohn, MD, MPP 3 February 2009

2
Outline Assignment 3 Review Loose Ends: Yes/No Fields, BLOBs, Field Names, Front Ends, On-Screen Data Entry Conventions Web-based Data Entry Assignment 4

3
Housekeeping Database demos with advice for Assignment 4: Tuesday 2/10 –Carolyn Calfee –Janet Turan –Mary Farrant Assignment 4 is due 2/16 Please try to return the Learn MS Access 2000 CD

4
Assignment 3 Extra Credit: Write a sentence or two for the “Methods” or “Results” section on inter-rater reliability. (Use Bland and Altman, BMJ 1996; 313:744) Lab 3: Exporting and Analyzing Data 1/27/2009 Determine if neonatal jaundice was associated with the 5-year IQ scores and create a table, figure, or paragraph appropriate for the “Results” section of a manuscript summarizing the association.
 Lab 3: Exporting and Analyzing Data 1/27/2009 Determine if neonatal jaundice was associated with the 5-year IQ scores and create a table, figure, or paragraph appropriate for the Results section of a manuscript summarizing the association..")
5
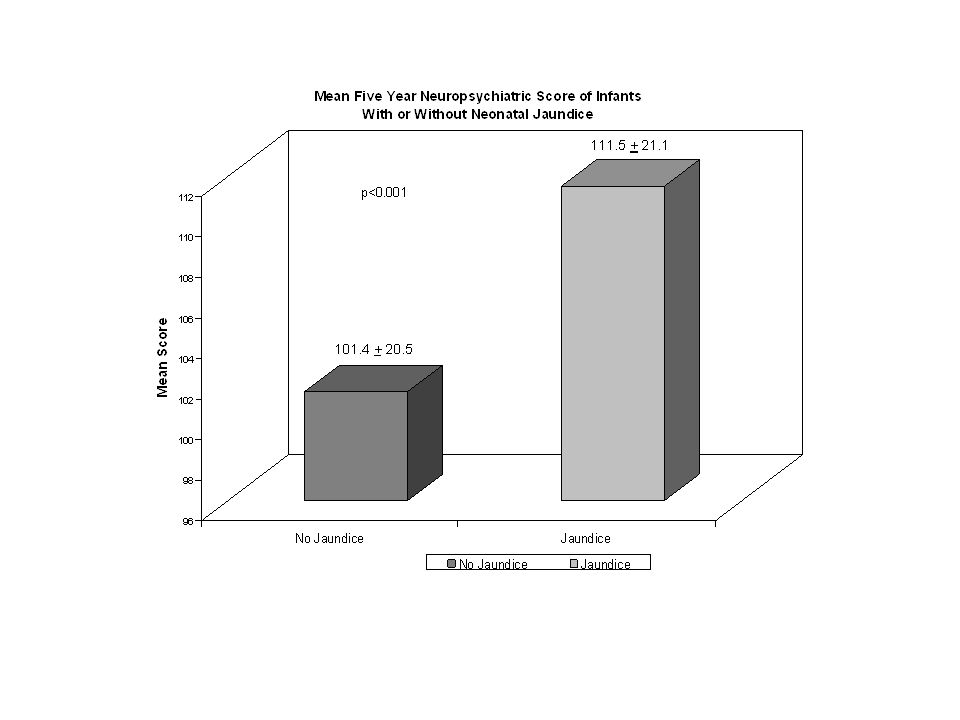
Answer Of the infants with neonatal jaundice, 149 had IQ tests at age 5, and of the infants without neonatal jaundice, 248 had IQ tests. The mean (+SD) IQ score was significantly higher in the jaundice group, 111.5 +21.1, than in the no-jaundice group 101.4+20.5 -- difference 10.1 (95% CI 5.9 – 14.4).
 IQ score was significantly higher in the jaundice group, , than in the no-jaundice group difference 10.1 (95% CI 5.9 – 14.4)..")
6
Table. Mean Five-Year IQ Scores for Infants With and Without Neonatal Jaundice NMean (SD)* Jaundice149111.5 (21.1) No Jaundice248101.4 (20.5) *Difference in mean scores of 10.1 (95% CI 5.9-14.4)
* Jaundice (21.1) No Jaundice (20.5) *Difference in mean scores of 10.1 (95% CI ).")
7
Table. Mean Five-Year IQ Scores for Infants Without and With Neonatal Jaundice No Jaundice JaundiceDifference (95% CI) N248149 Mean (SD)101.4 (20.5)111.5 (21.1) 10.1 (5.9-14.4)* *p< 0.0001
 N Mean (SD)101.4 (20.5)111.5 (21.1) 10.1 ( )* *p<")
8
Newman T et al. N Engl J Med 2006;354:1889-1900

9
----------------------------------------------------------------------------- Group | Obs Mean Std. Err. Std. Dev. [95% Conf. Interval] ---------+-------------------------------------------------------------------- No | 248 101.3925 1.303441 20.52661 98.8252 103.9597 Yes | 149 111.5358 1.732576 21.14879 108.112 114.9596 ---------+-------------------------------------------------------------------- combined | 397 105.1994 1.06956 21.31083 103.0967 107.3021 ---------+-------------------------------------------------------------------- diff | -10.14332 2.152007 -14.37414 -5.912502 ------------------------------------------------------------------------------ Degrees of freedom: 395 Ho: mean(No) - mean(Yes) = diff = 0 Ha: diff 0 t = -4.7134 t = -4.7134 t = -4.7134 P |t| = 0.0000 P > t = 1.0000 Would you submit this for publication?
 - mean(Yes) = diff = 0 Ha: diff 0 t = t = t = P |t| = P > t = Would you submit this for publication .")
10
Essential Elements Sample size (149 jaundiced, 248 non-jaundiced) Indication of effect size (report both means, or the difference between them) Get direction of effect right (Jaundiced group did better!) Indication of variability (Sample SDs, SEs of means, CIs of means, or CI of difference between means.)
 Indication of effect size (report both means, or the difference between them) Get direction of effect right (Jaundiced group did better!) Indication of variability (Sample SDs, SEs of means, CIs of means, or CI of difference between means.)")
11
Browner on Figures Figures should have a minimum of four data points. A figure that shows that the rate of colon cancer is higher in men than in women, or that diabetes is more common in Hispanics than in whites or blacks, [or that jaundiced babies had higher IQs at age 5 years than non-jaundiced babies,] is not worth the ink required to print it. Use text instead. Browner, WS. Publishing and Presenting Clinical Research; 1999; Williams and Wilkins. Pg. 90

12
Cutoff at 50? Caption should be below figure. What are the error bars? “Neuopsychiatric”

13
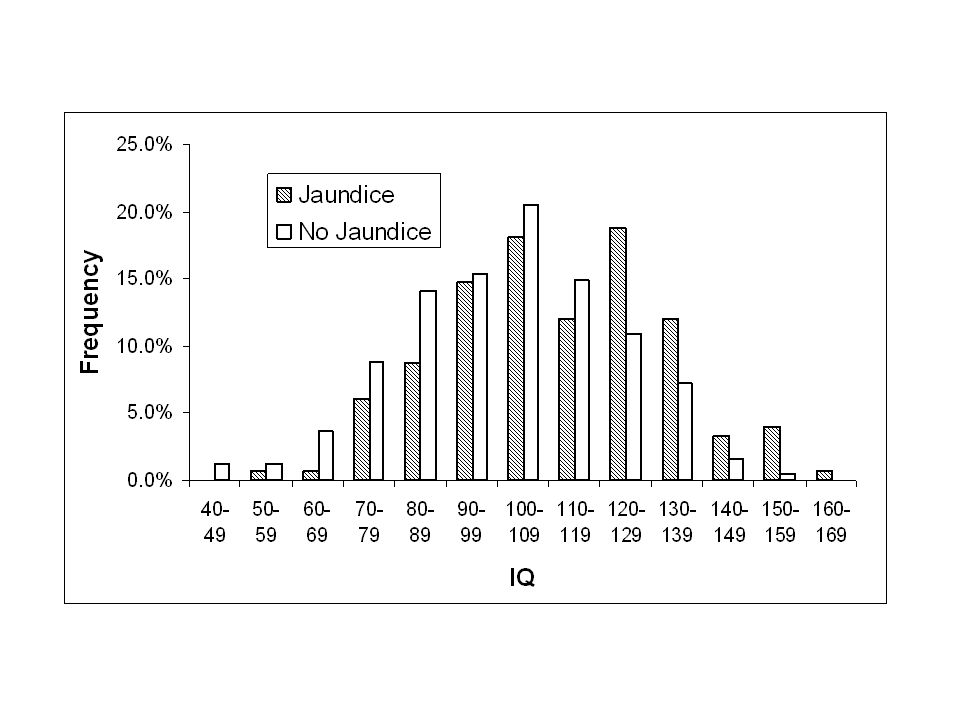
Cutoff at 60? Caption should be below figure.

15
Browner on 3-D Figures Three dimensional graphs usually are not helpful. Browner, WS. Publishing and Presenting Clinical Research; 1999; Williams and Wilkins. Pg. 97 Also, note that the 3-D is only an effect. The data are two dimensional (score by jaundice).
..")
16
Takes the prize for ugliest figure.

17
Caption not sufficiently explanatory. Sample size?

18
Figure 1: In 149 infants with neonatal jaundice, the average IQ scores were higher compared to the 248 non-jaundiced infants when evaluated at age 5 (p<0.0001).
.")
19
Box Plot Median Line Box extends from 25 th to 75 th percentile Whiskers to upper and lower adjacent values Adjacent value = 75 th /25 th percentile ±1.5 x IQR (interquartile range) Values outside the adjacent values are graphed individually Would be nice if area (or at least width) of box were proportional to sample size (N). In some box plots the width of the box is proportional to log N, but not in Stata.

21
Extra Credit Report within-subject SD (4.0) as a measure of reliability. Calculate repeatability (11.0) Bland-Altman plot with mean difference and 95% limits of agreement* * Nobody did this.
 Bland-Altman plot with mean difference and 95% limits of agreement* * Nobody did this..")
22
We assessed inter-rater reliability of the IQ test by having different examiners re-test 198 of the children. The within-subject standard deviation was 4.0, so the “repeatability” was 11.0, meaning that two examiners of the same subject would score within 11 points of each other 95 percent of the time. (Bland and Altman, BMJ 1996; 313:744) Methods or Results?
 Methods or Results .")
23
N = 142 (children examined by both Satcher and Richmond) Mean Difference = 0.49 (95% CI -0.41 – 1.38) 95% Limits of Agreement: -10.272 – 11.244
 Mean Difference = 0.49 (95% CI – 1.38) 95% Limits of Agreement: –")
24
Outline DONE Assignment 3 Review Loose Ends: Yes/No Fields, BLOBs, Field Names, Front Ends, On-Screen Data Entry Conventions Web-based Data Entry Assignment 4

25
Loose Ends Yes/No Fields BLOBs Field Names “Front End” vs. “Back End” On-Screen Data Entry Conventions

26
Yes/No fields Binary fields are not very useful, because you can’t distinguish “No” from blank (not valued). I create a combo box like we used for Race in Lab 1 with 0 for “No” and 1 for “Yes”. This allows blank. Demonstrate with “Subject” table/form, Latino and Jaundice fields.

27
Demonstration (BLOB) Memo fields in the Infant Jaundice Database Word Document Fields on the “Class” form of the ATCR Student Database Photograph fields in the ATCR Student Database Field types are not limited to numbers, text, dates. You can put an “object”, such as a Word document or a photo, in a field

28
Field Names Establish and follow naming conventions for columns and tables. Short field names without spaces or underscores are convenient for programming, querying, and other manipulations. Instead of spaces or underscores, use “IntraCaps” (upper case letters within the variable name) to distinguish words, e.g. “SubjectID”, “FName”, or “ExamDate”. Table names should be singular, e.g. “Subject” instead of “Subjects”, “Exam” instead of “Exams”.
 to distinguish words, e.g. SubjectID , FName , or ExamDate . Table names should be singular, e.g. Subject instead of Subjects , Exam instead of Exams ..")
29
“Front End” vs. “Back End” “Back End” – Tables and Data “Front End” – Forms and reports for entering and viewing the data Access database that you have been using combines “back end” (tables and relationships) with “front end” (forms and reports).* *Even if both are in Access, you usually want to split the front end from the back end. QuesGen uses MySQL for the back end.
 with front end (forms and reports).* *Even if both are in Access, you usually want to split the front end from the back end. QuesGen uses MySQL for the back end..")
30
Start with Data Tables or Data Collection Forms? It doesn’t matter as long as the process is iterative. Can start with the tables and then develop the forms, test the forms, find problems, and update the tables. Can start with a word-processed form, create the tables, test, and update.* *This seems to work better for most investigators

31
Sometimes it helps to start with the data collection forms, but remember, you do NOT need one table per data collection form. In the labs you learned that one form can combine data from several tables. And data from one table can appear on several forms.

32
Before seeking help with data management Search the internet and ask other researchers for already developed data collection forms. Draft your data collection form. Test your data collection form with dummy subjects and, even better, with real (de-identified) study subjects. Enter your test data into a data table with rows corresponding to subjects and columns corresponding to data elements. (Use Excel, Access, Stata, or even Word.) Create or at least think about a data dictionary. Decide who will collect the data, and when/how the data will be collected.
 study subjects. Enter your test data into a data table with rows corresponding to subjects and columns corresponding to data elements. (Use Excel, Access, Stata, or even Word.) Create or at least think about a data dictionary. Decide who will collect the data, and when/how the data will be collected..")
33
Common Sequence Develop data collection forms in Word Create Excel spreadsheets to store the data (one column per field/attribute, one row per record/entity) Move from Excel to Access because of need for one of more of: –data entry forms (front end), –multiple related tables, –queries using the Access query design tool Move from Access to QuesGen because of need for web- based data entry, hosting, auditing, richer user administration and security, but continue to use Access for querying of data extracts to filter, sort, format, and generate derived fields. Export to Stata for analysis.

34
On-Screen Data Collection Forms Will demonstrate using the “race” field from the Infant Jaundice Study Free text versus coded response Single response (mutually exclusive choices) versus “all that apply”
 versus all that apply")
35
Free Text vs. Coded Responses Same as “Open-Ended” vs. “Closed-Ended” Questions Free text responses useful in developing coded response options.

36
Mutually Exclusive, Collectively Exhaustive Response Options One field (=column) Can always make responses exhaustive by including an “Other” response Drop down list (combo box) vs. pick list (field list) vs. option group
 vs. option group.")
37
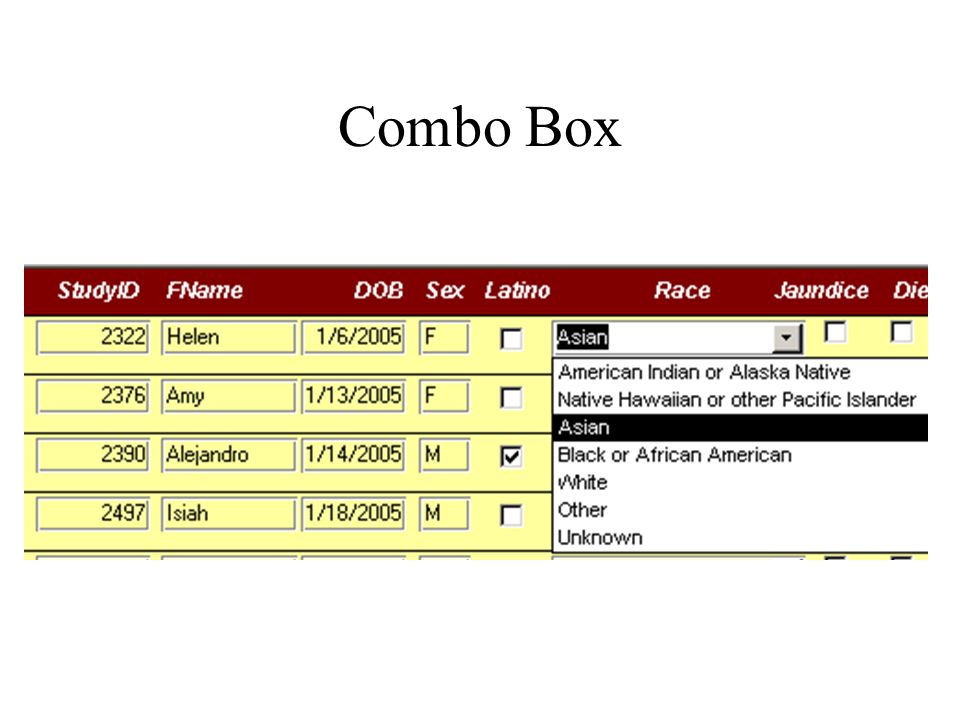
Drop-down List (Combo Box) Saves screen real estate Doesn’t work on paper forms (Master form)
 Saves screen real estate Doesn’t work on paper forms (Master form)")
38
Combo Box

40
Pick List (Field List) Uses up screen real estate Useful on paper forms (MasterRaceAsFieldList form)
 Uses up screen real estate Useful on paper forms (MasterRaceAsFieldList form)")
41
Field List

42
Option Group Radio buttons (by convention) Uses up screen real estate (MasterRaceAsOptionGroup form)
 Uses up screen real estate (MasterRaceAsOptionGroup form)")
43
Option Group

44
Mutually Exclusive = One Field

45
“All that apply” Multiple fields (= columns) Use check boxes (by convention) (MasterRaceAsAllThatApply form)
 Use check boxes (by convention) (MasterRaceAsAllThatApply form)")
46
All That Apply

47
“All that Apply” = Multiple Fields

48
From Paper Data Forms to Data Table(s)* Transcription directly into the table(s) Transcription via an online (screen) form Scanning using OMR software *Best option: Don’t use paper data collection forms at all.
* Transcription directly into the table(s) Transcription via an online (screen) form Scanning using OMR software *Best option: Don’t use paper data collection forms at all.")
49
Enter data directly into the computer database or move data from paper forms into the computer database as close to the data collection time as possible. When you define a variable in a computer database, you specify both its format and its domain or range of allowed values. Using these format and domain specifications, computer data entry forms give immediate feedback about improper formats and values that are out of range. The best time to receive this feedback is when the study subject is still on site. On-Screen* vs. Paper Forms *Using on-screen forms is sometimes called EDC for Electronic Data Capture

50
On-screen vs. paper forms You can always print out a paper copy of the screen form or a report of the exam/interview results once the data are collected. Examples: ATM Machine’s printed transaction record, Gas Station’s printed receipt

51
What Have You Learned? The meaning and importance of the terms “normalization”, “primary key”, and “foreign key”. The difference between a flat-file database, and a normalized, multi-table relational database. A little bit of Microsoft Access Querying data Exporting data for analysis in a statistical package Field types “Front End” (forms) vs. “Back End” (tables)
 vs. Back End (tables).")
52
Four Types of Research Database 1.Combination of paper files, Excel spreadsheets, and direct keyboard entry into the statistical analysis package.* 2.Desktop multi-table relational database.** 3.Client-Server or “Enterprise” multi-table relational database.*** 4.Web-Enabled Research Platform.** *Can do yourself ** Might be able to do yourself ***Definitely need to get help

53
Four Types of Research Database 1.Combination of paper files, Excel spreadsheets, and direct keyboard entry into the statistical analysis package.* 2.Desktop multi-table relational database.** 3.Client-Server or “Enterprise” multi-table relational database.*** 4.Web-Enabled Research Platform.** *Can do yourself ** Might be able to do yourself ***Definitely need to get help

54
Web-Enabled Research Platform Browser based entry from anyplace with an internet connection. Enterprise database back end Available as a hosted service

55
Web-based Data Collection Platforms Vendor Hosted –SurveyMonkey –QuesGen –Medrio Not Vendor Hosted –Velos –LabMatrix –RedCap –OpenClinica Not Discussed Here –Phase Forward –Oracle Clinical

56
Advantages of Being Web-Based Available anywhere with an internet connection No software requirement beyond a browser Easy to share data

57
Disadvantages of Being Web-based Limited look-and-feel options on forms (In contrast, Access forms are highly customizable.) Limited data structures Requires an internet connection
 Limited data structures Requires an internet connection")
58
Advantages of Being Hosted No need for servers, system administrators, etc.

59
Disadvantages of Being Hosted Patient confidentiality/HIPAA issues Auditing (CFR 21 Part 11– Electronic record- keeping requirements of the FDA) (Except for SurveyMonkey, the web-based data collection systems CLAIM to handle these issues and requirements) (Access databases and SurveyMonkey can meet patient confidentiality requirements but not CFR 21 Part 11)
 (Except for SurveyMonkey, the web-based data collection systems CLAIM to handle these issues and requirements) (Access databases and SurveyMonkey can meet patient confidentiality requirements but not CFR 21 Part 11)")
60
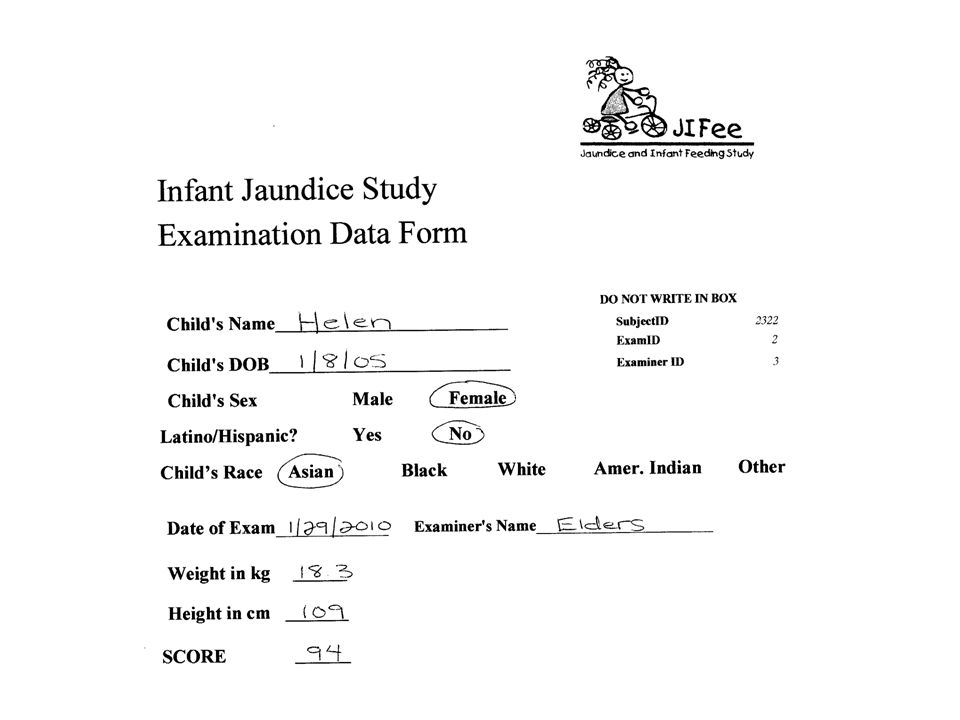
SurveyMonkey Demo Enter Helen’s exam Show SF-36 (Time Permitting)
")
62
SurveyMonkey Advantages Beautiful forms Simple to create Hosted Inexpensive Great for surveys

63
SurveyMonkey Disadvantages Market-research oriented, not medical Flat file No audit trail Limited user roles, security Not designed for PHI/HIPAA compliance Limited skip logic

64
SurveyMonkey Disadvantages Can’t upload data –Cannot import Baby2007.xls file as in Lab 2 –Have to key data in No subject or exam list Have to browse through the surveys to find the one you want. No calculations e.g., BMI

65
QuesGen Demo

66
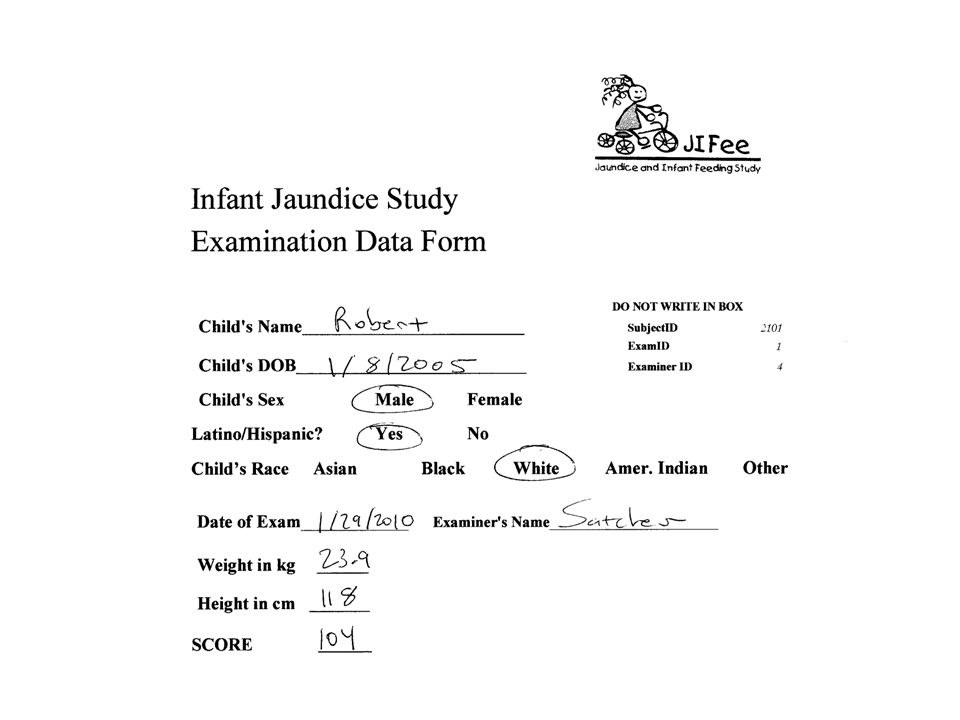
Enter Robert’s data Show populated database Data extract/Access Query/Stata

68
Advantages of QuesGen Multiple user roles (DB admin, team member, view-only, site-specific) PHI fields explicitly identified (masked from user without PHI privileges) UCSF IT reviewed Easy to add/change/format fields Templates for clinical research (medication, lab sample, etc) and systematic reviews (publication) Inexpensive
 PHI fields explicitly identified (masked from user without PHI privileges) UCSF IT reviewed Easy to add/change/format fields Templates for clinical research (medication, lab sample, etc) and systematic reviews (publication) Inexpensive")
69
Disadvantages of QuesGen Same as other web-based platforms –Limited look-and-feel options –Requires network connection

70
Data Management Protocol General description of database Data collection and entry Error checking and data validation Analysis (e.g., export to Stata) Security/confidentiality Back up
 Security/confidentiality Back up")
71
General Description of Database DBMS, e.g. MS Access XP # of dynamic tables # of static “lookup” tables # of forms # of reports An appendix could include the relationships diagram, the table names and descriptions, and the field names and descriptions (data dictionary). Print relationships diagram using either “Print Relationships” or taking a screen shot.
. Print relationships diagram using either Print Relationships or taking a screen shot..")
72
Data Collection and Entry Import baseline data from existing systems Import lab results, scan results (e.g. DEXA), holter monitor data, and other digital data. For each form, who will collect the data? Collect onto paper forms and then transcribe? Enter directly using screen forms? Scannable forms?
, holter monitor data, and other digital data. For each form, who will collect the data. Collect onto paper forms and then transcribe. Enter directly using screen forms. Scannable forms .")
73
Error Checking and Validation Database automatically checks data against the range of allowed values. Periodic outlier detection. (Outliers still within the range of allowed values.) Calculation checks Is double data entry really needed ?
 Calculation checks Is double data entry really needed .")
74
Analysis How will you get the data out of the database?

75
Security/Confidentiality Keep identifying data (name, SSN, MRN) in a separate table. Link rest of DB to this table via a Subject ID that has no meaning external to the DB. Restrict access to identifying data. Password protect at both OS and application levels. Audit entries and updates.

76
Back ups Ask your system person to restore a file periodically. This tests both the back-up and restore systems.

77
Assignment 4 Data Management Protocol Write a one-page data management section for your research study protocol or a one-page description of your current research study database. At the beginning of your assignment, for the readers, briefly describe your study, including design, predictors, outcomes, target population, and sample size. (1 or 2 sentences) Include with your assignment a relationships diagram showing the structure of your study database. Send assignment to ucsfdbclass@yahoo.com by 2/16/2009.
 Include with your assignment a relationships diagram showing the structure of your study database. Send assignment to by 2/16/")
78
Assignment 4 Due 2/19/08, send to ucsfdbclass@yahoo.com Write a one-page data management section for your research study protocol or a one-page description of your current research study database. At the beginning of your assignment, for the readers, briefly describe your study, including design, predictors, outcomes, target population, and sample size. (1 or 2 sentences). Optionally, include with your assignment a relationships diagram* showing the structure of your study database. The elements of a data management protocol or database description were covered in the 2/5/08 lecture and include: General description of database (possibly including a relationships diagram*) Data collection and entry Error checking and data validation Analysis/Reporting (e.g., export to Stata) Security/confidentiality Administration/Back up Extra Credit: Include a budget or cost estimate for data management. *Relationships diagram is optional
. Optionally, include with your assignment a relationships diagram* showing the structure of your study database. The elements of a data management protocol or database description were covered in the 2/5/08 lecture and include: General description of database (possibly including a relationships diagram*) Data collection and entry Error checking and data validation Analysis/Reporting (e.g., export to Stata) Security/confidentiality Administration/Back up Extra Credit: Include a budget or cost estimate for data management. *Relationships diagram is optional.")
79
Assignment 4 1) What is your study? ("The [CUTE ACRONYM] study is a [DESIGN] study of the associations between [PREDICTOR] and [OUTCOME] in [STUDY POPULATION]"). 2) What data points are you collecting? (Helps to have an actual data collection form mocked up in Word or Access.) 3) Who will collect the data? You? RAs? MDs? Maybe the study subjects will enter the data themselves.
. 2) What data points are you collecting. (Helps to have an actual data collection form mocked up in Word or Access.) 3) Who will collect the data. You. RAs. MDs. Maybe the study subjects will enter the data themselves..")
80
Assignment 4 (cont’d) 4) How will the data be collected? Written onto a paper form and then transcribed into a computer file? Entered directly into the computer? (If it's going to be transcribed, will you be doing that? Will you hire somebody? Or will you enlist some med students?) 5) Will the above-mentioned computer file be an Excel file, Stata file, Access file, or something else? 6) If it's a single table database (e.g., Excel or Stata), what will the rows represent, what will the columns be? Try to provide a detailed data dictionary with the name, data type, description, and validation rules for each field (column) in the single table.
 5) Will the above-mentioned computer file be an Excel file, Stata file, Access file, or something else. 6) If it s a single table database (e.g., Excel or Stata), what will the rows represent, what will the columns be. Try to provide a detailed data dictionary with the name, data type, description, and validation rules for each field (column) in the single table..")
81
Assignment 4 7) If it's a multi-table database, even a hand-drawn relationships diagram would help but is not required. 8) How will you validate the data for correctness and monitor the data collection effort? (Usually you have some range checks on individual variables and you periodically query for outliers that are nonetheless within the allowed range.) 9) You should periodically analyze the data, not only to look for problems, but also to see where the study is headed. How will you do this? Query in Access and export to Stata? 10) How will you protect your subjects' identifying data? 11) How will you ensure that you don't lose your data file in a computer crash or if a water pipe leaks?
 How will you validate the data for correctness and monitor the data collection effort. (Usually you have some range checks on individual variables and you periodically query for outliers that are nonetheless within the allowed range.) 9) You should periodically analyze the data, not only to look for problems, but also to see where the study is headed. How will you do this. Query in Access and export to Stata. 10) How will you protect your subjects identifying data. 11) How will you ensure that you don t lose your data file in a computer crash or if a water pipe leaks .")
82
Answering these questions is an essential part of doing a clinical research study.

Similar presentations