Download presentation
Presentation is loading. Please wait.

2
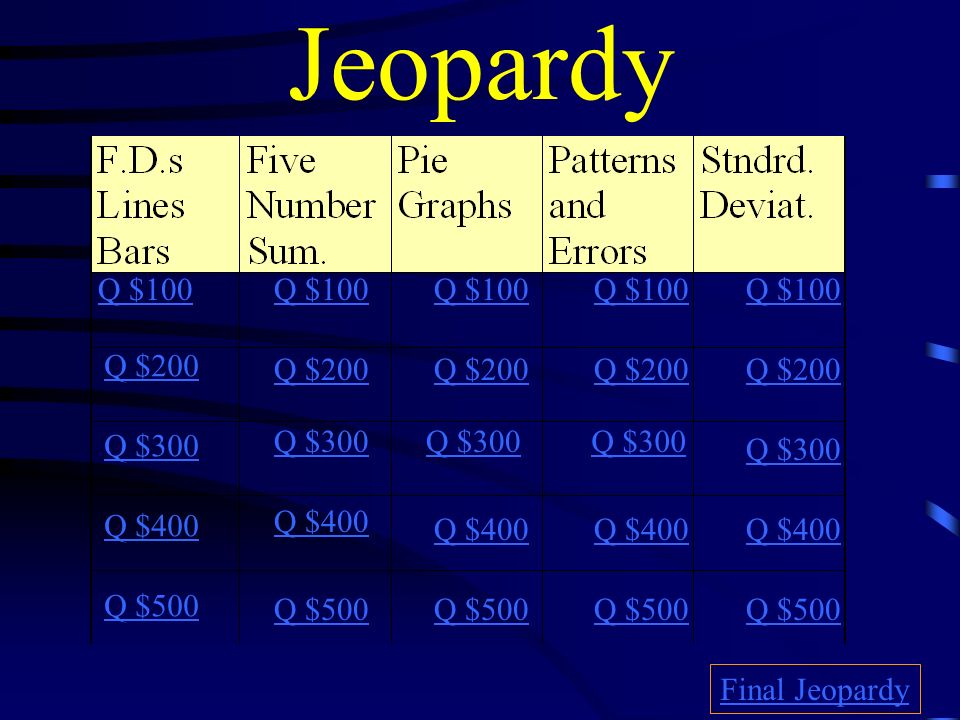
Jeopardy Q $100 Q $200 Q $300 Q $400 Q $500 Q $100 Q $200 Q $300 Q $400 Q $500 Final Jeopardy

3
$100 Question How do you find Class Limits before you make a frequency distribution table?

4
$100 Answer Max – Min = Range Width = Range / # Classes

5
$200 Question What is the name of the graphs that we use with a Frequency Distribution table?

6
$200 Answer Histograms

7
$300 Question What type of graph do we use when a person wants to represent change over time?

8
$300 Answer Line Graph

9
$400 Question What are three of the most common mistakes when setting up class limits?

10
$400 Answer 1.Classes include every # in the data set 2.Classes must not overlap 3.Class widths all the same 4.No less than 5 or more than 20 classes. 5.No gaps between the classes

11
$500 Question What are the steps for setting up a frequency table?

12
$500 Answer 1.Find your range (max-min) 2.Class widths (range/# classes) 3.Define class limits (table) 4.Tally data 5.Total
 2.Class widths (range/# classes) 3.Define class limits (table) 4.Tally data 5.Total")
13
$100 Question What are the mean median and mode of a data set?

14
$100 Answer Median = Middle Number Mean = Average Mode = Most Common

15
$200 Question What are the quartiles?

16
$200 Answer They are the medians between the median and the max and min. OR they divide the data into fourths

17
$300 Question What is the graph that you use for a five number summary?

18
$300 Answer Box and Whisker Plot

19
$400 Question What is the mean, median and mode of this data? 60 766 80488 922266

20
$400 Answer Median = 88 Mean = 85 Mode = 92

21
$500 Question What is Q1 and Q3 In this set of data? 60 766 80488 922266

22
$500 Answer Q1 = 78 Q2 = 92

23
$100 Question When can we use Pie Graphs?

24
$100 Answer When we have parts of a whole. Data adds up to 100% (or 99.9% With rounding errors).
.")
25
$200 Question When given a percentage how do you find the degree measure of an angle?

26
$200 Answer 360 * % as decimal

27
$300 Question These are the percentages given and they do not add up to 100%. What type of error is this? 26.8%, 26.2%, 22.8%, 22.4%, 1.7%

28
$300 Answer Round off Error Rounding Error

29
$400 Question A straight line through the center of a circle creates an angle with a degree measure of what?

30
$400 Answer 180 Degrees

31
$500 Question Given the percentages find the degree measures for a pie chart: 22.22% 29.63% 18.52% 11.11% 11.11% 7.41%

32
$500 Answer 80.0 106.7 66.7 40.0 40.0 26.7

33
$100 Question What is an outlier?

34
$100 Answer Data that stands out compared to the overall pattern of the entire data.

35
$200 Question Given the data which one is the outlier: 2, 4, 22, 6, 1, 4, 1, 5, 7, 4

36
$200 Answer 22

37
$300 Question What is the pattern of this stem plot? 3489 433456 50012222 602344 7234

38
$300 Answer Symmetrical

39
$400 Question What is the pattern of this data? 4 89 5 44 6 78 7 0345 8 0000456789 9 0000345678234879234556768

40
$400 Answer Skewed to the left

41
$500 Question Looking at a Box plot (box and whisker) what do you look for to help you describe the pattern?
 what do you look for to help you describe the pattern")
42
$500 Answer Look at the whiskers. If they are: Equal = symmetrical Right longer = Right skewed Left Longer = Left Skewed

43
$100 Question What is Standard Deviation?

44
$100 Answer It is the average distance away from the mean. OR A measure of spread

45
$200 Question When finding standard deviation what do you do after you’ve ordered your data and found the mean?

46
$200 Answer Find the distance between the scores and the mean

47
$300 Question What are the next two steps after finding:

48
$300 Answer 1.Total all of those squared differences 2. Average these distances by dividing by (n-1) one less then the total.
 one less then the total..")
49
$400 Question Once you have variance how do you find standard deviation?

50
$400 Answer

51
$500 Question Find the Standard Deviation for the Number of hours of TV watched for a week 1, 3, 4, 5, 1, 8, 6

52
$500 Answer Mean = 4 Standard Deviation = 2.58

53
Final Jeopardy Find the 5 # summary, mean, mode and standard deviation of the number of miles I ran this week. 3, 2, 3, 4, 6, 8, 7

54
Final Jeopardy Answer Min 2, Q1 3, Med 4, Q3 7, Max 8 Mode = 3 Mean = 4.73 Deviation = 2.28

Similar presentations


 Then count the number of values.>")


