Download presentation
Presentation is loading. Please wait.

1
Biology and natural history of the virus
The Evolution of HIV Biology and natural history of the virus

2
3/5th’s of HIV+ cases in Africa
Fig Global incidence of HIV/AIDS. Number of cases and per cent of adults infected, ages Data from UNAIDS (2005). 1/5th in South and SE Asia AIDS, or Aquired Immune Deficiency Syndrome, first recognized by the medical community in 1981, has come to infect over 60 million people globally, and has already caused some 20 million deaths. It has become far more prevalent than estimates as recent as 1991 projected. As the map shows, AIDS is now truly a disease of developing nations, infecting some 28.5 million people in African countries south of the Sahara, 5.6 million in Southeast Asia, and 1.5 million in Latin America. Globally, AIDS is responsible for about 5% of all deaths annually; about 8,000 people die every day from it. This places AIDS high up on the world list of causes of death, above malaria, car accidents, murders and wars. According to the United Nations Joint Programme on AIDS (UNAIDS), it will have killed nearly 90 million people by the year As an epidemic, then, AIDS will come to rival the worst recorded in human history. These include the “Spanish” influenza of 1918, which killed 50 to 100 million in a matter of months, and the bubonic plague of 14th century Europe, which wiped out 30 to 40% of the world’s people (some 28 million). 3/5th’s of HIV+ cases in Africa
. 1/5th in South and SE Asia. AIDS, or Aquired Immune Deficiency Syndrome, first recognized by the medical community in 1981, has come to infect over 60 million people globally, and has already caused some 20 million deaths. It has become far more prevalent than estimates as recent as 1991 projected. As the map shows, AIDS is now truly a disease of developing nations, infecting some 28.5 million people in African countries south of the Sahara, 5.6 million in Southeast Asia, and 1.5 million in Latin America. Globally, AIDS is responsible for about 5% of all deaths annually; about 8,000 people die every day from it. This places AIDS high up on the world list of causes of death, above malaria, car accidents, murders and wars. According to the United Nations Joint Programme on AIDS (UNAIDS), it will have killed nearly 90 million people by the year As an epidemic, then, AIDS will come to rival the worst recorded in human history. These include the Spanish influenza of 1918, which killed 50 to 100 million in a matter of months, and the bubonic plague of 14th century Europe, which wiped out 30 to 40% of the world’s people (some 28 million). 3/5th’s of HIV+ cases in Africa.")
3
Three global epidemics
The spread of AIDS over the last 2 decades (Slide) has occurred via different routes. In Africa, the disease is spreading by heterosexual sex, whereas in the US and Western Europe, homosexual sex and needle sharing among IV drug users are the most common routes. In China, needles spread the disease among IV drug users, and then it was spread to the general population through transfusions of contaminated blood; now it is spreading via heterosexual sex.
 has occurred via different routes. In Africa, the disease is spreading by heterosexual sex, whereas in the US and Western Europe, homosexual sex and needle sharing among IV drug users are the most common routes. In China, needles spread the disease among IV drug users, and then it was spread to the general population through transfusions of contaminated blood; now it is spreading via heterosexual sex.")
4
Recent epidemic in Russia and Ukraine

5
The epidemic in Africa From UNAIDS (2006) Zimbabwe Botswana Swaziland
Lesotho Swaziland From UNAIDS (2006)
")
6
In sub-Saharan Africa Life expectancy at birth in Botswana

7
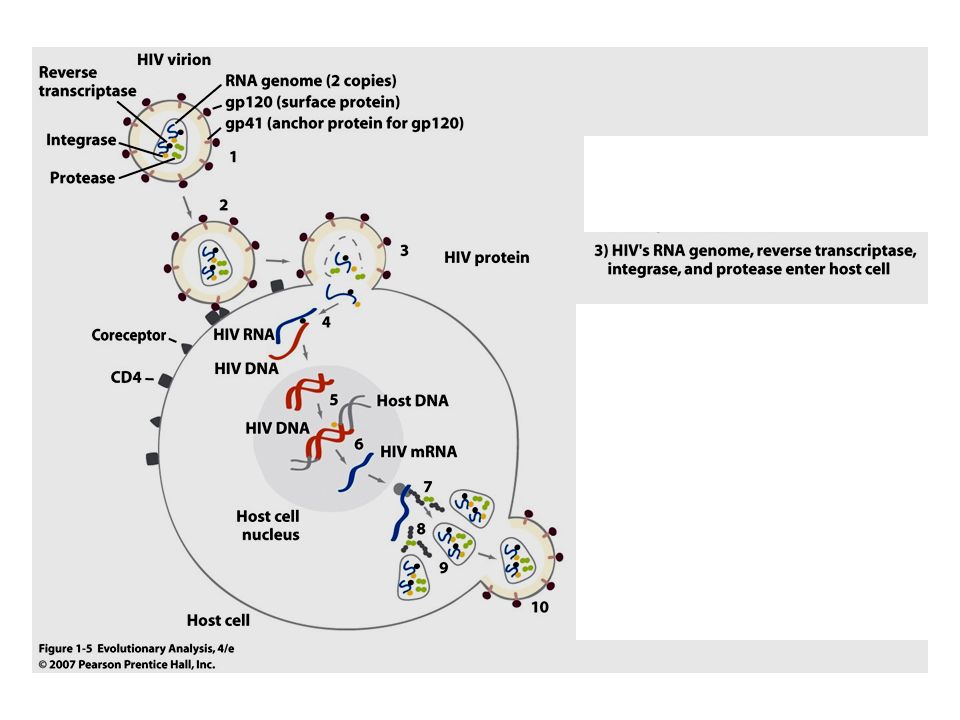
Fig. 1.5 The life cycle of HIV
Extracellular stage: transmission

8
Intracellular stage: replication

9
CD4 protein is found on T cells, HIV “uses” CD4 to invade them
CD4 serves important functions in the immune system

10
e.g. CD4 aids in binding of macrophages to helper T (TH) cells
stabilizes antigen “presentation” to TH cell TH cells play a central role in both pathways of immunity

12
HIV: a retrovirus—DNA is reverse-transcribed from viral RNA by reverse transcriptase

13
Intracellular replication stages

14
How does HIV cause AIDS? TEM of HIV budding (arrow) from a T lymphocyte (image: R. Hunt, Univ. S. Carolina) Simple answer: depletion of T cells killed by HIV replicating within them suppresses immunity, leading to opportunistic infections Complete answer: complex: immune activation hastens collapse by providing host cells close phylogenetic relative, SIV, provides useful model for studying this

16
Fig. 1.8a Viral load in an untreated patient
There are three phases of progression of the disease (Slide). During the acute phase, the virus replicates rapidly and apparently directly kills CD4 T-cells, the titer of which drops. Then the immune system mounts a response, and the titer of virus drops and the CD4 T-cell count recovers somewhat. This phase covers the first 12 weeks following infection. Next is the chronic phase, which typically lasts for several years and precedes the onset of AIDS. The chronic phase is marked by a slow but steady increase in the viral titer and a slow but steady drop in T-cell count. T-cells are both lysed by the virus and destroyed by the immune system, and they may be replaced more slowly by a compromised immune system. AIDS begins when the T-cell count drops below 200 cells per cc of blood. AIDS is characterized by persistent infections by fungal and bacterial pathogens that are rare in people with normal immune systems (e.g. Pneumocystis, Mycobacterium) and a host of other uncommon maladies typical of AIDS (Kaposi’s sarcoma). Untreated people most often die within 2-3 years. rapid increase, followed by drop, steady recovery (reflects immune response) evolution within patient of declining target cell selectivity
. During the acute phase, the virus replicates rapidly and apparently directly kills CD4 T-cells, the titer of which drops. Then the immune system mounts a response, and the titer of virus drops and the CD4 T-cell count recovers somewhat. This phase covers the first 12 weeks following infection. Next is the chronic phase, which typically lasts for several years and precedes the onset of AIDS. The chronic phase is marked by a slow but steady increase in the viral titer and a slow but steady drop in T-cell count. T-cells are both lysed by the virus and destroyed by the immune system, and they may be replaced more slowly by a compromised immune system. AIDS begins when the T-cell count drops below 200 cells per cc of blood. AIDS is characterized by persistent infections by fungal and bacterial pathogens that are rare in people with normal immune systems (e.g. Pneumocystis, Mycobacterium) and a host of other uncommon maladies typical of AIDS (Kaposi’s sarcoma). Untreated people most often die within 2-3 years. rapid increase, followed by drop, steady recovery (reflects immune response) evolution within patient of declining target cell selectivity.")
17
Fig. 1.8b T cell depletion There are three phases of progression of the disease (Slide). During the acute phase, the virus replicates rapidly and apparently directly kills CD4 T-cells, the titer of which drops. Then the immune system mounts a response, and the titer of virus drops and the CD4 T-cell count recovers somewhat. This phase covers the first 12 weeks following infection. Next is the chronic phase, which typically lasts for several years and precedes the onset of AIDS. The chronic phase is marked by a slow but steady increase in the viral titer and a slow but steady drop in T-cell count. T-cells are both lysed by the virus and destroyed by the immune system, and they may be replaced more slowly by a compromised immune system. AIDS begins when the T-cell count drops below 200 cells per cc of blood. AIDS is characterized by persistent infections by fungal and bacterial pathogens that are rare in people with normal immune systems (e.g. Pneumocystis, Mycobacterium) and a host of other uncommon maladies typical of AIDS (Kaposi’s sarcoma). Untreated people most often die within 2-3 years. decline, recovery, collapse of T cell population drastic decline in gut (vulnerable to pathogen attack) slow disease onset
. During the acute phase, the virus replicates rapidly and apparently directly kills CD4 T-cells, the titer of which drops. Then the immune system mounts a response, and the titer of virus drops and the CD4 T-cell count recovers somewhat. This phase covers the first 12 weeks following infection. Next is the chronic phase, which typically lasts for several years and precedes the onset of AIDS. The chronic phase is marked by a slow but steady increase in the viral titer and a slow but steady drop in T-cell count. T-cells are both lysed by the virus and destroyed by the immune system, and they may be replaced more slowly by a compromised immune system. AIDS begins when the T-cell count drops below 200 cells per cc of blood. AIDS is characterized by persistent infections by fungal and bacterial pathogens that are rare in people with normal immune systems (e.g. Pneumocystis, Mycobacterium) and a host of other uncommon maladies typical of AIDS (Kaposi’s sarcoma). Untreated people most often die within 2-3 years. decline, recovery, collapse of T cell population. drastic decline in gut (vulnerable to pathogen attack) slow disease onset.")
18
Fig. 1.8c Activation of the immune system
There are three phases of progression of the disease (Slide). During the acute phase, the virus replicates rapidly and apparently directly kills CD4 T-cells, the titer of which drops. Then the immune system mounts a response, and the titer of virus drops and the CD4 T-cell count recovers somewhat. This phase covers the first 12 weeks following infection. Next is the chronic phase, which typically lasts for several years and precedes the onset of AIDS. The chronic phase is marked by a slow but steady increase in the viral titer and a slow but steady drop in T-cell count. T-cells are both lysed by the virus and destroyed by the immune system, and they may be replaced more slowly by a compromised immune system. AIDS begins when the T-cell count drops below 200 cells per cc of blood. AIDS is characterized by persistent infections by fungal and bacterial pathogens that are rare in people with normal immune systems (e.g. Pneumocystis, Mycobacterium) and a host of other uncommon maladies typical of AIDS (Kaposi’s sarcoma). Untreated people most often die within 2-3 years. remains highly activated throughout! enhances rate of destruction of HIV infected cells, but provides steady source of host T cells exhausts limited capacity to re-supply killed T cells
. During the acute phase, the virus replicates rapidly and apparently directly kills CD4 T-cells, the titer of which drops. Then the immune system mounts a response, and the titer of virus drops and the CD4 T-cell count recovers somewhat. This phase covers the first 12 weeks following infection. Next is the chronic phase, which typically lasts for several years and precedes the onset of AIDS. The chronic phase is marked by a slow but steady increase in the viral titer and a slow but steady drop in T-cell count. T-cells are both lysed by the virus and destroyed by the immune system, and they may be replaced more slowly by a compromised immune system. AIDS begins when the T-cell count drops below 200 cells per cc of blood. AIDS is characterized by persistent infections by fungal and bacterial pathogens that are rare in people with normal immune systems (e.g. Pneumocystis, Mycobacterium) and a host of other uncommon maladies typical of AIDS (Kaposi’s sarcoma). Untreated people most often die within 2-3 years. remains highly activated throughout! enhances rate of destruction of HIV infected cells, but. provides steady source of host T cells. exhausts limited capacity to re-supply killed T cells.")
19
Why do AZT and other antiviral drugs fail over the long term?
The evolution of HIV Why do AZT and other antiviral drugs fail over the long term?

20
Fig. 1.9 How AZT blocks DNA synthesis by HIV reverse transcriptase
RT mistakes azido-thymidine (AZT) for the normal nucleoside (T)
 for the normal nucleoside (T)")
21
Fig. 1.9 How AZT blocks DNA synthesis by the reverse transcriptase of HIV
the azide group on AZT stops DNA synthesis and RT falls off

22
AZT treatments Initially, low doses dropped viral load, increased CD4 T cell counts Increasing doses, over time, lost effectiveness No evidence that patient’s enzymatic activation of AZT declined

23
Evolution of AZT resistance
A change in the genetic composition of patient’s viral population? To test Sample virus from patient over time as AZT treatment progresses Grow virus on cells in culture Test inhibitory action of increasing doses of AZT

24
Fig. 1.11 Evolution of AZT resistance within individual patients
from Larder et al. (1989)
")
25
HIV populations can take only 6 months to evolve high AZT resistance

26
Some random reverse transcriptase mutations will cause “shape changes” in the active site (arrow), allowing them to recognize and not pick up AZT
, allowing them to recognize and not pick up AZT")
27
Space-filling model of reverse transcriptase [from Cohen (1993)]
Space-filling model of reverse transcriptase [from Cohen (1993)]. The large groove is where RNA template and nucleotides bind. Drug resistance mutations (in red: includes the AZTR mutations) are located within this groove
![Space-filling model of reverse transcriptase [from Cohen (1993)]](http://slideplayer.com/slide/6401316/22/images/27/Space-filling+model+of+reverse+transcriptase+%5Bfrom+Cohen+%281993%29%5D.jpg "Space-filling model of reverse transcriptase [from Cohen (1993)]. The large groove is where RNA template and nucleotides bind. Drug resistance mutations (in red: includes the AZTR mutations) are located within this groove.")
28
Fig. 1.14 How populations of HIV evolve AZT resistance (through natural selection within patients)
")
29
HIV mutation rates High replication rate: 10 million to 100 million new virions per day (Ho et al. 1995, Wei et al. 1995) High reverse transcriptase mutation rate (~1 mutation/genome/ replication) polymerase is error prone HIV lacks DNA repair
 polymerase is error prone. HIV lacks DNA repair.")
Similar presentations


 Glycoprotein envelope with protein knobs on surface. Core is cone-shaped & contains RNA and the.>")


 A Design by Jeanine Nasser.>")


 is the virus that causes Acquired Immunodeficiency Syndrome (AIDS).>")


