Download presentation
Presentation is loading. Please wait.

1
Clinical Trials for Quality of Life Endpoints in Oncology Oncology Education Session Rochester, November 1, 2005 Oncology Education Session Rochester, November 1, 2005 Jeff A. Sloan, Ph.D. Mayo Clinic, Rochester, MN, USA

2
QOL challenges Reliability: if I were to use this tool under the same conditions would I get the same results? Reliability: if I were to use this tool under the same conditions would I get the same results? Validity: am I measuring what I want to measure? Validity: am I measuring what I want to measure? Missing data: imputation, design considerations Missing data: imputation, design considerations Response shift: hospice patients at 75% Response shift: hospice patients at 75% Reliability: if I were to use this tool under the same conditions would I get the same results? Reliability: if I were to use this tool under the same conditions would I get the same results? Validity: am I measuring what I want to measure? Validity: am I measuring what I want to measure? Missing data: imputation, design considerations Missing data: imputation, design considerations Response shift: hospice patients at 75% Response shift: hospice patients at 75%

3
Take home message: there is good news There are problems with using QOL assessments as indicators of efficacy in clinical trials. There are problems with using QOL assessments as indicators of efficacy in clinical trials. There are scientifically sound solutions to these problems. The problems have been disseminated widely and consistently. The solutions have not. There are scientifically sound solutions to these problems. The problems have been disseminated widely and consistently. The solutions have not. There are problems with using QOL assessments as indicators of efficacy in clinical trials. There are problems with using QOL assessments as indicators of efficacy in clinical trials. There are scientifically sound solutions to these problems. The problems have been disseminated widely and consistently. The solutions have not. There are scientifically sound solutions to these problems. The problems have been disseminated widely and consistently. The solutions have not.

4
Checklist for designing, conducting and reporting HRQL - PRO in clinical trials Patient Reported Outcomes (PRO) and Regulatory Issues : A European Guidance Document for the improved integration of health-related quality of life assessment in the drug regulatory process. Chassany O et ERIQA Working Group. Drug Information Journal 2002. HRQL / PRO objectives Added value of HRQL / PRO Choice of the questionnaires Hypotheses of HRQL / PRO changes Study design Basic principles of RCT fulfilled ? Timing and frequency of assessment Mode and site of administration... HRQL / PRO measure Description of the measure (items, domains…) Evidence of validity Evidence of cultural adaptation Statistical analysis plan Primary or secondary endpoint Superiority or equivalence trial Sample size ITT, type I error, missing data Reporting of results Participation rate, data completeness Distribution of HRQL / PRO scores Interpreting the results Effect size, Minimal Clinically Important Difference Comparison with other criteria / scores Number needed to treat…
 Evidence of validity Evidence of cultural adaptation Statistical analysis plan Primary or secondary endpoint Superiority or equivalence trial Sample size ITT, type I error, missing data Reporting of results Participation rate, data completeness Distribution of HRQL / PRO scores Interpreting the results Effect size, Minimal Clinically Important Difference Comparison with other criteria / scores Number needed to treat….")
5
EMEA RECOMMENDATIONS Points to consider (CPMP/EWP/562/98) on clinical investigation of medicinal products in the chronic treatment of patients with COPD, 1999 In the major efficacy studies of symptomatic benefit the primary endpoint should reflect the clinical benefit the applicant wishes to claim in the future SPC (Summary of Product Characteristics) In the major efficacy studies of symptomatic benefit the primary endpoint should reflect the clinical benefit the applicant wishes to claim in the future SPC (Summary of Product Characteristics) It should include the FEV1 as a measure of lung function and include a measure of symptomatic benefit It should include the FEV1 as a measure of lung function and include a measure of symptomatic benefit A significant benefit for both endpoints, should be demonstrated so that no multiplicity adjustment to significance levels is indicated A significant benefit for both endpoints, should be demonstrated so that no multiplicity adjustment to significance levels is indicated The primary symptomatic benefit endpoint should be justified by referencing published data which supports its validity; one example is the St George’s Respiratory Questionnaire The primary symptomatic benefit endpoint should be justified by referencing published data which supports its validity; one example is the St George’s Respiratory Questionnaire There are number of secondary endpoints which may provide useful information. … e.g. symptom scales, … and quality of life assessment There are number of secondary endpoints which may provide useful information. … e.g. symptom scales, … and quality of life assessment In the major efficacy studies of symptomatic benefit the primary endpoint should reflect the clinical benefit the applicant wishes to claim in the future SPC (Summary of Product Characteristics) In the major efficacy studies of symptomatic benefit the primary endpoint should reflect the clinical benefit the applicant wishes to claim in the future SPC (Summary of Product Characteristics) It should include the FEV1 as a measure of lung function and include a measure of symptomatic benefit It should include the FEV1 as a measure of lung function and include a measure of symptomatic benefit A significant benefit for both endpoints, should be demonstrated so that no multiplicity adjustment to significance levels is indicated A significant benefit for both endpoints, should be demonstrated so that no multiplicity adjustment to significance levels is indicated The primary symptomatic benefit endpoint should be justified by referencing published data which supports its validity; one example is the St George’s Respiratory Questionnaire The primary symptomatic benefit endpoint should be justified by referencing published data which supports its validity; one example is the St George’s Respiratory Questionnaire There are number of secondary endpoints which may provide useful information. … e.g. symptom scales, … and quality of life assessment There are number of secondary endpoints which may provide useful information. … e.g. symptom scales, … and quality of life assessment
 In the major efficacy studies of symptomatic benefit the primary endpoint should reflect the clinical benefit the applicant wishes to claim in the future SPC (Summary of Product Characteristics) It should include the FEV1 as a measure of lung function and include a measure of symptomatic benefit It should include the FEV1 as a measure of lung function and include a measure of symptomatic benefit A significant benefit for both endpoints, should be demonstrated so that no multiplicity adjustment to significance levels is indicated A significant benefit for both endpoints, should be demonstrated so that no multiplicity adjustment to significance levels is indicated The primary symptomatic benefit endpoint should be justified by referencing published data which supports its validity; one example is the St George’s Respiratory Questionnaire The primary symptomatic benefit endpoint should be justified by referencing published data which supports its validity; one example is the St George’s Respiratory Questionnaire There are number of secondary endpoints which may provide useful information. … e.g. symptom scales, … and quality of life assessment There are number of secondary endpoints which may provide useful information. … e.g. symptom scales, … and quality of life assessment.")
6
QOL: The big picture

7
Symptoms and QOL: Is there a difference? If you count the number of emetic episodes, you are assessing a symptom If you count the number of emetic episodes, you are assessing a symptom If you ask the patient how bad their nausea is, you are assessing QOL If you ask the patient how bad their nausea is, you are assessing QOL The measurement issues and analytical procedures are the same The measurement issues and analytical procedures are the same Literature is converging to the term patient-reported outcomes (PRO) Literature is converging to the term patient-reported outcomes (PRO) If you count the number of emetic episodes, you are assessing a symptom If you count the number of emetic episodes, you are assessing a symptom If you ask the patient how bad their nausea is, you are assessing QOL If you ask the patient how bad their nausea is, you are assessing QOL The measurement issues and analytical procedures are the same The measurement issues and analytical procedures are the same Literature is converging to the term patient-reported outcomes (PRO) Literature is converging to the term patient-reported outcomes (PRO)
 Literature is converging to the term patient-reported outcomes (PRO) If you count the number of emetic episodes, you are assessing a symptom If you count the number of emetic episodes, you are assessing a symptom If you ask the patient how bad their nausea is, you are assessing QOL If you ask the patient how bad their nausea is, you are assessing QOL The measurement issues and analytical procedures are the same The measurement issues and analytical procedures are the same Literature is converging to the term patient-reported outcomes (PRO) Literature is converging to the term patient-reported outcomes (PRO).")
8
Developmental Timeline of Commonly Used QOL Measurement Tools

9
What is an Appropriate QOL Instrument? Research objective (HYPOTHESIS DRIVEN) Research objective (HYPOTHESIS DRIVEN) Specific rationale for the QOL part of the study Specific rationale for the QOL part of the study Relevant domains of QOL (LIST & MATCH) Relevant domains of QOL (LIST & MATCH) Disease and patient population characteristics Disease and patient population characteristics Psychometric characteristics (reliability & validity) of QOL instrument Psychometric characteristics (reliability & validity) of QOL instrument Practical considerations (e.g. respondent burden, language translations) Practical considerations (e.g. respondent burden, language translations) Research objective (HYPOTHESIS DRIVEN) Research objective (HYPOTHESIS DRIVEN) Specific rationale for the QOL part of the study Specific rationale for the QOL part of the study Relevant domains of QOL (LIST & MATCH) Relevant domains of QOL (LIST & MATCH) Disease and patient population characteristics Disease and patient population characteristics Psychometric characteristics (reliability & validity) of QOL instrument Psychometric characteristics (reliability & validity) of QOL instrument Practical considerations (e.g. respondent burden, language translations) Practical considerations (e.g. respondent burden, language translations)
 Research objective (HYPOTHESIS DRIVEN) Specific rationale for the QOL part of the study Specific rationale for the QOL part of the study Relevant domains of QOL (LIST & MATCH) Relevant domains of QOL (LIST & MATCH) Disease and patient population characteristics Disease and patient population characteristics Psychometric characteristics (reliability & validity) of QOL instrument Psychometric characteristics (reliability & validity) of QOL instrument Practical considerations (e.g. respondent burden, language translations) Practical considerations (e.g. respondent burden, language translations) Research objective (HYPOTHESIS DRIVEN) Research objective (HYPOTHESIS DRIVEN) Specific rationale for the QOL part of the study Specific rationale for the QOL part of the study Relevant domains of QOL (LIST & MATCH) Relevant domains of QOL (LIST & MATCH) Disease and patient population characteristics Disease and patient population characteristics Psychometric characteristics (reliability & validity) of QOL instrument Psychometric characteristics (reliability & validity) of QOL instrument Practical considerations (e.g. respondent burden, language translations) Practical considerations (e.g. respondent burden, language translations).")
10
Timing of QOL Assessment Study objective Study objective Characteristics and natural course of disease Characteristics and natural course of disease Baseline and one follow-up QOL assessment are necessary Baseline and one follow-up QOL assessment are necessary Treatment regimen Treatment regimen Similar timing of QOL assessment across treatment arms Similar timing of QOL assessment across treatment arms Expected effects of the treatment Expected effects of the treatment Study objective Study objective Characteristics and natural course of disease Characteristics and natural course of disease Baseline and one follow-up QOL assessment are necessary Baseline and one follow-up QOL assessment are necessary Treatment regimen Treatment regimen Similar timing of QOL assessment across treatment arms Similar timing of QOL assessment across treatment arms Expected effects of the treatment Expected effects of the treatment

11
QOL Research Themes 1. Assess QOL within clinical trials with efficiency, consistency, specificity 2. Improve QOL methodology 3. Develop intervention studies targeted at QOL endpoints 1. Assess QOL within clinical trials with efficiency, consistency, specificity 2. Improve QOL methodology 3. Develop intervention studies targeted at QOL endpoints

12
QOL in NCCTG Clinical Trials Since 1995, 84 trials with QOL component Since 1995, 84 trials with QOL component >50 different QOL questionnaires used >50 different QOL questionnaires used >20 papers per year published with QOL >20 papers per year published with QOL Average baseline compliance rate: 94% Average baseline compliance rate: 94% Since 1995, 84 trials with QOL component Since 1995, 84 trials with QOL component >50 different QOL questionnaires used >50 different QOL questionnaires used >20 papers per year published with QOL >20 papers per year published with QOL Average baseline compliance rate: 94% Average baseline compliance rate: 94%

13
What underlies these QOL metrics? “NCCTG does not experience the problems that other groups report with respect to QOL”. “NCCTG does not experience the problems that other groups report with respect to QOL”. “Efforts to make the inclusion of QOL components in treatment trials easy and efficient have been well received by investigators”. (Integrating cancer control research into the CCOP network: a case study of the NCCTG, NCI, 2004) “Efforts to make the inclusion of QOL components in treatment trials easy and efficient have been well received by investigators”. (Integrating cancer control research into the CCOP network: a case study of the NCCTG, NCI, 2004) “NCCTG does not experience the problems that other groups report with respect to QOL”. “NCCTG does not experience the problems that other groups report with respect to QOL”. “Efforts to make the inclusion of QOL components in treatment trials easy and efficient have been well received by investigators”. (Integrating cancer control research into the CCOP network: a case study of the NCCTG, NCI, 2004) “Efforts to make the inclusion of QOL components in treatment trials easy and efficient have been well received by investigators”. (Integrating cancer control research into the CCOP network: a case study of the NCCTG, NCI, 2004)
 Efforts to make the inclusion of QOL components in treatment trials easy and efficient have been well received by investigators . (Integrating cancer control research into the CCOP network: a case study of the NCCTG, NCI, 2004) NCCTG does not experience the problems that other groups report with respect to QOL . NCCTG does not experience the problems that other groups report with respect to QOL . Efforts to make the inclusion of QOL components in treatment trials easy and efficient have been well received by investigators . (Integrating cancer control research into the CCOP network: a case study of the NCCTG, NCI, 2004) Efforts to make the inclusion of QOL components in treatment trials easy and efficient have been well received by investigators . (Integrating cancer control research into the CCOP network: a case study of the NCCTG, NCI, 2004).")
14
QOL Team Resources MD tumor group liaisons MD tumor group liaisons Operations manual Operations manual Forms bank Forms bank Literature bank Literature bank Background templates Background templates Web-based utilities Web-based utilities MD tumor group liaisons MD tumor group liaisons Operations manual Operations manual Forms bank Forms bank Literature bank Literature bank Background templates Background templates Web-based utilities Web-based utilities

15
Cancer Patient Assessment Cancer patient assessment involves tumor growth and survival data. Cancer patient assessment involves tumor growth and survival data. We measure these scientifically and the effect of interventions on these endpoints. We measure these scientifically and the effect of interventions on these endpoints. Cancer also involves other things besides tumors and reduced lifespan that can be measured….. Cancer also involves other things besides tumors and reduced lifespan that can be measured….. Cancer patient assessment involves tumor growth and survival data. Cancer patient assessment involves tumor growth and survival data. We measure these scientifically and the effect of interventions on these endpoints. We measure these scientifically and the effect of interventions on these endpoints. Cancer also involves other things besides tumors and reduced lifespan that can be measured….. Cancer also involves other things besides tumors and reduced lifespan that can be measured…..

16
… by answering scientific questions What is the value added of loooooong QOL assessments to treatment trials? What is the value added of loooooong QOL assessments to treatment trials? What is the evidence for the use of single-item QOL assessments? What is the evidence for the use of single-item QOL assessments? How do you deal with multiple endpoints? How do you deal with multiple endpoints? How do you handle missing data? How do you handle missing data? What is the clinical significance of QOL assessments? What is the clinical significance of QOL assessments? What is the value added of loooooong QOL assessments to treatment trials? What is the value added of loooooong QOL assessments to treatment trials? What is the evidence for the use of single-item QOL assessments? What is the evidence for the use of single-item QOL assessments? How do you deal with multiple endpoints? How do you deal with multiple endpoints? How do you handle missing data? How do you handle missing data? What is the clinical significance of QOL assessments? What is the clinical significance of QOL assessments?

17
What is the value added of additional questions?

18
Less is More Numerous studies indicate shorter assessments are “just as good” as longer assessments Numerous studies indicate shorter assessments are “just as good” as longer assessments Bernhard. single item quality of life indicators in cancer clinical trials. Brit J Cancer 84(9)1156-1165, 2002 Bernhard. single item quality of life indicators in cancer clinical trials. Brit J Cancer 84(9)1156-1165, 2002 Vickers. Contolled Clinical Trials, 24: 731 – 735, 2003 Vickers. Contolled Clinical Trials, 24: 731 – 735, 2003 Abdel-Khalek. Measuring anxiety. Death Studies 22(8):763-772, 1998 Abdel-Khalek. Measuring anxiety. Death Studies 22(8):763-772, 1998 Gardner. Ed Psych Measurement 58(6):898-915, 1998 Gardner. Ed Psych Measurement 58(6):898-915, 1998 Sloan. Overall QOL. JCO 16:3662-3673, 1998 Sloan. Overall QOL. JCO 16:3662-3673, 1998 Sloan. Clinical significance of single items relative to summated scores. Mayo Clinic Proc 77: 479-487, 2002 Sloan. Clinical significance of single items relative to summated scores. Mayo Clinic Proc 77: 479-487, 2002 Numerous studies indicate shorter assessments are “just as good” as longer assessments Numerous studies indicate shorter assessments are “just as good” as longer assessments Bernhard. single item quality of life indicators in cancer clinical trials. Brit J Cancer 84(9)1156-1165, 2002 Bernhard. single item quality of life indicators in cancer clinical trials. Brit J Cancer 84(9)1156-1165, 2002 Vickers. Contolled Clinical Trials, 24: 731 – 735, 2003 Vickers. Contolled Clinical Trials, 24: 731 – 735, 2003 Abdel-Khalek. Measuring anxiety. Death Studies 22(8):763-772, 1998 Abdel-Khalek. Measuring anxiety. Death Studies 22(8):763-772, 1998 Gardner. Ed Psych Measurement 58(6):898-915, 1998 Gardner. Ed Psych Measurement 58(6):898-915, 1998 Sloan. Overall QOL. JCO 16:3662-3673, 1998 Sloan. Overall QOL. JCO 16:3662-3673, 1998 Sloan. Clinical significance of single items relative to summated scores. Mayo Clinic Proc 77: 479-487, 2002 Sloan. Clinical significance of single items relative to summated scores. Mayo Clinic Proc 77: 479-487, 2002
 , 2002 Bernhard. single item quality of life indicators in cancer clinical trials. Brit J Cancer 84(9) , 2002 Vickers. Contolled Clinical Trials, 24: 731 – 735, 2003 Vickers. Contolled Clinical Trials, 24: 731 – 735, 2003 Abdel-Khalek. Measuring anxiety. Death Studies 22(8): , 1998 Abdel-Khalek. Measuring anxiety. Death Studies 22(8): , 1998 Gardner. Ed Psych Measurement 58(6): , 1998 Gardner. Ed Psych Measurement 58(6): , 1998 Sloan. Overall QOL. JCO 16: , 1998 Sloan. Overall QOL. JCO 16: , 1998 Sloan. Clinical significance of single items relative to summated scores. Mayo Clinic Proc 77: , 2002 Sloan. Clinical significance of single items relative to summated scores. Mayo Clinic Proc 77: , 2002 Numerous studies indicate shorter assessments are just as good as longer assessments Numerous studies indicate shorter assessments are just as good as longer assessments Bernhard. single item quality of life indicators in cancer clinical trials. Brit J Cancer 84(9) , 2002 Bernhard. single item quality of life indicators in cancer clinical trials. Brit J Cancer 84(9) , 2002 Vickers. Contolled Clinical Trials, 24: 731 – 735, 2003 Vickers. Contolled Clinical Trials, 24: 731 – 735, 2003 Abdel-Khalek. Measuring anxiety. Death Studies 22(8): , 1998 Abdel-Khalek. Measuring anxiety. Death Studies 22(8): , 1998 Gardner. Ed Psych Measurement 58(6): , 1998 Gardner. Ed Psych Measurement 58(6): , 1998 Sloan. Overall QOL. JCO 16: , 1998 Sloan. Overall QOL. JCO 16: , 1998 Sloan. Clinical significance of single items relative to summated scores. Mayo Clinic Proc 77: , 2002 Sloan. Clinical significance of single items relative to summated scores. Mayo Clinic Proc 77: ,")
19
Sloan et al, Biopharm Stat 14(1): 73-96, 2004.
: 73-96, 2004.")
20
Single-Item or Multiple-Item PRO? Sloan et al, Mayo Clinic Proc 77: 479-487, 2002.

21
A Comparison of Simple Single-Item Measures and the Common Toxicity Criteria in Detecting the Onset of Oxaliplatin-Induced Peripheral Neuropathy in Patients with Colorectal Cancer R. F. Morton, J. A. Sloan, A. Grothey, D. J. Sargent, H. McLeod, E. M. Green, C. Fuchs, R. K. Ramanathan, S. K. Williamson, R. M. Goldberg ASCO 2005

22
Peripheral neuropathy (PN) is common during treatment with Oxaliplatin Peripheral neuropathy (PN) is common during treatment with Oxaliplatin Assessment of PN is historically done via the Common Toxicity Criteria (CTC) Assessment of PN is historically done via the Common Toxicity Criteria (CTC) We developed a single-item numerical analogue scale assessment to help measure PN We developed a single-item numerical analogue scale assessment to help measure PN We compared the two measures to look at the sensitivity of the CTC in detecting the onset of PN We compared the two measures to look at the sensitivity of the CTC in detecting the onset of PN Peripheral neuropathy (PN) is common during treatment with Oxaliplatin Peripheral neuropathy (PN) is common during treatment with Oxaliplatin Assessment of PN is historically done via the Common Toxicity Criteria (CTC) Assessment of PN is historically done via the Common Toxicity Criteria (CTC) We developed a single-item numerical analogue scale assessment to help measure PN We developed a single-item numerical analogue scale assessment to help measure PN We compared the two measures to look at the sensitivity of the CTC in detecting the onset of PN We compared the two measures to look at the sensitivity of the CTC in detecting the onset of PN Background
 is common during treatment with Oxaliplatin Peripheral neuropathy (PN) is common during treatment with Oxaliplatin Assessment of PN is historically done via the Common Toxicity Criteria (CTC) Assessment of PN is historically done via the Common Toxicity Criteria (CTC) We developed a single-item numerical analogue scale assessment to help measure PN We developed a single-item numerical analogue scale assessment to help measure PN We compared the two measures to look at the sensitivity of the CTC in detecting the onset of PN We compared the two measures to look at the sensitivity of the CTC in detecting the onset of PN Peripheral neuropathy (PN) is common during treatment with Oxaliplatin Peripheral neuropathy (PN) is common during treatment with Oxaliplatin Assessment of PN is historically done via the Common Toxicity Criteria (CTC) Assessment of PN is historically done via the Common Toxicity Criteria (CTC) We developed a single-item numerical analogue scale assessment to help measure PN We developed a single-item numerical analogue scale assessment to help measure PN We compared the two measures to look at the sensitivity of the CTC in detecting the onset of PN We compared the two measures to look at the sensitivity of the CTC in detecting the onset of PN Background")
23
696 patients randomized to FOLFOX4 696 patients randomized to FOLFOX4 PN assessed bi-weekly during treatment PN assessed bi-weekly during treatment NAS filled out at baseline and every 12 weeks during treatment NAS filled out at baseline and every 12 weeks during treatment 696 patients randomized to FOLFOX4 696 patients randomized to FOLFOX4 PN assessed bi-weekly during treatment PN assessed bi-weekly during treatment NAS filled out at baseline and every 12 weeks during treatment NAS filled out at baseline and every 12 weeks during treatment Methods

24
IFL: Irinotecan + 5-FU/LV IFL: Irinotecan + 5-FU/LV IROX: Irinotecan + Oxaliplatin FOLFOX4: Oxaliplatin + 5-FU/LV RANDOMIRANDOMIZATZATIONIONRANDOMIRANDOMIZATZATIONION Goldberg et al, JCO 2004 NCCTG/Intergroup Trial N9741

25
NAS Tools

26
According to CTC only 20% of patients experienced serious PN According to CTC only 20% of patients experienced serious PN Clinical knowledge suggested the incidence rate should be much higher (about 80%) Clinical knowledge suggested the incidence rate should be much higher (about 80%) According to CTC only 20% of patients experienced serious PN According to CTC only 20% of patients experienced serious PN Clinical knowledge suggested the incidence rate should be much higher (about 80%) Clinical knowledge suggested the incidence rate should be much higher (about 80%) An Empirical Anomaly
 Clinical knowledge suggested the incidence rate should be much higher (about 80%) According to CTC only 20% of patients experienced serious PN According to CTC only 20% of patients experienced serious PN Clinical knowledge suggested the incidence rate should be much higher (about 80%) Clinical knowledge suggested the incidence rate should be much higher (about 80%) An Empirical Anomaly")
27
2 Point Change in QOL No(N=420)Yes(N=276) % Agreement Kappa Statistic Grade 2+ PN No (N=440) 30813265%0.25 Yes(N=256)112144 Grade 3+ PN No(N=597)38021763%0.13 Yes(N=99)4059 The agreement of < 65% indicates CTC and NAS measure different aspects of PN. Agreement

28
Dose to PN: CTC versus NAS Which Comes First? Median dose to NAS CSD of 424 mg/m2 versus 765 ( 961) mg/m2 for CTC grade 2+ (3+) event
 mg/m2 for CTC grade 2+ (3+) event.")
29
Time to PN: CTC versus NAS Which Comes First? Patients notice an increase in PN two or three months earlier via the NAS

30
Grade 2+ PN is found to be a significant problem according to the NAS Grade 2+ PN is found to be a significant problem according to the NAS Using CTC, PN is under-reported Using CTC, PN is under-reported NAS may allow for earlier detection NAS may allow for earlier detection NAS should be used in conjunction with CTC NAS should be used in conjunction with CTC Grade 2+ PN is found to be a significant problem according to the NAS Grade 2+ PN is found to be a significant problem according to the NAS Using CTC, PN is under-reported Using CTC, PN is under-reported NAS may allow for earlier detection NAS may allow for earlier detection NAS should be used in conjunction with CTC NAS should be used in conjunction with CTC Conclusions

31
Are the occurrence of adverse events and clinically significant changes in symptom specific and global quality of life measures predictable? Sumithra J. Mandrekar, Ph.D. Mashele M. Huschka, B.S. James R. Jett, M.D. Jeff A. Sloan, Ph.D. Mayo Clinic Rochester, MN Sumithra J. Mandrekar, Ph.D. Mashele M. Huschka, B.S. James R. Jett, M.D. Jeff A. Sloan, Ph.D. Mayo Clinic Rochester, MN

32
NCCTG Lung Cancer Trials Study Number DescriptionSample SizeAssessmentsAssessment Schedule 95-20-53 A Pilot Study of High-Dose Thoracic Radiation Therapy w/ Concomitant Cisplatin/Etoposide in Limited-Stage SCLC 76 Uniscale LCSS Baseline, prior to irradiation, prior to last cycle and at 3 months, 1 year & 2 year follow-up visits 95-24-52 A Phase II Trial of Edatrexate in Combo w/ Vinblastine, Adriamycin, Cisplatin & Filgrastim in Pts w/ Advanced NSCLC 34 Uniscale FACT-L v3 Baseline and prior to each treatment cycle 97-24-51 Phase III Randomized, Double-Blind Study of CAI & Placebo w/ Advanced NSCLC 177 Uniscale FACT-L v4 Baseline and monthly during course of treatment 98-24-52 Randomized Phase II Study of Docetaxel & Gemcitabine for Stage IIIB/IV NSCLC 99 Uniscale LCCS Baseline and prior to each treatment cycle N0021 Phase II Study of Gemcitabine and Epirubicin for the Treatment of Mesothelioma 68 Uniscale SDS Baseline, at each evaluation and 3 months & 1 year follow-up visits N0022 Oral Vinorelbine For the Treatment of Metastatic Non-Small Cell Lung Cancer in Patients >= 65 Years of Age: A Phase II Trial of Efficacy, Toxicity, and Patients' Perceived Preference for Oral Therapy 58 Uniscale LCSS Baseline and immediately after completion of second cycle of chemotherapy

33
QOL Assessments Spitzer’s Uniscale Spitzer’s Uniscale 1 question for the global assessment of QOL 1 question for the global assessment of QOL Functional Assessment of Cancer Therapy Lung (FACT-L) Functional Assessment of Cancer Therapy Lung (FACT-L) 27 questions divided into 4 well-being constructs: physical, social/family, emotional, and functional 27 questions divided into 4 well-being constructs: physical, social/family, emotional, and functional 10 questions specific to lung cancer 10 questions specific to lung cancer Lung Cancer Symptom Scale (LCSS) Lung Cancer Symptom Scale (LCSS) 9 questions pertaining to lung cancer symptoms 9 questions pertaining to lung cancer symptoms Symptom Distress Scale (SDS) Symptom Distress Scale (SDS) 12 questions related to symptoms commonly experienced by cancer patients 12 questions related to symptoms commonly experienced by cancer patients Spitzer’s Uniscale Spitzer’s Uniscale 1 question for the global assessment of QOL 1 question for the global assessment of QOL Functional Assessment of Cancer Therapy Lung (FACT-L) Functional Assessment of Cancer Therapy Lung (FACT-L) 27 questions divided into 4 well-being constructs: physical, social/family, emotional, and functional 27 questions divided into 4 well-being constructs: physical, social/family, emotional, and functional 10 questions specific to lung cancer 10 questions specific to lung cancer Lung Cancer Symptom Scale (LCSS) Lung Cancer Symptom Scale (LCSS) 9 questions pertaining to lung cancer symptoms 9 questions pertaining to lung cancer symptoms Symptom Distress Scale (SDS) Symptom Distress Scale (SDS) 12 questions related to symptoms commonly experienced by cancer patients 12 questions related to symptoms commonly experienced by cancer patients
 Functional Assessment of Cancer Therapy Lung (FACT-L) 27 questions divided into 4 well-being constructs: physical, social/family, emotional, and functional 27 questions divided into 4 well-being constructs: physical, social/family, emotional, and functional 10 questions specific to lung cancer 10 questions specific to lung cancer Lung Cancer Symptom Scale (LCSS) Lung Cancer Symptom Scale (LCSS) 9 questions pertaining to lung cancer symptoms 9 questions pertaining to lung cancer symptoms Symptom Distress Scale (SDS) Symptom Distress Scale (SDS) 12 questions related to symptoms commonly experienced by cancer patients 12 questions related to symptoms commonly experienced by cancer patients Spitzer’s Uniscale Spitzer’s Uniscale 1 question for the global assessment of QOL 1 question for the global assessment of QOL Functional Assessment of Cancer Therapy Lung (FACT-L) Functional Assessment of Cancer Therapy Lung (FACT-L) 27 questions divided into 4 well-being constructs: physical, social/family, emotional, and functional 27 questions divided into 4 well-being constructs: physical, social/family, emotional, and functional 10 questions specific to lung cancer 10 questions specific to lung cancer Lung Cancer Symptom Scale (LCSS) Lung Cancer Symptom Scale (LCSS) 9 questions pertaining to lung cancer symptoms 9 questions pertaining to lung cancer symptoms Symptom Distress Scale (SDS) Symptom Distress Scale (SDS) 12 questions related to symptoms commonly experienced by cancer patients 12 questions related to symptoms commonly experienced by cancer patients")
34
Determine the relationship of a single-item assessment with the multiple-item summated scales

35
Post-Baseline QOL FACT-L & Uniscale (N=148) LCSS & Uniscale (N=164) SDS & Uniscale (N=46) Total (N=358) Uniscale Mean (SD)71.1 (19.13)68.6 (25.44)65.5 (23.05)69.6 (22.31) Median75.076.568.575.0 Range(0.0-97.0)(1.0-100.0)(4.0-97.0)(0.0-100.0) Multiple-items Mean (SD)74.9 (12.26)72.0 (16.26)73.9 (14.53)73.6 (14.22) Median75.774.077.975.2 Range(30.7-99.3)(0.0-99.3)(38.5-96.2)(0.0-99.3) Spearman Rank Correlations between the Uniscale and the FACT-L, LCSS, and SDS were 0.66, 0.57, and 0.49 respectively
 LCSS & Uniscale (N=164) SDS & Uniscale (N=46) Total (N=358) Uniscale Mean (SD)71.1 (19.13)68.6 (25.44)65.5 (23.05)69.6 (22.31) Median Range( )( )( )( ) Multiple-items Mean (SD)74.9 (12.26)72.0 (16.26)73.9 (14.53)73.6 (14.22) Median Range( )( )( )( ) Spearman Rank Correlations between the Uniscale and the FACT-L, LCSS, and SDS were 0.66, 0.57, and 0.49 respectively")
36
Correlation=0.43 When QOL is high: Uniscale > LCSS When QOL is low: Uniscale < LCSS Greater variability in Uniscale Scores

37
Determine if clinically significant declines are more readily detected by a single-item or multiple-item assessment

38
Individual Patient Data over time; Greater variability in Uniscale Scores

39
Clinically Significant Decline (CSD) [10-point decline on a 0-100 scale] FACT-L & Uniscale (N=120)* LCSS & Uniscale (N=152)* SDS & Uniscale (N=45)* Total (N=317)* Uniscale n (%)73 (60.8%)91 (59.9%)20 (44.4%)184 (58.0%) Multiple-items n (%)46 (38.3%)66 (43.4%)13 (28.9%)125 (39.4%) Percent Agreement56%59%71%59% *Represents the number of patients that completed the Uniscale at baseline and at least once post-baseline and completed a multiple-item assessment at baseline and at least once post-baseline Uniscale more likely to detect a CSD in QOL than the multiple-item assessments (58% vs. 39%) The overall percent agreement in detecting a CSD in QOL between Uniscale and multiple-item assessments was 59%
![Clinically Significant Decline (CSD) [10-point decline on a scale] FACT-L & Uniscale (N=120)* LCSS & Uniscale (N=152)* SDS & Uniscale (N=45)* Total (N=317)* Uniscale n (%)73 (60.8%)91 (59.9%)20 (44.4%)184 (58.0%) Multiple-items n (%)46 (38.3%)66 (43.4%)13 (28.9%)125 (39.4%) Percent Agreement56%59%71%59% *Represents the number of patients that completed the Uniscale at baseline and at least once post-baseline and completed a multiple-item assessment at baseline and at least once post-baseline Uniscale more likely to detect a CSD in QOL than the multiple-item assessments (58% vs.](http://images.slideplayer.com/22/6398504/slides/slide_39.jpg "39%) The overall percent agreement in detecting a CSD in QOL between Uniscale and multiple-item assessments was 59%.")
40
Determine how single-item assessment and multiple-item summated scales relate to adverse events data

41
Adverse Events (AE) Severe adverse event is defined as a grade 3, 4, or 5, regardless of attribution Severe adverse event is defined as a grade 3, 4, or 5, regardless of attribution 33% experienced a severe AE post baseline 33% experienced a severe AE post baseline Nine AEs experienced by at least 2% of the population that can also be collected via a QOL instrument Nine AEs experienced by at least 2% of the population that can also be collected via a QOL instrument Alopecia, Anorexia, Constipation, Diarrhea, Dyspnea, Fatigue, Nausea, Neurosensory, Vomiting Alopecia, Anorexia, Constipation, Diarrhea, Dyspnea, Fatigue, Nausea, Neurosensory, Vomiting 95% experienced at least one of the nine AEs 95% experienced at least one of the nine AEs 20% had at least one of the nine graded as severe 20% had at least one of the nine graded as severe CSD in AE is defined as a baseline AE of grade 0, 1, or 2 that changes to a grade 3, 4, or 5 post baseline CSD in AE is defined as a baseline AE of grade 0, 1, or 2 that changes to a grade 3, 4, or 5 post baseline Severe adverse event is defined as a grade 3, 4, or 5, regardless of attribution Severe adverse event is defined as a grade 3, 4, or 5, regardless of attribution 33% experienced a severe AE post baseline 33% experienced a severe AE post baseline Nine AEs experienced by at least 2% of the population that can also be collected via a QOL instrument Nine AEs experienced by at least 2% of the population that can also be collected via a QOL instrument Alopecia, Anorexia, Constipation, Diarrhea, Dyspnea, Fatigue, Nausea, Neurosensory, Vomiting Alopecia, Anorexia, Constipation, Diarrhea, Dyspnea, Fatigue, Nausea, Neurosensory, Vomiting 95% experienced at least one of the nine AEs 95% experienced at least one of the nine AEs 20% had at least one of the nine graded as severe 20% had at least one of the nine graded as severe CSD in AE is defined as a baseline AE of grade 0, 1, or 2 that changes to a grade 3, 4, or 5 post baseline CSD in AE is defined as a baseline AE of grade 0, 1, or 2 that changes to a grade 3, 4, or 5 post baseline
 Severe adverse event is defined as a grade 3, 4, or 5, regardless of attribution Severe adverse event is defined as a grade 3, 4, or 5, regardless of attribution 33% experienced a severe AE post baseline 33% experienced a severe AE post baseline Nine AEs experienced by at least 2% of the population that can also be collected via a QOL instrument Nine AEs experienced by at least 2% of the population that can also be collected via a QOL instrument Alopecia, Anorexia, Constipation, Diarrhea, Dyspnea, Fatigue, Nausea, Neurosensory, Vomiting Alopecia, Anorexia, Constipation, Diarrhea, Dyspnea, Fatigue, Nausea, Neurosensory, Vomiting 95% experienced at least one of the nine AEs 95% experienced at least one of the nine AEs 20% had at least one of the nine graded as severe 20% had at least one of the nine graded as severe CSD in AE is defined as a baseline AE of grade 0, 1, or 2 that changes to a grade 3, 4, or 5 post baseline CSD in AE is defined as a baseline AE of grade 0, 1, or 2 that changes to a grade 3, 4, or 5 post baseline Severe adverse event is defined as a grade 3, 4, or 5, regardless of attribution Severe adverse event is defined as a grade 3, 4, or 5, regardless of attribution 33% experienced a severe AE post baseline 33% experienced a severe AE post baseline Nine AEs experienced by at least 2% of the population that can also be collected via a QOL instrument Nine AEs experienced by at least 2% of the population that can also be collected via a QOL instrument Alopecia, Anorexia, Constipation, Diarrhea, Dyspnea, Fatigue, Nausea, Neurosensory, Vomiting Alopecia, Anorexia, Constipation, Diarrhea, Dyspnea, Fatigue, Nausea, Neurosensory, Vomiting 95% experienced at least one of the nine AEs 95% experienced at least one of the nine AEs 20% had at least one of the nine graded as severe 20% had at least one of the nine graded as severe CSD in AE is defined as a baseline AE of grade 0, 1, or 2 that changes to a grade 3, 4, or 5 post baseline CSD in AE is defined as a baseline AE of grade 0, 1, or 2 that changes to a grade 3, 4, or 5 post baseline")
42
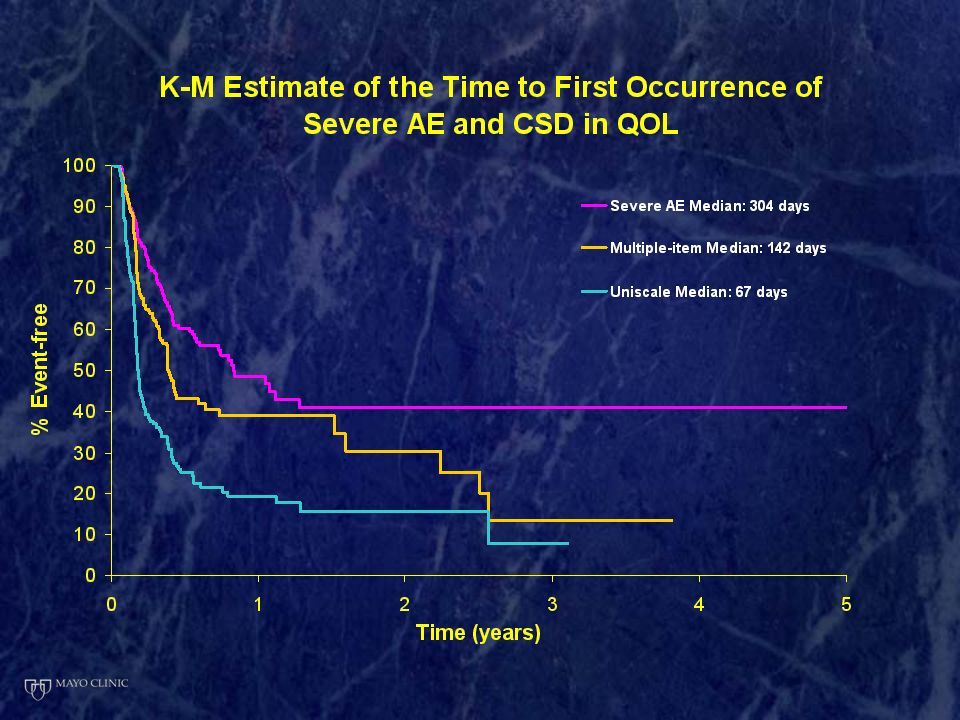
Severe AE and CSD in QOL FACT-L & Uniscale LCSS & Uniscale SDS & UniscaleTotal Uniscale Number evaluable*12215546323 Severe AE 26 (21.3%) 74 (47.7%)17 (37.0%)117 (36.2%) CSD in QOL74 (60.7%)92 (59.3%)20 (43.5%)186 (57.6%) Percent agreement46%51%46%48% Multiple-items Number evaluable*14015645341 Severe AE30 (21.4%)76 (48.7%)17 (37.8%)123 (36.1%) CSD in QOL52 (37.1%)67 (43.0%)13 (28.9%)132 (38.7%) Percent agreement64%53%60%59% *Represents the number of patients that had an adverse event (any grade) and completed a QOL assessment at baseline and at least once post-baseline
 74 (47.7%)17 (37.0%)117 (36.2%) CSD in QOL74 (60.7%)92 (59.3%)20 (43.5%)186 (57.6%) Percent agreement46%51%46%48% Multiple-items Number evaluable* Severe AE30 (21.4%)76 (48.7%)17 (37.8%)123 (36.1%) CSD in QOL52 (37.1%)67 (43.0%)13 (28.9%)132 (38.7%) Percent agreement64%53%60%59% *Represents the number of patients that had an adverse event (any grade) and completed a QOL assessment at baseline and at least once post-baseline")
43
CSD in AE and CSD in QOL AlopeciaAnorexiaConstipationDiarrhea Uniscale Number evaluable*139946973 CSD in AE 2 (1.4%) 8 (8.5%)6 (8.7%)13 (17.8%) CSD in QOL75 (54.0%)61 (64.9%)37 (53.6%)44 (60.2%) Percent agreement46%37%52%41% Multiple-items Number evaluable*145997277 CSD in AE2 (1.4%)9 (9.1%)6 (8.3%)15 (19.5%) CSD in QOL59 (40.7%)50 (50.5%)17 (23.6%)31 (40.3%) Percent agreement59%44%74%53% *Represents the number of patients that had a baseline and post-baseline adverse event (any grade) and completed a QOL assessment at baseline and at least once post-baseline
 8 (8.5%)6 (8.7%)13 (17.8%) CSD in QOL75 (54.0%)61 (64.9%)37 (53.6%)44 (60.2%) Percent agreement46%37%52%41% Multiple-items Number evaluable* CSD in AE2 (1.4%)9 (9.1%)6 (8.3%)15 (19.5%) CSD in QOL59 (40.7%)50 (50.5%)17 (23.6%)31 (40.3%) Percent agreement59%44%74%53% *Represents the number of patients that had a baseline and post-baseline adverse event (any grade) and completed a QOL assessment at baseline and at least once post-baseline")
44
CSD in AE and CSD in QOL DyspneaFatigueNausea Neuro- sensoryVomiting Uniscale Number evaluable*155226208189142 CSD in AE 43 (27.7%) 42 (18.6%)34 (16.4%)9 (4.8%)23 (16.2%) CSD in QOL90 (58.1%)139 (61.5%)118 (56.7%)116 (61.4%)72 (50.7%) Percent agreement46%42% 39%50% Multiple-items Number evaluable*159236216202150 CSD in AE43 (27.0%)45 (19.1%)33 (15.3%)11 (5.5%)23 (15.3%) CSD in QOL67 (42.1%)96 (40.1%)84 (38.9%)73 (36.1%)60 (40.0%) Percent agreement57%59%58%64%63% *Represents the number of patients that had a baseline and post-baseline adverse event (any grade) and completed a QOL assessment at baseline and at least once post-baseline
 42 (18.6%)34 (16.4%)9 (4.8%)23 (16.2%) CSD in QOL90 (58.1%)139 (61.5%)118 (56.7%)116 (61.4%)72 (50.7%) Percent agreement46%42% 39%50% Multiple-items Number evaluable* CSD in AE43 (27.0%)45 (19.1%)33 (15.3%)11 (5.5%)23 (15.3%) CSD in QOL67 (42.1%)96 (40.1%)84 (38.9%)73 (36.1%)60 (40.0%) Percent agreement57%59%58%64%63% *Represents the number of patients that had a baseline and post-baseline adverse event (any grade) and completed a QOL assessment at baseline and at least once post-baseline")
46
70% 12%

47
6 events reported via CTC6 events reported via CTC 25 CSD reported via SDS25 CSD reported via SDS 83.7% 25.3%

48
SummarySummary Uniscale demonstrates greater variability than the multiple-item indices The Uniscale is better able to detect a CSD in QOL than the multiple item assessments, and captures a CSD earlier than the multiple item assessments Correlations and percent agreement between Uniscale and multiple-item assessments were modest Uniscale demonstrates greater variability than the multiple-item indices The Uniscale is better able to detect a CSD in QOL than the multiple item assessments, and captures a CSD earlier than the multiple item assessments Correlations and percent agreement between Uniscale and multiple-item assessments were modest

49
SummarySummary There is indication that a CSD in QOL occurs earlier than CTC AE reporting Consistent with a recent finding that single-item QOL assessments detect a patient-perceived problem in peripheral neuropathy more than six weeks earlier than CTC (Morton et al, ASCO 2005) The multiple-item assessments are in better agreement with occurrence or CSD in AE compared to the Uniscale There is indication that a CSD in QOL occurs earlier than CTC AE reporting Consistent with a recent finding that single-item QOL assessments detect a patient-perceived problem in peripheral neuropathy more than six weeks earlier than CTC (Morton et al, ASCO 2005) The multiple-item assessments are in better agreement with occurrence or CSD in AE compared to the Uniscale
 The multiple-item assessments are in better agreement with occurrence or CSD in AE compared to the Uniscale There is indication that a CSD in QOL occurs earlier than CTC AE reporting Consistent with a recent finding that single-item QOL assessments detect a patient-perceived problem in peripheral neuropathy more than six weeks earlier than CTC (Morton et al, ASCO 2005) The multiple-item assessments are in better agreement with occurrence or CSD in AE compared to the Uniscale")
50
What is the evidence for the use of simple (single-item) LASA’s?
 LASA’s")
51
The literature for simple assessments is considerable Grunberg S.M. (1996). Comparison of conditional quality of life terminology and visual analogue scale measurements. Quality of Life Research; 5: 65-72. Grunberg S.M. (1996). Comparison of conditional quality of life terminology and visual analogue scale measurements. Quality of Life Research; 5: 65-72. Gudex C. (1996). Health state valuations from the general public using the Visual Analogue Scale. Quality of Life Research, 5: 521-531. Gudex C. (1996). Health state valuations from the general public using the Visual Analogue Scale. Quality of Life Research, 5: 521-531. Hyland ME. Development of a new type of global quality of life scale and comparison and preference for 12 global scales. Quality of Life Research. 5(5): 469-480. 1996. Hyland ME. Development of a new type of global quality of life scale and comparison and preference for 12 global scales. Quality of Life Research. 5(5): 469-480. 1996. Sriwatanakul, K. (1983). Studies with different types of visual analog scales for measurement of pain; Clinical Pharmacology and Therapeutics; 34(2): 234-239. Sriwatanakul, K. (1983). Studies with different types of visual analog scales for measurement of pain; Clinical Pharmacology and Therapeutics; 34(2): 234-239. Wewers ME. (1990). A Critical Review of Visual Analogue Scales in the Measurement of Clinical Phenomena. Research in Nursing & Health, 13: 227- 236. Wewers ME. (1990). A Critical Review of Visual Analogue Scales in the Measurement of Clinical Phenomena. Research in Nursing & Health, 13: 227- 236. Bretscher M. (1999). Quality of Life in Hospice Patients: A Pilot Study, Psychosomatics, 40, 309-313. Bretscher M. (1999). Quality of Life in Hospice Patients: A Pilot Study, Psychosomatics, 40, 309-313. Grunberg S.M. (1996). Comparison of conditional quality of life terminology and visual analogue scale measurements. Quality of Life Research; 5: 65-72. Grunberg S.M. (1996). Comparison of conditional quality of life terminology and visual analogue scale measurements. Quality of Life Research; 5: 65-72. Gudex C. (1996). Health state valuations from the general public using the Visual Analogue Scale. Quality of Life Research, 5: 521-531. Gudex C. (1996). Health state valuations from the general public using the Visual Analogue Scale. Quality of Life Research, 5: 521-531. Hyland ME. Development of a new type of global quality of life scale and comparison and preference for 12 global scales. Quality of Life Research. 5(5): 469-480. 1996. Hyland ME. Development of a new type of global quality of life scale and comparison and preference for 12 global scales. Quality of Life Research. 5(5): 469-480. 1996. Sriwatanakul, K. (1983). Studies with different types of visual analog scales for measurement of pain; Clinical Pharmacology and Therapeutics; 34(2): 234-239. Sriwatanakul, K. (1983). Studies with different types of visual analog scales for measurement of pain; Clinical Pharmacology and Therapeutics; 34(2): 234-239. Wewers ME. (1990). A Critical Review of Visual Analogue Scales in the Measurement of Clinical Phenomena. Research in Nursing & Health, 13: 227- 236. Wewers ME. (1990). A Critical Review of Visual Analogue Scales in the Measurement of Clinical Phenomena. Research in Nursing & Health, 13: 227- 236. Bretscher M. (1999). Quality of Life in Hospice Patients: A Pilot Study, Psychosomatics, 40, 309-313. Bretscher M. (1999). Quality of Life in Hospice Patients: A Pilot Study, Psychosomatics, 40, 309-313.
. Comparison of conditional quality of life terminology and visual analogue scale measurements. Quality of Life Research; 5: Grunberg S.M. (1996). Comparison of conditional quality of life terminology and visual analogue scale measurements. Quality of Life Research; 5: Gudex C. (1996). Health state valuations from the general public using the Visual Analogue Scale. Quality of Life Research, 5: Gudex C. (1996). Health state valuations from the general public using the Visual Analogue Scale. Quality of Life Research, 5: Hyland ME. Development of a new type of global quality of life scale and comparison and preference for 12 global scales. Quality of Life Research. 5(5): Hyland ME. Development of a new type of global quality of life scale and comparison and preference for 12 global scales. Quality of Life Research. 5(5): Sriwatanakul, K. (1983). Studies with different types of visual analog scales for measurement of pain; Clinical Pharmacology and Therapeutics; 34(2): Sriwatanakul, K. (1983). Studies with different types of visual analog scales for measurement of pain; Clinical Pharmacology and Therapeutics; 34(2): Wewers ME. (1990). A Critical Review of Visual Analogue Scales in the Measurement of Clinical Phenomena. Research in Nursing & Health, 13: Wewers ME. (1990). A Critical Review of Visual Analogue Scales in the Measurement of Clinical Phenomena. Research in Nursing & Health, 13: Bretscher M. (1999). Quality of Life in Hospice Patients: A Pilot Study, Psychosomatics, 40, Bretscher M. (1999). Quality of Life in Hospice Patients: A Pilot Study, Psychosomatics, 40, Grunberg S.M. (1996). Comparison of conditional quality of life terminology and visual analogue scale measurements. Quality of Life Research; 5: Grunberg S.M. (1996). Comparison of conditional quality of life terminology and visual analogue scale measurements. Quality of Life Research; 5: Gudex C. (1996). Health state valuations from the general public using the Visual Analogue Scale. Quality of Life Research, 5: Gudex C. (1996). Health state valuations from the general public using the Visual Analogue Scale. Quality of Life Research, 5: Hyland ME. Development of a new type of global quality of life scale and comparison and preference for 12 global scales. Quality of Life Research. 5(5): Hyland ME. Development of a new type of global quality of life scale and comparison and preference for 12 global scales. Quality of Life Research. 5(5): Sriwatanakul, K. (1983). Studies with different types of visual analog scales for measurement of pain; Clinical Pharmacology and Therapeutics; 34(2): Sriwatanakul, K. (1983). Studies with different types of visual analog scales for measurement of pain; Clinical Pharmacology and Therapeutics; 34(2): Wewers ME. (1990). A Critical Review of Visual Analogue Scales in the Measurement of Clinical Phenomena. Research in Nursing & Health, 13: Wewers ME. (1990). A Critical Review of Visual Analogue Scales in the Measurement of Clinical Phenomena. Research in Nursing & Health, 13: Bretscher M. (1999). Quality of Life in Hospice Patients: A Pilot Study, Psychosomatics, 40, Bretscher M. (1999). Quality of Life in Hospice Patients: A Pilot Study, Psychosomatics, 40,")
52
The Visual Analogue Uniscale Please mark with an ‘X’ the appropriate place within the bar to indicate your rating of this person’s quality of life during the past week. Lowest quality applies to someone completely dependent physically on others, seriously impaired mentally, unaware of surroundings, and in a hopeless position. Highest quality applies to someone physically and mentally independent, communicating well with others, able to do most of the things enjoyed, pulling own weight, with a hopeful yet realistic attitude. Please mark with an ‘X’ the appropriate place within the bar to indicate your rating of this person’s quality of life during the past week. Lowest quality applies to someone completely dependent physically on others, seriously impaired mentally, unaware of surroundings, and in a hopeless position. Highest quality applies to someone physically and mentally independent, communicating well with others, able to do most of the things enjoyed, pulling own weight, with a hopeful yet realistic attitude. Lowest Quality Highest Quality (Please mark one ‘X’ within the bar)
.")
53
Uniscale-NAS (Numeric Analog Scale)
")
54
Linear Analogue Self Assessment (LASA) General measure of global QOL dimensional constructs General measure of global QOL dimensional constructs Overall QOL Uniscale question plus domain specific questions Overall QOL Uniscale question plus domain specific questions LASA 6 questions LASA 6 questions covering domains: QOL, Mental, Social, Spiritual, Emotional, Physical covering domains: QOL, Mental, Social, Spiritual, Emotional, Physical e.g. How would you describe your overall physical well-being during the past week, including today? (0: as bad as it can be; 10: as good as it can be) LASA additional items (any understandable construct) LASA additional items (any understandable construct) e.g. How would you describe your anxiety during the past week, including today? (0: anxiety as bad as it can be; 10: no anxiety) (0: anxiety as bad as it can be; 10: no anxiety) General measure of global QOL dimensional constructs General measure of global QOL dimensional constructs Overall QOL Uniscale question plus domain specific questions Overall QOL Uniscale question plus domain specific questions LASA 6 questions LASA 6 questions covering domains: QOL, Mental, Social, Spiritual, Emotional, Physical covering domains: QOL, Mental, Social, Spiritual, Emotional, Physical e.g. How would you describe your overall physical well-being during the past week, including today? (0: as bad as it can be; 10: as good as it can be) LASA additional items (any understandable construct) LASA additional items (any understandable construct) e.g. How would you describe your anxiety during the past week, including today? (0: anxiety as bad as it can be; 10: no anxiety) (0: anxiety as bad as it can be; 10: no anxiety)
 LASA additional items (any understandable construct) LASA additional items (any understandable construct) e.g. How would you describe your anxiety during the past week, including today. (0: anxiety as bad as it can be; 10: no anxiety) (0: anxiety as bad as it can be; 10: no anxiety) General measure of global QOL dimensional constructs General measure of global QOL dimensional constructs Overall QOL Uniscale question plus domain specific questions Overall QOL Uniscale question plus domain specific questions LASA 6 questions LASA 6 questions covering domains: QOL, Mental, Social, Spiritual, Emotional, Physical covering domains: QOL, Mental, Social, Spiritual, Emotional, Physical e.g. How would you describe your overall physical well-being during the past week, including today. (0: as bad as it can be; 10: as good as it can be) LASA additional items (any understandable construct) LASA additional items (any understandable construct) e.g. How would you describe your anxiety during the past week, including today. (0: anxiety as bad as it can be; 10: no anxiety) (0: anxiety as bad as it can be; 10: no anxiety).")
55
LASA Validity Data Median split adds 3 months to median survival in advanced cancer patients (Sloan, JCO, 1998) Median split adds 3 months to median survival in advanced cancer patients (Sloan, JCO, 1998) Qualitative study: score of 5 or less indicates need for intervention (Frost, unpublished) Qualitative study: score of 5 or less indicates need for intervention (Frost, unpublished) “Stable” populations average roughly 7, with SD roughly 2 on 10-point scale (20 on 100 pointt scale) (Locke, in preparation) “Stable” populations average roughly 7, with SD roughly 2 on 10-point scale (20 on 100 pointt scale) (Locke, in preparation) Median split adds 3 months to median survival in advanced cancer patients (Sloan, JCO, 1998) Median split adds 3 months to median survival in advanced cancer patients (Sloan, JCO, 1998) Qualitative study: score of 5 or less indicates need for intervention (Frost, unpublished) Qualitative study: score of 5 or less indicates need for intervention (Frost, unpublished) “Stable” populations average roughly 7, with SD roughly 2 on 10-point scale (20 on 100 pointt scale) (Locke, in preparation) “Stable” populations average roughly 7, with SD roughly 2 on 10-point scale (20 on 100 pointt scale) (Locke, in preparation)
 Median split adds 3 months to median survival in advanced cancer patients (Sloan, JCO, 1998) Qualitative study: score of 5 or less indicates need for intervention (Frost, unpublished) Qualitative study: score of 5 or less indicates need for intervention (Frost, unpublished) Stable populations average roughly 7, with SD roughly 2 on 10-point scale (20 on 100 pointt scale) (Locke, in preparation) Stable populations average roughly 7, with SD roughly 2 on 10-point scale (20 on 100 pointt scale) (Locke, in preparation) Median split adds 3 months to median survival in advanced cancer patients (Sloan, JCO, 1998) Median split adds 3 months to median survival in advanced cancer patients (Sloan, JCO, 1998) Qualitative study: score of 5 or less indicates need for intervention (Frost, unpublished) Qualitative study: score of 5 or less indicates need for intervention (Frost, unpublished) Stable populations average roughly 7, with SD roughly 2 on 10-point scale (20 on 100 pointt scale) (Locke, in preparation) Stable populations average roughly 7, with SD roughly 2 on 10-point scale (20 on 100 pointt scale) (Locke, in preparation)")
56
LASA Norms (Various) Hospice patients 7.6 Hospice patients 7.6 Advanced cancer patients 7.2 Advanced cancer patients 7.2 Recovering surgical patients 6.6 Recovering surgical patients 6.6 Healthy volunteers 8.2 Healthy volunteers 8.2 Medical students 4.4 Medical students 4.4 Hospice patients 7.6 Hospice patients 7.6 Advanced cancer patients 7.2 Advanced cancer patients 7.2 Recovering surgical patients 6.6 Recovering surgical patients 6.6 Healthy volunteers 8.2 Healthy volunteers 8.2 Medical students 4.4 Medical students 4.4
 Hospice patients 7.6 Hospice patients 7.6 Advanced cancer patients 7.2 Advanced cancer patients 7.2 Recovering surgical patients 6.6 Recovering surgical patients 6.6 Healthy volunteers 8.2 Healthy volunteers 8.2 Medical students 4.4 Medical students 4.4 Hospice patients 7.6 Hospice patients 7.6 Advanced cancer patients 7.2 Advanced cancer patients 7.2 Recovering surgical patients 6.6 Recovering surgical patients 6.6 Healthy volunteers 8.2 Healthy volunteers 8.2 Medical students 4.4 Medical students 4.4")
57
A Structured Multidisciplinary Psychosocial Intervention Improves the Quality of Life A Structured Multidisciplinary Psychosocial Intervention Improves the Quality of Life of Patients with Advanced Stage Cancer In press, JCO T Rummans, M Clark, J Sloan, M Frost, P Atherton, M Bostwick, G Gamble, M Johnson, J Richardson Mayo Clinic, Rochester, MN

58
BackgroundBackground Some studies have suggested a psychosocial intervention has a positive effect on survival, while others have not demonstrated such an effect or suggested a negative effect on survival. (Spiegel, 1990; Goodwin NEJM 2001; Spiegel, Cancer, 2002) Some studies have suggested a psychosocial intervention has a positive effect on survival, while others have not demonstrated such an effect or suggested a negative effect on survival. (Spiegel, 1990; Goodwin NEJM 2001; Spiegel, Cancer, 2002) Most interventions are single - focus and have targeted mood (Fawzy, AGP,1993; Jacobsen JCO 2002; Kolden, Psycho-Onc. 2002) Most interventions are single - focus and have targeted mood (Fawzy, AGP,1993; Jacobsen JCO 2002; Kolden, Psycho-Onc. 2002) Some studies have suggested a psychosocial intervention has a positive effect on survival, while others have not demonstrated such an effect or suggested a negative effect on survival. (Spiegel, 1990; Goodwin NEJM 2001; Spiegel, Cancer, 2002) Some studies have suggested a psychosocial intervention has a positive effect on survival, while others have not demonstrated such an effect or suggested a negative effect on survival. (Spiegel, 1990; Goodwin NEJM 2001; Spiegel, Cancer, 2002) Most interventions are single - focus and have targeted mood (Fawzy, AGP,1993; Jacobsen JCO 2002; Kolden, Psycho-Onc. 2002) Most interventions are single - focus and have targeted mood (Fawzy, AGP,1993; Jacobsen JCO 2002; Kolden, Psycho-Onc. 2002)
 Some studies have suggested a psychosocial intervention has a positive effect on survival, while others have not demonstrated such an effect or suggested a negative effect on survival. (Spiegel, 1990; Goodwin NEJM 2001; Spiegel, Cancer, 2002) Most interventions are single - focus and have targeted mood (Fawzy, AGP,1993; Jacobsen JCO 2002; Kolden, Psycho-Onc. 2002) Most interventions are single - focus and have targeted mood (Fawzy, AGP,1993; Jacobsen JCO 2002; Kolden, Psycho-Onc. 2002) Some studies have suggested a psychosocial intervention has a positive effect on survival, while others have not demonstrated such an effect or suggested a negative effect on survival. (Spiegel, 1990; Goodwin NEJM 2001; Spiegel, Cancer, 2002) Some studies have suggested a psychosocial intervention has a positive effect on survival, while others have not demonstrated such an effect or suggested a negative effect on survival. (Spiegel, 1990; Goodwin NEJM 2001; Spiegel, Cancer, 2002) Most interventions are single - focus and have targeted mood (Fawzy, AGP,1993; Jacobsen JCO 2002; Kolden, Psycho-Onc. 2002) Most interventions are single - focus and have targeted mood (Fawzy, AGP,1993; Jacobsen JCO 2002; Kolden, Psycho-Onc. 2002).")
59
Motivation for the present study A multidisciplinary intervention had not been tried nor tested for feasibility A multidisciplinary intervention had not been tried nor tested for feasibility Overall QOL is the composite, multidimensional psychosocial target Overall QOL is the composite, multidimensional psychosocial target A multidisciplinary intervention had not been tried nor tested for feasibility A multidisciplinary intervention had not been tried nor tested for feasibility Overall QOL is the composite, multidimensional psychosocial target Overall QOL is the composite, multidimensional psychosocial target

60
Study Schema Patients with Advanced Stage Disease scheduled to undergo radiation therapy R Arm A: Structured multi- disciplinary psychosocial intervention. 8 - 90 minute sessions over 4 weeks Arm B: Standard Care QOL assessed at baseline and week 4 (EOT) Stratification: tumor type, ECOG PS, age
 Stratification: tumor type, ECOG PS, age.")
61
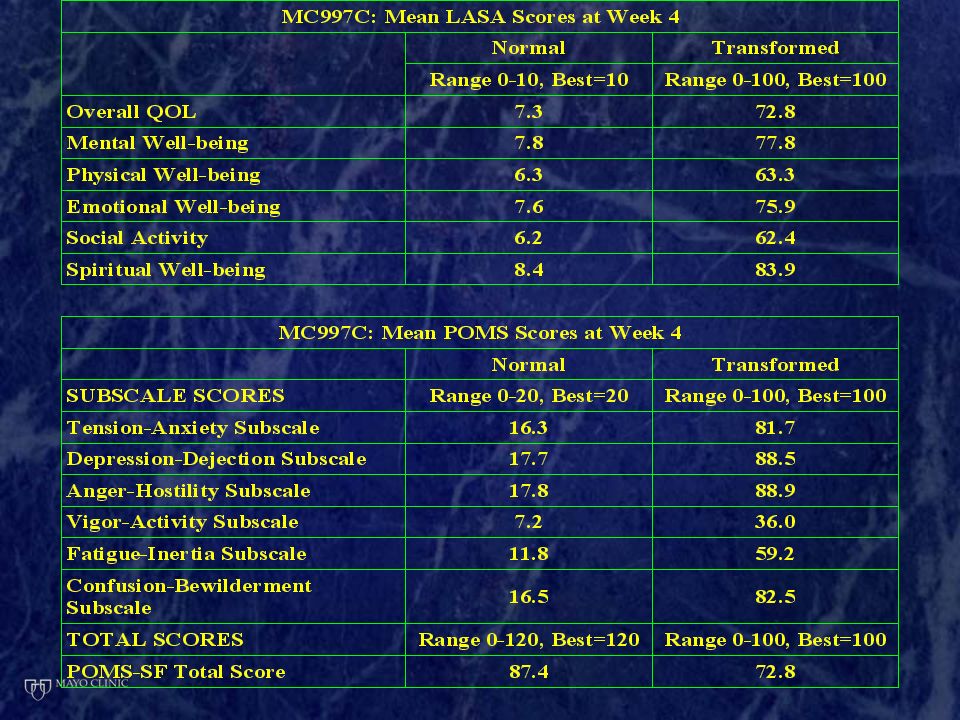
Linear Analogue Self Assessment (LASA) items Profile of Mood States – Short Form (POMS) Symptom Distress Scale (SDS) FACIT – Spiritual Well-Being Secondary endpoint assessment tools
 items Profile of Mood States – Short Form (POMS) Symptom Distress Scale (SDS) FACIT – Spiritual Well-Being Secondary endpoint assessment tools")
62
Which is the “real” symptom endpoint?

63
At week 4, overall QOL was 10 points higher in the intervention arm than in the standard care arm (80 versus 70 on the 100-point scale respectively, p=0.047). The treatment group improved 3.3 points from baseline, while the control group decreased 8.9 points on average, p=0.009. More than three times as many patients in the treatment group reported a 10-point improvement in QOL from baseline compared to the control group (30% versus 9%, p=0.004). Primary Result: Overall QOL at 4 weeks
. Primary Result: Overall QOL at 4 weeks.")
65
best worst

Similar presentations


 vs FOLFIRI plus bev>")

 Amylou C. Dueck (Mayo Clinic)>")


 versus FOLFOX4 in Patients with Advanced Colorectal Carcinoma Previously Treated.>")


 Treated with Anti Vascular Endothelial Growth Factor (VEGF)>")


: investigational agents TTP = median time to disease progression OS = median overall survival.>")

