Download presentation
Presentation is loading. Please wait.

1
Efficient Markets and Behavioral Critique 1

2
Market in which securities prices reflect all available information ◦ all securities are fairly priced ◦ Investors get exactly what they pay for ◦ Firms get exactly what their stocks and bonds are worth when they sell them.

3
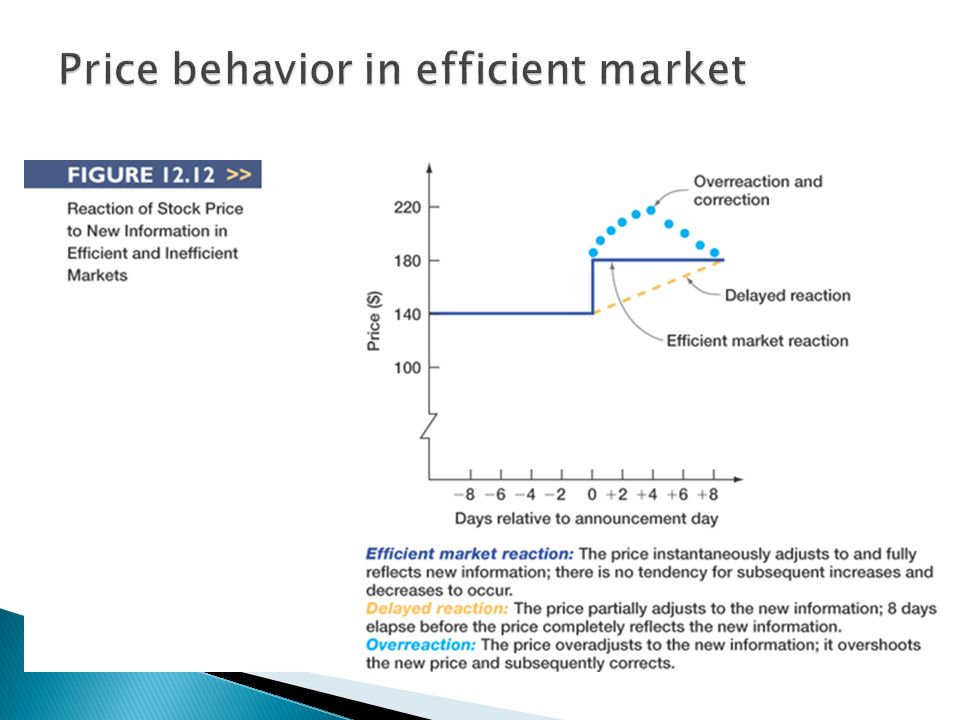
FCC Corporation is developing a camera that will double the speed of the auto-focusing system. It is highly profitable and the NPV will be positive. Day 0 represents the announcement day. Before the announcement day, FCC’s stock sells for $140 per share. The NPV per share is $40, so the new price will be $180 once the value of the new project is fully reflected. Hence, the solid line represents the path of stock price in an efficient market. The price will adjust immediately and no further change in the price of stock will take place later. The broken line represents a delayed reaction. It takes 8 day for the market to fully incorporate the information. The dotted line indicates an overreaction and subsequent adjustment to the correct price Broken and dotted line show the path of the stock price if markets are inefficient.

5
Figure 11.1 Cumulative Abnormal Returns Before Takeover Attempts: Target Companies

6
Figure 11.2 Stock Price Reaction to CNBC Reports

7
majority of the profit is in the first 30 minutes

8
Stock prices fully and accurately reflect publicly available information Once information becomes available, market participants analyze it Competition assures prices reflect information EMH and Competition

9
Weak-form EMH: prices reflect all past info Semistrong-form EMH: prices reflect all public (past¤t) info Strong-form EMH: prices reflect all (past¤t, public&private) info Weak Form Semi-strong Form Strong Form
 info Strong-form EMH: prices reflect all (past¤t, public&private) info Weak Form Semi-strong Form Strong Form")
10
Weak-form: ◦ price reflect all past info. ◦ using historical data to predict future prices is useless Semi-strong form ◦ price reflect all public info (current and past) ◦ using historical data and available financial statement to predict future price is useless Strong form ◦ price reflect all information: past, public and private ◦ cannot predict price even with inside information
 ◦ using historical data and available financial statement to predict future price is useless Strong form ◦ price reflect all information: past, public and private ◦ cannot predict price even with inside information.")
11
Technical Analysis - using prices and volume information to predict future prices ◦ Weak form efficiency & technical analysis Fundamental Analysis - using economic and accounting information to predict stock prices ◦ Semi strong form efficiency & fundamental analysis Types of Stock Analysis

12
Price change randomly or follow a random walk. Why? EMH: price is in equilibrium or reflect the true value ◦ Price < true value: more investors to buy, push the price up to the true level ◦ Price > true value: more sell, drive the price down to the true level ◦ Price will stay at the true level if there is no new info New info, price will change accordingly New information is unpredictable stock price change is unpredictable

13
using past info to search for patterns in stock prices to identify mispriced stocks EMH implies that technical analysis is useless because all past info is incorporated in current stock price. If one knows about the pattern, other people will also know Example: you believe that you discover a pattern in stock price, the price should be $50 instead of current price is 45. ◦ you want to buy stock at 45 and sell it tomorrow for 50. Is it possible? ◦ If you know, sellers also know about it, the price will be pushed up to 50 before you can buy the stock

14
Technical: look back at the past to forecast future price Fundamental: look ahead to forecast future info and then forecast true price. To forecast stock price, we need future cash flow and discount rate ◦ Use available financial statement to forecast earnings and dividends perspectives of the firms ◦ Calculate risk of firm, using CAPM to get the discount rate ◦ calculate the true value and compare with current price current price > true Current price < true EMH suggest that fundamental adds little value ◦ public info is available to everyone ◦ not much difference in analysts’ reports ◦ price reflect true value ◦ must be better than other analysts to make abnormal profit

15
Active: attempt to find mispriced securities Passive: no attempt, just buy and hold a well-diversified portfolio EMH: active is wasted effort ◦ securities are fairly priced ◦ lose transaction cost Example: create a portfolio that follows the index S&P 500

16
Technical Analysis: useless Fundamental Analysis: adds little value Active versus Passive Portfolio Management: passive wins EMHYou can’t “Beat the Market”

17
Efficient markets do not mean that you can’t make money They do mean that, on average, you will earn a return that is appropriate for the risk undertaken and there is not a bias in prices that can be exploited to earn excess returns Market efficiency will not protect you from wrong choices if you do not diversify – you still don’t want to put all your eggs in one basket

18
Need for a well-diversified portfolio: Tax considerations ◦ high tax-bracket: prefer municipal bond ◦ high tax-bracket: prefer securities that provide capital gains as opposed to interest income since gains are tax less heavily Individual considerations ◦ GM executives, performance depends on GM stocks, should not invest too much in auto stocks Age considerations ◦ older investors might avoid long-term bond ◦ younger might choose long-term bond

19
Hard question! The Magnitude Issue The Selection Bias Issue The Lucky Event Issue

20
You manage a portfolio $1 billion. If the return is 0.1%/year, should make 1 mil/year. ◦ A very small deviation from the true price can result in large profit ◦ Standard deviation of S&P 500/ year = 20% ◦ When a manager makes a lot of money on a large portfolio, does it mean the market is not efficient?

21
When you discover a technique to beat the market, should you ◦ publish it to get reputation ◦ keep it as secrets to make money Technique available in the market is the one that cannot make abnormal profit EMH only looks at those techniques available in market, and conclude that these cannot beat the market, it is not necessarily true.

22
Read WSJ, some investors outperform others, is this evidence against EMH? Flip a fair coin, 50% head, 50% tail, 50 times, on average, will get 25 times H, 25 times T. If someone can get more than 25 times H, does it mean he is better than you?

23
short-horizon (<1 year): rank stocks based on past performance ◦ Winner ◦ Loser ◦ Next 3-12 months, winners continue to outperform losers ◦ Momentum strategy Long horizon ◦ reversal effect, loser outperform winner ◦ Contrarian strategies Fad hypothesis ◦ short term: market overreact to news, sell more losers, price(losers) true level. Therefore, winner continue to outperform loser ◦ Long term: market makes correction, price of loser goes back up to the true level, winner goes back down to the true level, loser outperform winner

24
Test of EMH: weak form-pattern in stock return, Predictors of Broad Market Returns Fama and French ◦ Aggregate returns are higher with higher dividend ratios Campbell and Shiller ◦ Earnings yield can predict market returns Keim and Stambaugh ◦ Bond spreads can predict market returns

25
Anomalies: evidence that contradicts EMH P/E Effect: low P/E, High returns, Small-firm-in-January effect: Small firm, High return, in January, Neglected-Firm Effect: Less known firms have higher return, Book-to-Market effect: high B/M, high returns Post-earnings effect: sluggish response of price to earnings announcements

26
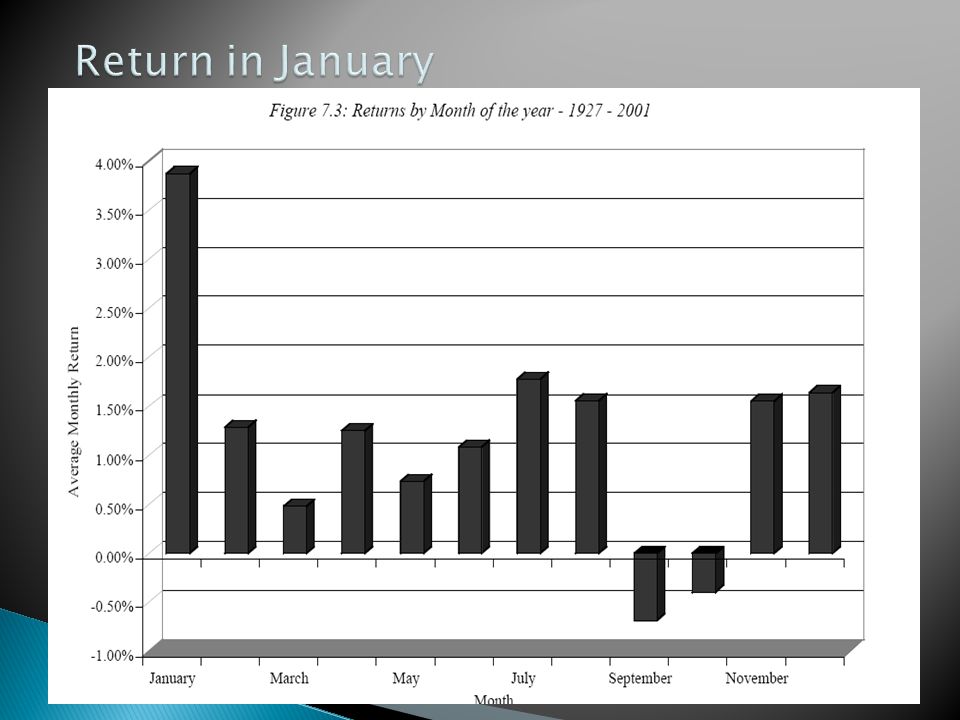
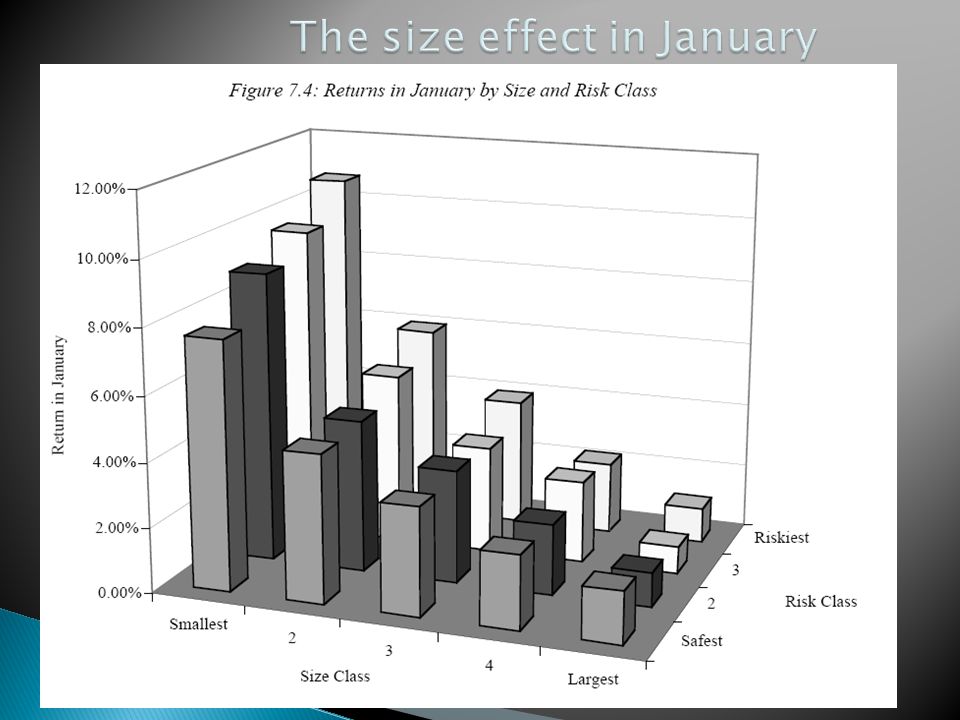
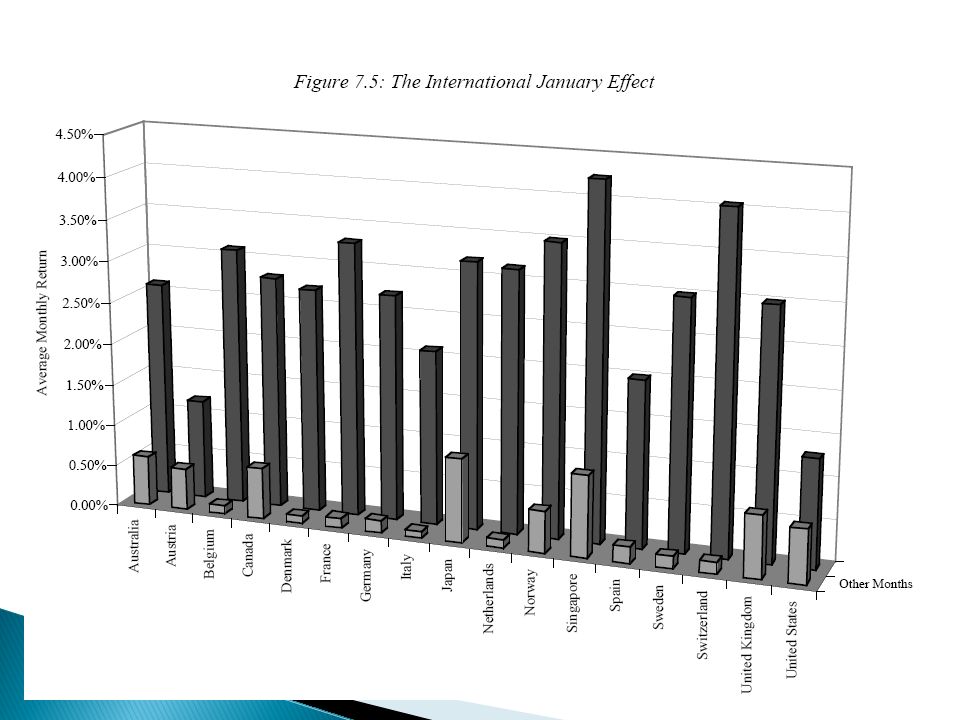
Studies of returns in the US and other major financial markets reveal strong difference in return behaviors across months of the year Returns in January is much stronger than returns in any other month of the year. This is called January effect and most of the January effect can be traced to the first 2 weeks of January The January effect is much more accentuated for small firms than for large firms

30
Tax-loss selling by investors: at the end of the year when investors, starting to worry about taxes, sell some stocks that are down so the losses can be written off against capital gains. This selling causes stocks to go down near the end of the year and back up in January when investors buy back the stocks they sold.

31
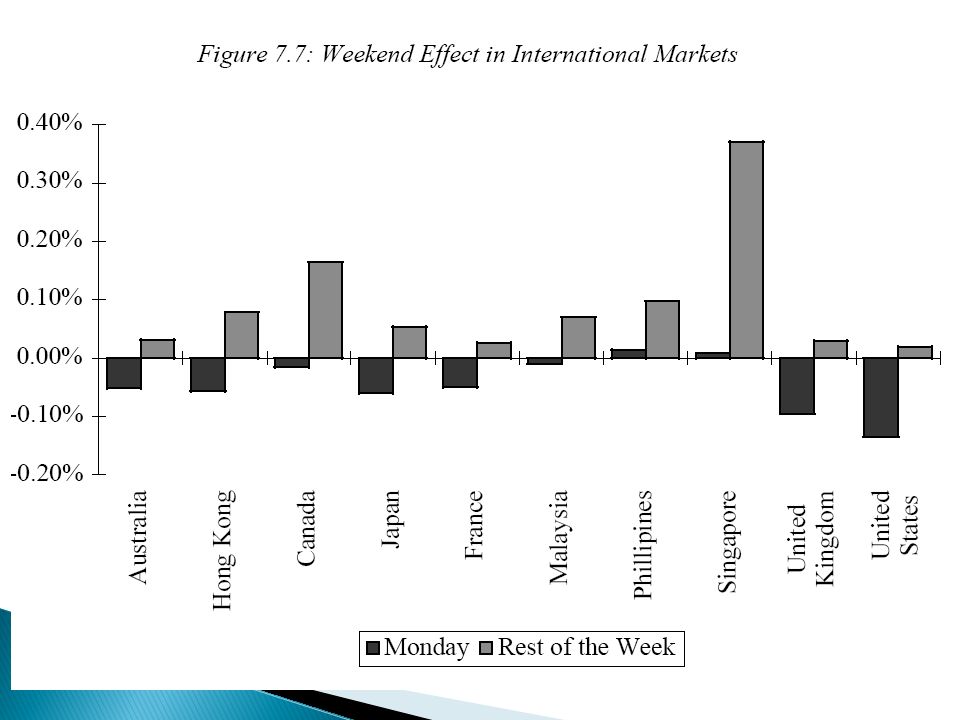
The weekend effect is another phenomenon that has persisted over time in the US as well as in international markets. It refers to the differences in Monday return and the return of other days in the week Over the year, the return on Monday has been consistently lower than the return of other days in the week

34
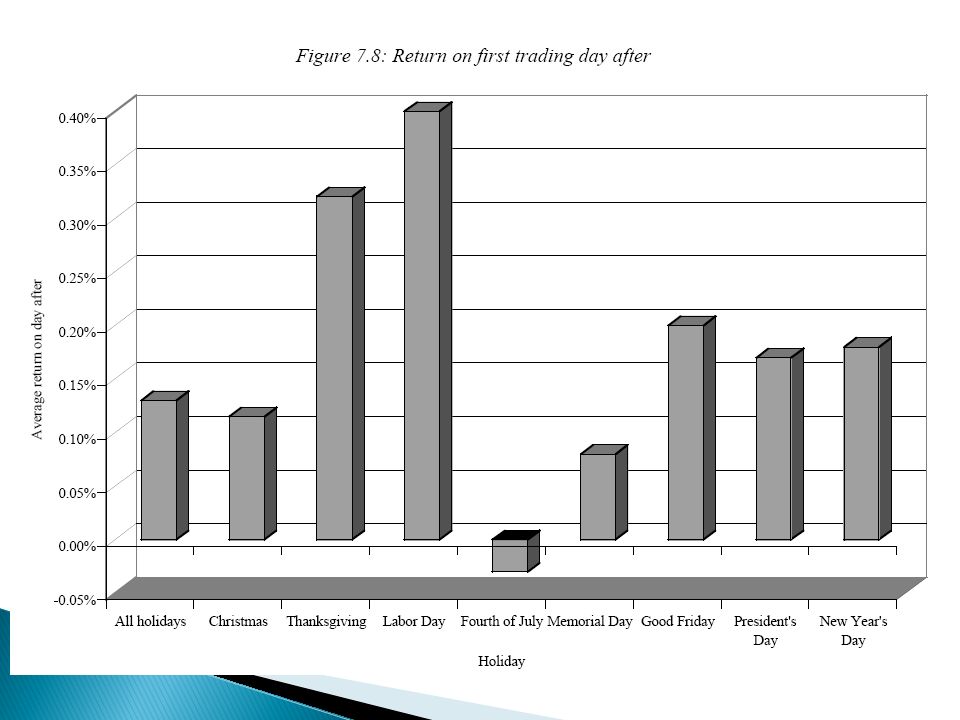
the weekend effect might be the results of bad news being revealed after Friday close and during the weekend. Others state that the weekend effect might be linked to short selling, which would affect stocks with high short interest positions. Or, the effect could simply be a result of traders' fading optimism between Friday and Monday. May be attributed to absence of trading over the weekend. However, this should not be the reason if we consider the return after the holidays. Usually, the returns after holidays are positive not negative

36
Figure 11.3 Average Annual Return for 10 Size-Based Portfolios, 1926 – 2006

37
Figure 11.4 Average Return as a Function of Book-To-Market Ratio, 1926–2006

38
Form stocks into 10 portfolios based on magnitude of earning surprise (difference between historical analysts’ forecast and actual announcement) Portfolio 1 being the lowest, 10 being the highest. Positive surprise firms continue to have positive abnormal return. Negative surprise firms continue to have negative abnormal return higher surprise has higher abnormal return No explanation so far.

39
Figure 11.5 Cumulative Abnormal Returns in Response to Earnings Announcements

40
Most tests require risk adjustments Risk adjustment require a model of risk (typically uses CAPM) Tests of risk-adjusted returns are joint tests of the EMH and the risk adjustment procedure Rejecting risk-adjustment procedure leaves no conclusions about EMH EMH is essentially untestable.
 Tests of risk-adjusted returns are joint tests of the EMH and the risk adjustment procedure Rejecting risk-adjustment procedure leaves no conclusions about EMH EMH is essentially untestable.")
41
With private info, can we beat the market? The ability of insiders to trade profitability in their own stock has been documented in studies by Jaffe, Seyhun, Givoly, and Palmon SEC regulations ◦ insider register all trading activities ◦ publish all these trades ◦ insider must report large trades to SEC within 2 days

42
Anomalies: momentum, contrarian, size, book-to-market, P/E ratio, post announcement drift, etc. ◦ Evidence against EMH ◦ market is efficient but sources of risk are not fully identified On going debate

43
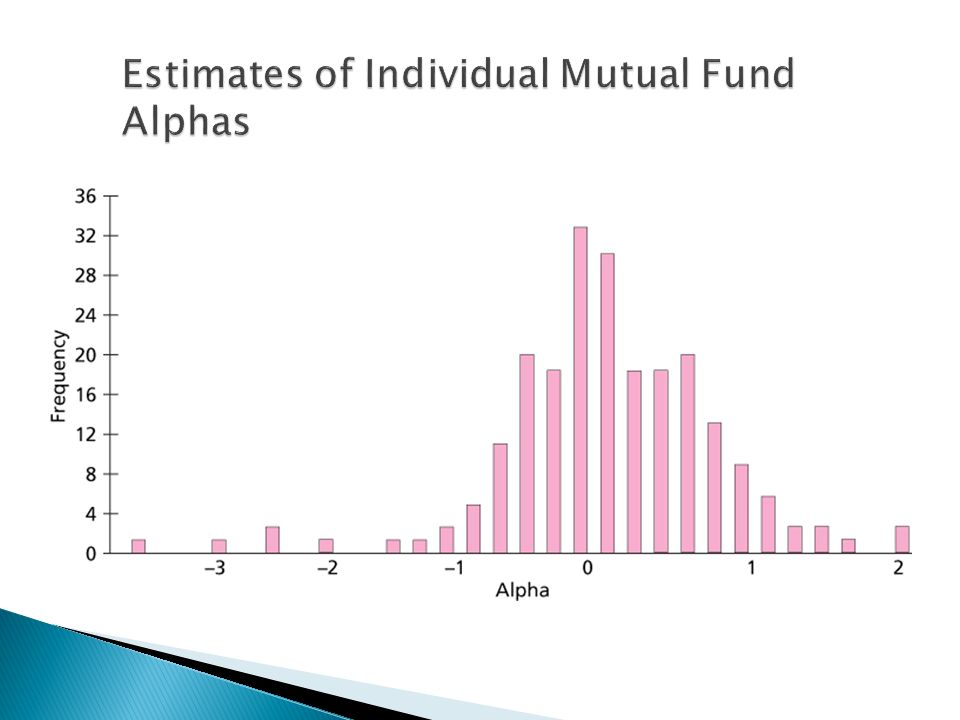
Mutual fund performance Skilled equity investment professionals do not consistently beat the market.

45
Figure 11.8 Persistence of Mutual Fund Performance

46
Example: 2 finance professtionals walk on street, one see $20 bill, and is going to pick it up, the other says: don’t bother, if it was real money, someone else would have picked it up already. The same idea applies to the market Market is very competitive, generally efficient. However the evidence of anomalies suggest that there might be reward for hard-working, intelligent, creative investors.

47
Research shows stock prices tend to follow a random walk Three forms of the efficient market hypothesis Technical analysis Fundamental analysis Empirical studies have generally shown that technical analysis does not generate trading profits Several anomalies exist regarding fundamental analysis Professionally managed funds generally cannot consistently beat the market

Similar presentations