Download presentation
Presentation is loading. Please wait.

1
THE EFFECTIVE USE OF CAPITAL Chapter 9 Bank Management 6th edition. Timothy W. Koch and S. Scott MacDonald Bank Management, 6th edition. Timothy W. Koch and S. Scott MacDonald Copyright © 2005by South-Western, a division of Thomson Learning

2
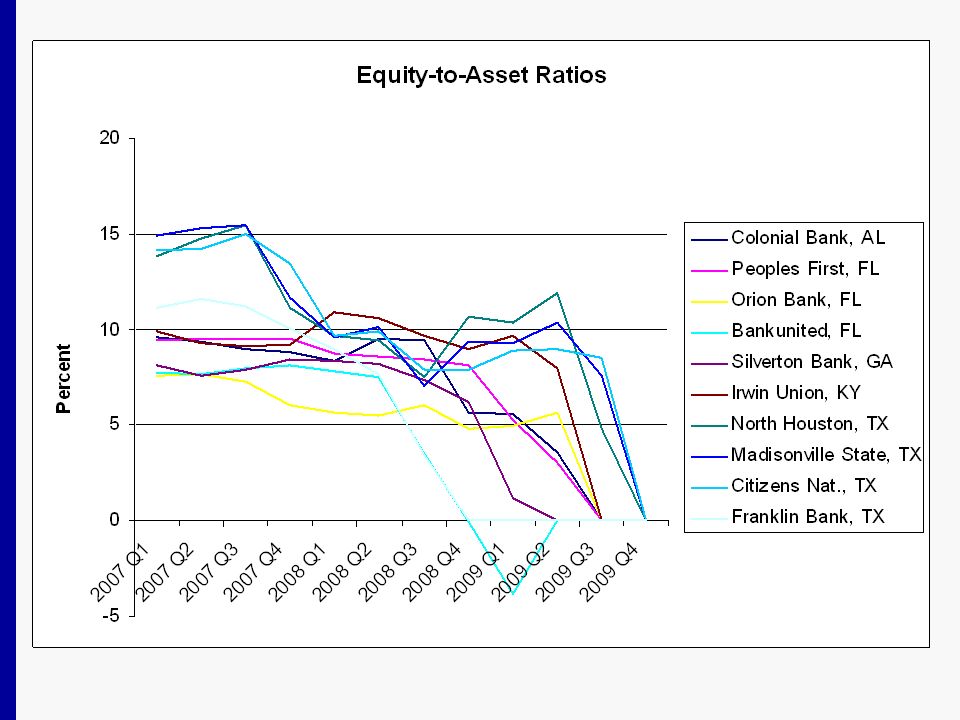
Why worry about bank capital? …capital reduces the risk of failure by acting as a cushion against losses and by providing access to financial markets to meet liquidity needs. While bank capital-to-asset ratios averaged near 20% at the turn of the century, comparable ratios today are closer to 8 percent. Historical Trends in Bank Capital -1.00% 1.00% 3.00% 5.00% 7.00% 9.00% 11.00% 13.00% 15.00% 19351938194119441947195019531956195919621965196819711974197719801983198619891992199519982001 Year Total Capital to Total Assets Growth Rate in Total Capital

4
Risk-based capital standards During the last half of the 1980s, for example, all U.S. banks were required to meet a 5.5% minimum primary capital requirement and a 6 percent minimum total capital requirement. Primary capital consisted of stockholders equity, perpetual preferred stock, mandatory convertible debt, and loan loss reserves.

5
The Basle agreement In 1986, U.S. bank regulators proposed that U.S. banks be required to maintain capital that reflects the riskiness of bank assets. By 1988, the proposal had grown to include risk-based capital standards for banks in 12 industrialized nations according to the terms of the Basle Agreement. Regulations were fully in place by the end of 1992.

6
Terms of the Basle Agreement varied, primarily in terms of what constitutes capital, but there are common elements. Minimum capital requirement is linked to its credit risk as determined by the composition of assets. Stockholders' equity is deemed to be the most critical type of capital. Minimum capital requirement increased to 8% for total capital. Capital requirements were approximately standardized between countries to 'Level the playing field.'

7
Risk-based elements of the plan To determine minimum capital requirements, bank managers follow a four-step process: 1. Classify assets into one of four risk categories; 2. Classify off-balance sheet commitments and guarantees into the appropriate risk categories; 3. Multiply the dollar amount of assets in each risk category by the appropriate risk weight; this equals risk-weighted assets; and 4. Multiply risk-weighted assets by the minimum capital percentages, currently either 4 percent or 8 percent.

8
Regional National Bank (RNB), risk-based capital
, risk-based capital")
9
Regional National Bank (RNB) Risk-based capital
 Risk-based capital")
10
Regional National Bank (RNB) Risk-based capital (continued)
 Risk-based capital (continued)")
11
General descriptions of the four risk categories

12
What constitutes bank capital? …according to accounting definition, capital or net worth equals the cumulative value of assets minus the cumulative value of liabilities, and represents ownership interest in a firm. Total equity capital equals the sum of: common stock, surplus, undivided profits and capital reserves, and net unrealized holding gains (losses) on available-for-sale securities and cumulative foreign currency translation adjustments, and perpetual preferred stock
 on available-for-sale securities and cumulative foreign currency translation adjustments, and perpetual preferred stock.")
13
Risk-based capital standards …two measures of qualifying bank capital 1. Tier 1 or core capital consists of (4% required): common equity, qualifying perpetual preferred stock, and minority interest in consolidated subsidiaries, less intangible assets such as goodwill. 2. Tier 2 capital or supplementary capital (4% req.): allowance for loan loss reserves up to 1.25 percent of risk-weighted assets, preferred stock, and mandatory convertible debt.
: common equity, qualifying perpetual preferred stock, and minority interest in consolidated subsidiaries, less intangible assets such as goodwill. 2. Tier 2 capital or supplementary capital (4% req.): allowance for loan loss reserves up to 1.25 percent of risk-weighted assets, preferred stock, and mandatory convertible debt..")
14
Leverage capital ratios Regulators are also concerned that a bank could acquire so many low-risk assets that risk-based capital requirements would be negligible hence, regulators have also imposed a 3 percent leverage capital ratio, defined as: Tier 1 capital divided by total assets net of goodwill and disallowed intangible assets and deferred tax assets. This capital requirement was implemented to prevent banks from operating with little or no capital, even though risk-based standards might allow it.

15
Risk-based capital ratios for different-sized U.S. Commercial banks

16
FDICIA and bank capital standards Effective December 1991, Congress passed the Federal Deposit Insurance Improvement Act (FDICIA) with the intent of revising bank capital requirements to: emphasize the importance of capital and authorize early regulatory intervention in problem institutions, and authorized regulators to measure interest rate risk at banks and require additional capital when it is deemed excessive. A focal point of the Act was the system of prompt corrective action, which divides banks into categories or zones according to their capital positions and mandates action when capital minimums are not met.

17
Five capital categories of FDICIA. Not subject to regulatory directives regarding capital: 1. well-capitalized and 2. adequately capitalized banks Subject to regulatory restrictions: 3. Undercapitalized, 4. significantly undercapitalized and 5. critically undercapitalized

18
Capital categories under FDICA

19
Prompt regulatory action under FDICIA

20
Tier 3 capital requirements for market risk …many large banks have dramatically increased the size and activity of their trading accounts, resulting in greater exposure to market risk. Market risk is the risk of loss to the bank from fluctuations in interest rates, equity prices, foreign exchange rates, commodity prices, and exposure to specific risk associated with debt and equity positions in the bank’s trading portfolio. Market risk exposure is, therefore, a function of the volatility of these rates and prices and the corresponding sensitivity of the bank’s trading assets and liabilities.

21
Tier 3 capital requirements for market risk … risk-based capital requires banks with significant market risk to measure their market risk exposure and hold sufficient capital to mitigate this exposure. A bank is subject to market risk capital guidelines …if consolidated trading activity (the sum of trading assets and liabilities for the previous quarter) equals 10 percent or more of the bank’s total assets for the previous quarter, or $1 billion or more in total dollar value. Banks subject to market risk capital guidelines must maintain an overall minimum 8 percent ratio of total qualifying capital to risk-weighted assets and market risk equivalent assets. Tier 3 capital allocated for market risk plus Tier 2 capital allocated for market risk are limited to 71.4 percent of a bank’s measure for market risk.
 equals 10 percent or more of the bank’s total assets for the previous quarter, or $1 billion or more in total dollar value. Banks subject to market risk capital guidelines must maintain an overall minimum 8 percent ratio of total qualifying capital to risk-weighted assets and market risk equivalent assets. Tier 3 capital allocated for market risk plus Tier 2 capital allocated for market risk are limited to 71.4 percent of a bank’s measure for market risk..")
22
Value-at-risk Market risk exposure is a function of the volatility of rates and prices and the corresponding sensitivity of the bank's trading assets and liabilities. The largest banks use a value-at-risk (VAR) based capital charge, estimated by using an internally generated risk measurement model.
 based capital charge, estimated by using an internally generated risk measurement model..")
23
The original Basel Accord’s approach to capital requirements was primarily based on credit risk. Although it set appropriate protections from a market- and credit-risk perspective, it did not address operational or other types of risk. Operational risk itself is not new to financial institutions. It’s the first risk a bank must manage, even before making its first loan or executing its first trade. By 2005, a bank’s regulatory capital needs could increase significantly—up to 20 percent of total risk-based capital—as a result of its exposure to operational risk.

24
The new BASEL capital accord (BASEL II) and operational risk September 11, 2001 tragically demonstrated the need for banks to protect themselves against operational risk to their systems and people. Starting in 2005, regulators will calculate capital according to the recently adopted Basel II Accord. The new focus of Basel II is operational risk. The focus is on the optimum use of capital in the technology and business process operations areas. The Basel Committee defines operational risk as “the risk of loss resulting from inadequate or failed internal processes, people, and systems, or from external events.”

25
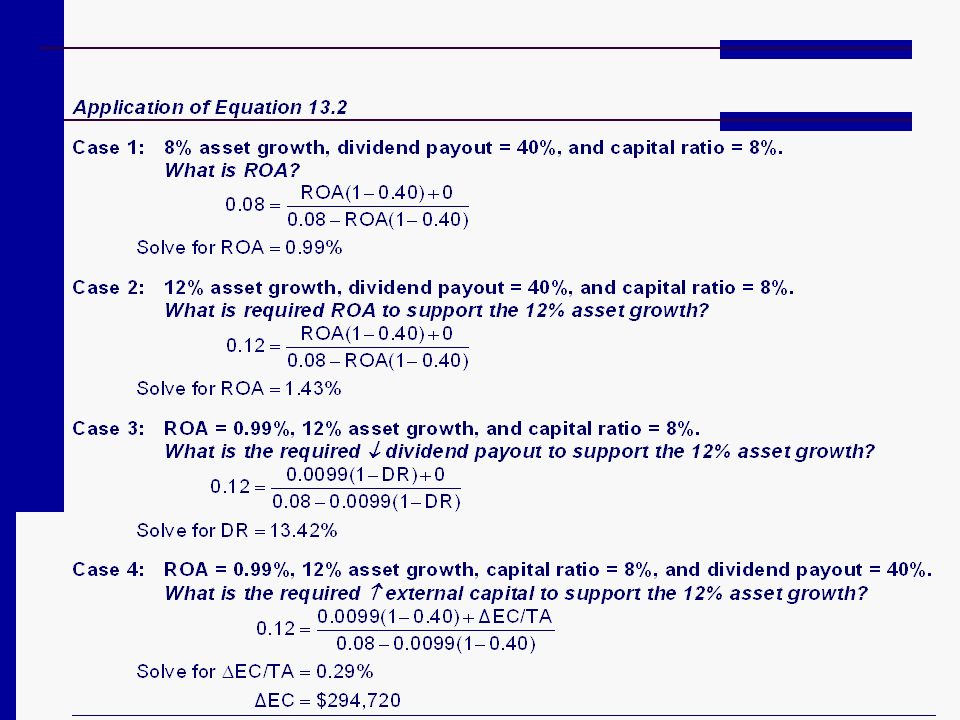
Functions of bank capital Provides a cushion for firms to absorb losses and remain solvent. Provides ready access to financial markets, guards against liquidity problems. Constrains growth and limits risk-taking : TA / TA = EQ / EQ

26
Example: TA / TA = EQ / EQ Assume ROA=1.1%, 7% equity, DR=40%:

27
Weakness of risk-based capital standards Current standards only account for credit and market risk at large banks with extensive trading operations. The new Basel II also accounts for operational risk. Book value of capital is not the most meaningful measure of soundness. Ignores changes in market values, unrealized gains or losses on held-to-maturity investments, bank charter value, and FDIC insurance. Trading account securities must be marked-to-market and unrealized gains and losses reported on the income statement, but other bank assets and liabilities are generally listed at book value Loan Loss Allowance, is anticipated default losses but does not generally take into account the change in value of the loans from changes in interest rates.

29
The effect of capital requirements on bank operating policies: limiting growth

30
External capital sources Banks that choose to expand more rapidly must obtain additional capital from external sources, a capability determined by asset size. Large banks tap the capital markets regularly, but small banks must pay a premium to obtain capital, if it is available at all. Capital sources can be grouped into one of four categories: 1. subordinated debt, 2. common stock, 3. preferred stock, or trust preferred stock and 4. leases. Each carries advantages and disadvantages.

31
Subordinated debt Does not qualify as Tier 1 or core capital Imposes an interest expense burden on the bank when earnings are low. Subordinated debt offers several advantages to banks. interest payments are tax-deductible, generates additional profits for shareholders as long as earnings before interest and taxes exceed interest payments. Subordinated debt also has shortcomings. interest and principal payments are mandatory, default if not paid many issues require sinking funds

32
Common stock Common stock is preferred by regulators as a source of external capital. It has no fixed maturity and thus represents a permanent source of funds. Dividend payments are discretionary, Losses can be charged against equity, not debt, so common stock better protects the FDIC. Common stock is not as attractive from the bank's perspective due to its high cost because: dividends are not tax-deductible, transactions costs on new issues exceed costs on debt, and shareholders are sensitive to earnings dilution and possible loss of control in ownership.

33
Preferred stock Preferred stock is a form of equity in which investors' claims are senior to those of common stockholders. As with common stock, preferred stock pays nondeductible dividends One significant difference is that corporate investors in preferred stock pay taxes on only 20 percent of dividends. For this reason, institutional investors dominate the market. Most issues take the form of adjustable-rate perpetual stock.

34
Trust preferred stock Trust preferred stock is a hybrid form of equity capital at banks. It is attractive because it effectively pays dividends that are tax deductible. To issue the security, a bank establishes a trust company. The trust company sells preferred stock to investors and loans the proceeds of the issue to the bank. Interest on the loan equals dividends paid on preferred stock. The loan is tax deductible such that the bank deducts dividend payments. As a bonus, the preferred stock counts as Tier 1 capital!!

35
Capital planning Capital planning is part of the overall asset and liability management process. Bank management makes decisions regarding the amount of risk assumed in operations and potential returns. The amount and type of capital required is determined simultaneously with the expected composition of assets and liabilities and forecasts of income and expenses. The greater assumed risk and asset growth, the greater is required capital.

36
Capital planning: forecast performance measures for a bank with deficient capital ratios

37
Federal deposit insurance The Banking Act of 1933 established the FDIC and authorized federal insurance for bank deposits up to $2,500. Today coverage stands at $100,000 per account. The initial objectives of deposit insurance were to prevent liquidity crises caused by large-scale deposit withdrawals and bank failure. The large number of failures in the late 1980s and early 1990s put pressure on the FDIC by slowly depleting the reserve fund.

38
By the late 1990’s, the FDIC was well funded The Financial Institution Reform, Recovery, and Enforcement Act of 1989 (FIRREA) authorized the issuance of bonds to finance the bailout of the FSLIC and provide resources to close problem thrifts. The Deposit Insurance Funds Act of 1996 (DIFA) was enacted on September 30, 1996 1. Included both a one-time assessment on SAIF deposits to capitalize the SAIF fund 2. Required the repayment of the Financing Corporation (FICO) bonds 3. Mandated the ultimate elimination of the BIF and SAIF funds by merging them into a new Deposit Insurance Fund
 was enacted on September 30, Included both a one-time assessment on SAIF deposits to capitalize the SAIF fund 2. Required the repayment of the Financing Corporation (FICO) bonds 3. Mandated the ultimate elimination of the BIF and SAIF funds by merging them into a new Deposit Insurance Fund.")
39
Risk-based deposit insurance FDIC insurance premiums are assessed based on a Risk-Based Deposit Insurance system required by the FDIC Improvement Act of 1991 and adopted in September 1992. These premiums are reviewed semiannually by the FDIC to ensure that: premiums appropriately reflect the risks posed to the insurance funds and that fund reserve ratios are maintained at or above the target Designated Reserve Ratio (DRR) of 1.25 percent of insured deposits Deposit insurance premiums are assessed as basis points per one hundred dollars of insured deposits.
 of 1.25 percent of insured deposits Deposit insurance premiums are assessed as basis points per one hundred dollars of insured deposits..")
40
FDIC reserve ratios, fund balance, and insured deposits Insurance Fund Balance as a Percent of Total Insured Deposits -0.50% -0.25% 0.00% 0.25% 0.50% 0.75% 1.00% 1.25% 1.50% 1.75% 19911992199319941995199619971998199920002001 Year BIF SAIF Target Ratio

41
At the beginning of 2002, over 93% of banks are listed in the lowest category and pay no FDIC insurance premiums.

42
Problems with deposit insurance Government backed deposit insurance provides for stability of the financial system by reducing or preventing banking panics and protecting the less sophisticated depositor — but this comes at a price.

43
Problems with deposit insurance …First, deposit insurance acts similarly to bank capital and is a substitute for some functions of bank capital. Investors or depositors look to the company’s capital as a safety net in the event of failure. Lower capital levels mean firms must pay a risk premium to attract funds or they will find it difficult to borrow money. A large portion of funds come from insured depositors who do not depend on the bank’s capital position A large number of depositors, therefore, do not require a risk premium to be paid by the bank. Normal market discipline which requires the bank to pay a risk premium does not apply to all providers of funds. Some large banks are considered to be “too-big-to-fail”. Creditors of a large bank would receive de facto 100% insurance regardless of the size or type of liability.

44
Problems with deposit insurance …Second, deposit insurance has historically ignored the riskiness of bank operations, which represents the critical factor that leads to failure. Two banks with equal amounts of domestic deposits paid the same insurance premium, even though one invested heavily in risky loans and the other owned only U.S. government securities and just 50 percent of its deposits were fully insured. This creates a moral hazard problem whereby bank managers had an incentive to increase risk. For example, suppose that a bank had a large portfolio of problem assets that was generating little revenue. Managers could use deposit insurance to access funds via brokered CDs in $100,000 blocks.

45
Problems with deposit insurance … Third, deposit insurance funds were always viewed as providing basic insurance coverage. Historically, there were three fundamental problems with deposit insurance pricing. Premiums were not sufficient to cover potential payouts. The FDIC and FSLIC were expected to establish reserves of 5 percent of covered deposits funded by premiums. Reserves never exceeded 2% of insured deposits as Congress kept increasing coverage while premiums were constant. Deposit insurance coverage slowly increased from $15,000 per account per institution in 1966 to $20,000 in 1969, $40,000 in 1974, and $100,000 in 1980. Customers could obtain multiple account coverage at a single institution by carefully structuring ownership of each account. High failure rates during the 1980s and the insurance funds demonstrate that premiums were inadequate.

46
Problems with deposit insurance … The final historical problem with deposit insurance is that premiums were not assessed against all of a bank’s insured liabilities. Many liabilities that the federal government effectively guaranteed should have required insurance premiums. For example, insured deposits consisted only of domestic deposits while foreign deposits were exempt. The argument was that U.S. banks would be less competitive with foreign bank competitors. Too-big-to-fail doctrine means that large banks would have coverage on 100% of their deposits but pay as if they only had $100,000 coverage as smaller banks do. Regulators were much more willing to fail smaller banks and force uninsured depositors and other creditors to take losses.

47
Overview of Credit Policy and Loan Characteristics Chapter 10 Bank Management 6th edition. Timothy W. Koch and S. Scott MacDonald Bank Management, 6th edition. Timothy W. Koch and S. Scott MacDonald Copyright © 2006 by South-Western, a division of Thomson Learning

48
Recent Trends in Loan Growth Quality Larger banks have, on average, recently reduced their dependence on loans relative to smaller banks. Real estate loans represent the largest single loan category for banks. Residential 1-4 family homes contribute the largest amount of real estate loans for banks. Commercial real estate is highest for banks with $100 million to $1 billion in assets

49
Recent Trends in Loan Growth Quality Commercial and industrial loans represent the second highest concentration of loans at banks Loans to individuals are greatest for banks with more than $1 billion in assets Farmland and farm loans make up a significant portion of the smallest banks’ loans

50
Commercial Bank Loans as a Percentage of Total Assets, December 2004

51
Recent Trends in Loan Growth Quality Wholesale Bank Emphasizes lending to businesses Retail Bank Emphasizes lending to individuals Primary funding is from core deposits

52
Recent Trends in Loan Growth Quality FDIC Bank Categories Credit Card Banks International Banks Agricultural Banks Commercial Lenders Vast majority of FDIC-insured institutions fall in this category Mortgage Lenders Consumer Lenders Other Specialized Banks (less than $1 billion) All Other Banks (less than $1 billion) All Other Banks (more than $1 billion)
 All Other Banks (less than $1 billion) All Other Banks (more than $1 billion)")
53
Credit Risk Diversification and Lending Concentrations by Asset Concentrations: December 2004 Asset Concentration Group Definitions (Groups are hierarchical and mutually exclusive): Credit card lenders—Institutions whose credit card loans plus securitized receivables exceed 50 percent of total assets plus securitized receivables. International banks—Banks with assets greater than $10 billion and more than 25 percent of total assets in foreign offices. Agricultural banks—Banks whose agricultural production loans plus real estate loans secured by farmland exceed 25 percent of total loans and leases. Commercial lenders—Institutions whose commercial and industrial loans, plus real estate construction and development loans, plus loans secured by commercial real estate properties exceed 25 percent of total assets. Mortgage lenders—Institutions whose residential mortgage loans, plus mortgage-backed securities, exceed 50 percent of total assets.

54
Credit Risk Diversification and Lending Concentrations by Asset Concentrations: December 2004 Asset Concentration Group Definitions (Groups are hierarchical and mutually exclusive): Consumer lenders—Institutions whose residential mortgage loans, plus credit card loans, plus other loans to individuals, exceed 50 percent of total assets. Other specialized $1 billion—Institutions with assets greater than $1 billion that do not meet any of the definitions above; they have significant lending activity with no identified asset concentrations.

55
Relative Importance of Loans, Investment Securities, and Cash Assets at Commercial Banks, 1935–2004

56
Noncurrent Loans as a Percentage of Total Loans, all FDIC Insured Institution, 1984–2004 0.00% 1.00% 2.00% 3.00% 4.00% 5.00% 6.00% 7.00% 8.00% 1984 198519861987 1988198919901991 1992 1993 19941995199619971998 1999 2000 2001 2002 2003 2004 Noncurrent Loans Total Real Estate Noncurrent Loans Commercial and Industrial Noncurrent Loans Loans to Individuals Noncurrent Loans All Other Loans

57
Net Charge-offs by Loan Type at U.S. Commercial Banks, 1985–2004 0.00% 0.50% 1.00% 1.50% 2.00% 2.50% 3.00% 3.50% 1984 19851986 19871988 198919901991 1992 19931994199519961997199819992000 2001 200220032004 Charge-Offs Total Real Estate Charge-Offs Commercial and Industrial Charge-Offs Loans to Individuals Charge-Offs All Other Loans

58
Credit Card Loss Rate and Personal Bankruptcy Filings, 1984–2004 0% 1% 2% 3% 4% 5% 6% 7% 8% 19841986198819901992199419961998200020022004 Net Charge-off Rate (%) 50 100 150 200 250 300 350 400 450 Number of Bankruptcy Filings (Thousands) Net Credit Card Charge-Off Rates, % Personal Bankruptcy Filings (Thousands)
 Number of Bankruptcy Filings (Thousands) Net Credit Card Charge-Off Rates, % Personal Bankruptcy Filings (Thousands)")
59
Trends in Competition for Loan Business In 1984, there were nearly 14,500 banks in the U.S. This fell to fewer than 7,700 at the beginning of 2004 This reduction in the number of banks is a direct result of the relaxation of branching restrictions and increased competition Banks face tremendous competition This has forced consolidation as banks attempt to lower costs and provide a broader base of services

60
Trends in Competition for Loan Business Most firms can obtain loans from many different sources Finance companies Life insurance companies Commercial paper Junk bonds Reduced regulation, financial innovation, increased consumer awareness, and new technology have made it easier to obtain loans from a variety of sources

61
Trends in Competition for Loan Business Banks still have the required expertise and experience to make them the preferred lender for many types of loans Technology advances have meant that more loans are becoming “standardized,” making it easier for market participants to offer loans in direct competition to banks Structured Note Loan that is specifically designed to meet the needs of one or a few companies but has been packaged for resale

62
Trends in Competition for Loan Business Many types of loans can be standardized, credit scored and securitized: Mortgages Government-guaranteed student loans Small business loans (sponsored by the SBA) Credit cards Auto loans
 Credit cards Auto loans")
63
Trends in Competition for Loan Business Not all loans can be standardized Farm loans Many small business loans Repayment schedules and collateral are often customized so that they do not conform to some standard Medium to large businesses will have specialized needs as well This is the area of lending that is still dominated by commercial banks and the area in which the bank is uniquely qualified

64
The Credit Process

65
Loan Policy- Formalizes lending guidelines that employees follow to conduct bank business Credit Philosophy Management’s philosophy that determines how much risk the bank will take and in what form Credit Culture The fundamental principles that drive lending activity and how management analyzes risk

66
The Credit Process Credit Culture The fundamental principles that drive lending activity and how management analyzes risk Values Driven Focus is on credit quality Current-Profit Driven Focus is on short-term earnings Market-Share Driven Focus is on having the highest market share

67
Business Development and Credit Analysis Business Development Market research Train employees: On what products are available What products customers are likely to need How they should communicate with customers about those needs Advertising and Public Relations Officer Call Programs

68
Business Development and Credit Analysis Credit Analysis Evaluate a borrower’s ability and willingness to repay Questions to address What risks are inherent in the operations of the business? What have managers done or failed to do in mitigating those risks? How can a lender structure and control its own risks in supplying funds?

69
Business Development and Credit Analysis Five C’s of Good Credit Character Capital Capacity Conditions Collateral

70
Business Development and Credit Analysis Five C’s of Bad Credit Complacency Carelessness Communication Contingencies Competition

71
Credit Execution and Administration Loan Decision Individual officer decision Committee Centralized underwriting Loan Agreement Formalizes the purpose of the loan Terms of the loan Repayment schedule Collateral required Any loan covenants States what conditions bring about a default

72
Credit Execution and Administration Documentation: Perfecting the Security Interest Perfected When the bank's claim is superior to that of other creditors and the borrower Require the borrower to sign a security agreement that assigns the qualifying collateral to the bank Bank obtains title to equipment or vehicles

73
Credit Execution and Administration Position Limits Maximum allowable credit exposures to any single borrower, industry, or geographic local Risk Rating Loans Evaluating characteristics of the borrower and loan to assess the likelihood of default and the amount of loss in the event of default

74
Credit Execution and Administration Loan Covenants Positive (Affirmative) Indicate specific provisions to which the borrower must adhere Negative Indicate financial limitations and prohibited events
 Indicate specific provisions to which the borrower must adhere Negative Indicate financial limitations and prohibited events")
75
Sample Loan Covenants

76
Credit Execution and Administration Loan Review Monitoring the performance of existing loans Handling problem loans Loan review should be kept separate from credit analysis, execution, and administration The loan review committee should act independent of loan officers and report directly to the CEO of the bank

77
Credit Execution and Administration Problem Loans Often require special treatment Modify terms of the loan agreement to increases the probability of full repayment Modifications might include: Deferring interest and principal payments Lengthening maturities Liquidating unnecessary assets

78
Characteristics of Different Types of Loans UBPR Classifications Real Estate Loans Commercial Loans Individual Loans Agricultural Loans Other Loans and Leases in Domestic Offices Other Loans and Leases in Foreign Offices

79
Characteristics of Different Types of Loans Real Estate Loans Construction and Development Loans Commercial Real Estate Multi-Family Residential Real Estate 1-4 Family Residential Home Equity Farmland Other Real Estate Loans

80
Characteristics of Different Types of Loans Commercial Real Estate Loans Typically short-term loans consisting of: Construction and Real Estate Development Loans Land Development Loans Commercial Building Construction and Land Development Loans

81
Characteristics of Different Types of Loans Commercial Real Estate Loans Construction Loans Interim financing on commercial, industrial, and multi-family residential property Interim Loans Provide financing for a limited time until permanent financing is arranged Land Development Loans Finance the construction of road and public utilities in areas where developers plan to build houses

82
Characteristics of Different Types of Loans Commercial Real Estate Loans Developers typically repay loans as lots or homes are sold Takeout Commitment An agreement whereby a different lender agrees to provide long-term financing after construction is finished

83
Characteristics of Different Types of Loans Residential Mortgage Loans Mortgage Legal document through which a borrower gives a lender a lien on real property as collateral against a debt Most are amortized with monthly payments, including principal and interest

84
Characteristics of Different Types of Loans Residential Mortgage Loans 1-4 Family Residential Mortgage Loans Holding long-term fixed-rate mortgages can create interest rate risk for banks with loss potential if rates increase To avoid this, many mortgages now provide for: Periodic adjustments in the interest rate Adjustments in periodic principal payments The lender sharing in any price appreciation of the underlying asset at sale All of these can increase cash flows to the lender when interest rates rise

85
Characteristics of Different Types of Loans The Secondary Mortgage Market Involves the trading of previously originated residential mortgages Can be sold directly to investors or packaged into mortgage pools Home Equity Loans Second Mortgage Loans Typically shorter term than first mortgages Subordinated to first mortgage

86
Characteristics of Different Types of Loans Equity Investments in Real Estate Historically, commercial banks have been prevented from owning real estate except for their corporate offices or property involved in foreclosure Regulators want banks to engage in speculative real estate activities only through separate subsidiaries

87
Characteristics of Different Types of Loans Working Capital Requirements Net Working Capital Current assets – current liabilities For most firms, net working capital is positive, indicating that some current assets are not financed with current liabilities

88
Characteristics of Different Types of Loans Working Capital Requirements Days Cash Cash/(Sales/365) Days Receivables AR/(Sales/365) Days Inventory Inventory/(COGS/365) Days Payable AP/(Purchases/365) Days Accruals Accruals/(Operating Expenses/365)
 Days Receivables AR/(Sales/365) Days Inventory Inventory/(COGS/365) Days Payable AP/(Purchases/365) Days Accruals Accruals/(Operating Expenses/365)")
89
Characteristics of Different Types of Loans Working Capital Requirements Cash-to-Cash Asset Cycle How long the firm must finance operating cash, inventory and accounts receivables from the day of first sale Cash-to-Cash Liability Cycle How long a firm obtains interest-free financing from suppliers in the form of accounts payable and accrued expenses to help finance the asset cycle

90
Balance Sheet and Income Statement Data for Simplex Corporation Cash-to-Cash Cycle Assets Liabilities and Equity Selected Income Stat Data Cash 80 Accounts payable 400 Net sales 9,125 Accounts receivable 700 Accrued expenses 80 COGS 6,100 Inventory 500 Notes pay—bank 450 Operating expenses 2,550 Current assets 1,280 CM LTD 50 Purchases* 6,430 Fixed assets 1,220 Current liabilities 980 Average Daily: Total Assets 2,500 LTD 550 Sales 25.00 Equity 970 COGS 16.71 Operating expenses 6.99 Total Liabilities and Equity 2,500 Purchases 17.62

91
Cash-to-Cash Working Capital Cycle for Simplex Corporation Days Cash = 3.20 Days Payable = 22.71 Days Inventory = 29.92Days AcctRec = 28.00 Days Accruals = 11.45 Days Financing = 26.96 Working Capital Financing needs = Deficit x Avg. Daily COGS = 26.96 *16.71. =450.53. Total = 61.12 Total = 34.16 Time

92
Characteristics of Different Types of Loans Seasonal versus Permanent Working Capital Needs All firms need some minimum level of current assets and current liabilities The amount of current assets and current liabilities will vary with seasonal patterns

93
Characteristics of Different Types of Loans Permanent Working Capital The minimum level of current assets minus the minimum level of adjusted current liabilities Adjusted Current Liabilities Current liabilities net of short-term bank credit and current maturities of long-term debt Seasonal Working Capital Difference in total current assets and adjusted current liabilities

94
Trends in Working Capital Needs Total Current Assets Minimum Current Assets Total Current Liabilities Minimum Current Liabilities Total = Permanent Working Capital Needs + Seasonal Working Capital Needs Permanent Working Capital Needs q Time Seasonal Working Capital Needs Dollars

95
Short-Term Commercial Loans Open Credit Lines Loan is seasonal if the need arises on a regular basis and if the cycle completes itself with one year Used to purchase raw materials and build up inventories of finished goods in anticipation of later sales It is self-liquidating in the sense that repayment derives from the sale of finished goods that are financed

96
Short-Term Commercial Loans Open Credit Lines The bank makes a certain amount of funds available to a borrower for a set period of time Often used for seasonal loans The customer determines the timing of the actual borrowings (“takedowns”) Borrowings increase with inventory buildup and decline with the collection of receivables
 Borrowings increase with inventory buildup and decline with the collection of receivables")
97
Short-Term Commercial Loans Open Credit Lines Typically require that the loan be fully repaid at least once during each year to confirm that the needs are seasonal Commitment Fee A fee, in addition to interest, for making credit available May be based on the entire credit line or on the unborrowed balance

98
Short-Term Commercial Loans Asset-Based Loans Loans Secured by Inventories The security consists of raw materials, goods in process, and finished products. The value of the inventory depends on the marketability of each component if the borrower goes out of business. Banks will lend from 40 to 60 percent against raw materials that are common among businesses and finished goods that are marketable, and nothing against unfinished inventory

99
Short-Term Commercial Loans Asset-Based Loans Loans Secured by Accounts Receivable The security consists of paper assets that presumably represent sales The quality of the collateral depends on the borrower’s integrity in reporting actual sales and the credibility of billings

100
Short-Term Commercial Loans Asset-Based Loans Loans Secured by Accounts Receivable Accounts Receivable Aging Schedule List of A/Rs grouped according to the month in which the invoice is dated Lockbox Customer’s mail payments go directly to a P.O. Box controlled by the bank The bank processes the payments and reduces the borrower’s balance but charges the borrower for handling the items

101
Short-Term Commercial Loans Highly Levered Transactions Leveraged Buyout (LBO) Involves a group of investors, often part of the management team, buying a target company and taking it private with a minimum amount of equity and a large amount of debt Target companies are generally those with undervalued physical assets The investors often sell specific assets or subsidiaries to pay down much of the debt quickly If key assets have been undervalued, the investors may own a downsized company whose earnings prospects have improved and whose stock has increased in value The investors sell the company or take it public once the market perceives its greater value.
 Involves a group of investors, often part of the management team, buying a target company and taking it private with a minimum amount of equity and a large amount of debt Target companies are generally those with undervalued physical assets The investors often sell specific assets or subsidiaries to pay down much of the debt quickly If key assets have been undervalued, the investors may own a downsized company whose earnings prospects have improved and whose stock has increased in value The investors sell the company or take it public once the market perceives its greater value.")
102
Short-Term Commercial Loans Highly Levered Transactions Arise from three types of transactions LBOs in which debt is substituted for privately held equity Leveraged recapitalizations in which borrowers use loan proceeds to pay large dividends to shareholders Leveraged acquisitions in which a cash purchase of another related company produces an increase in the buyer’s debt structure

103
Term Commercial Loans Original maturity greater than 1 year Typically finance: Depreciable assets Start-up costs for a new venture Permanent increase in the level of working capital Lenders focus more on the borrower’s periodic income and cash flow rather than the balance sheet Term loans often require collateral, but this represents a secondary source of repayment in case the borrower defaults.

104
Term Commercial Loans Balloon Payments Most of the principal is due at maturity Bullet Payments All of the principal is due at maturity

105
Short-Term Commercial Loans Revolving Credits A hybrid of short-term working capital loans and term loans Typically involves the commitment of funds for 1 – 5 years At the end of some interim period, the outstanding principal converts to a term loan During the interim period, the borrower determines how much credit to use Mandatory principal payments begin once the revolver is converted to a term loan

106
Short-Term Commercial Loans Agriculture Loans Proceeds are used to purchase seed, fertilizer and pesticides and to pay other production costs Farmers expect to repay the debt with the crops are harvested and sold Long-term loans finance livestock, equipment, and land purchases The primary source of repayment is cash flow from the sale of livestock and harvested crops in excess of operating expenses

107
Additional Loan Types Consumer Loans Installment Require periodic payments of principal and interest Credit Card Non-Installment For special purposes Example: Bridge loan for the down payment on a house that is repaid from the sale of the previous house The average consumer loan is relatively small and has a maturity of 1 to 4 years

108
Additional Loan Types Venture Capital A broad term use to describe funding acquired in the earlier stages of a firm’s economic life Due to the high leverage and risk involved banks generally do not participate directly in venture capital deals Some banks have subsidiaries that finance certain types of equity participations and venture capital deals, but their participation is limited

109
Additional Loan Types Venture Capital This type of funding is usually acquired during the period in which the company is growing faster than its ability to generate internal financing and before the company has achieved the size needed to be efficient

110
Additional Loan Types Venture Capital Venture capital firms attempt to add value to the firm without taking majority control Often, venture capital firms not only provide financing but experience, expertise, contacts, and advice when required Types of Venture Financing Seed or Start-up Capital Early stages of financing Highly levered transactions in which the venture capital firm will lend money for a percentage stake in the firm Rarely, if ever, do banks participate at this stage

111
Additional Loan Types Venture Capital Types of Venture Financing Later-Stage Development Financing: Expansion and replacement financing Recapitalization or turnaround financing Buy-out or buy-in financing Mezzanine Financing Banks do participate in these rounds of financing, but if the company is overleveraged at the onset, the banks will be effectively excluded from these later rounds of financing

112
Evaluating Commercial Loan Request Chapter 11 Bank Management 6th edition. Timothy W. Koch and S. Scott MacDonald Bank Management, 6th edition. Timothy W. Koch and S. Scott MacDonald Copyright © 2006 by South-Western, a division of Thomson Learning

113
Two types of errors in judgment regarding lending : Type I Error Making a loan to a customer who will ultimately default Type II Error Denying a loan to a customer who would ultimately repay the debt.

114
Five key questions/issues: 1. What is the character of the borrower and the quality of information provided? 2. What are the loan proceeds going to be used for? 3. How much does the customer need to borrow? 4. What is the primary source of repayment and when? 5. What collateral is available ? (Secondary source of repayment)
.")
115
Four steps in evaluating credit requests 1. Overview of management and operations 2. Spread the financial statements 3. Cash flow analysis 4. Pro forma projections and analysis

116
Overview of management and operations Gather information on: Business and related industry Management quality Nature of loan request Quality of the data

117
Spread the financials Spread the financials and compute common size ratios Compare with industry averages Compare over time (trend analysis) Calculate a series of financial ratios that indicate performance and risk Compare with industry averages Compare over time
 Calculate a series of financial ratios that indicate performance and risk Compare with industry averages Compare over time")
118
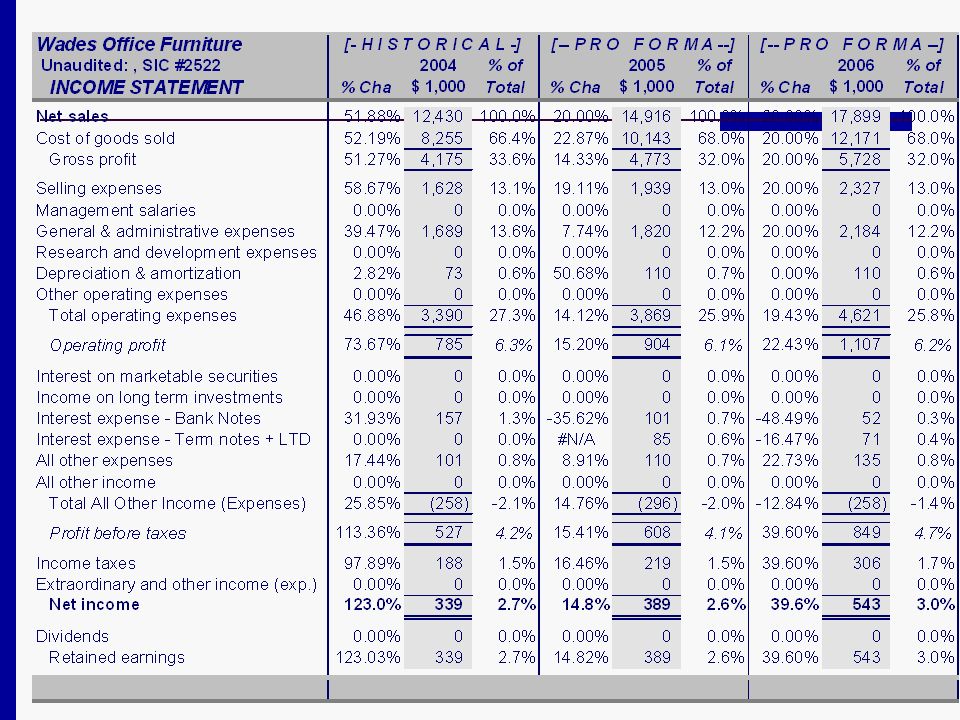
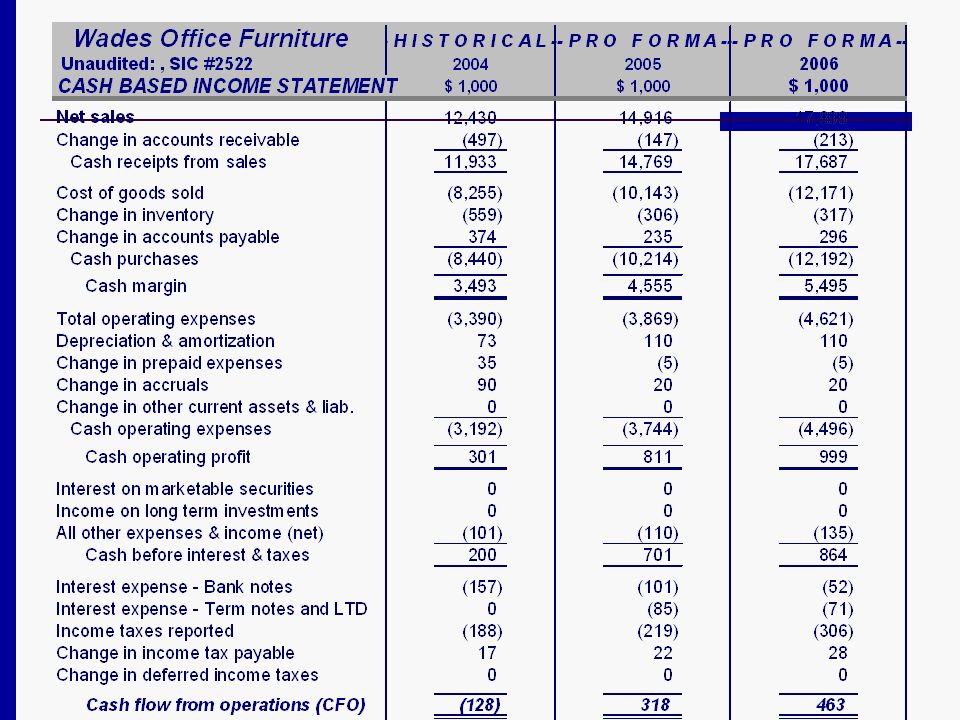
Wades Office Furniture - Income Statement

119
Historical Balance Sheet (Assets)
")
120
Historical Balance Sheet (Liabilities and Equity)
")
121
Ratio analysis Liquidity and activity ratios Leverage ratios Profitability ratios

122
Liquidity and activity ratios Net Working Capital = CA - CL Current Ratio = CA / CL Quick Ratio = (CA – Inv.) / CL Days Cash = Cash / Avg. daily sales Inventory Turnover = COGS / Avg. Inv. AR Collection (Days A/R) = (A/R) / Avg. daily sales Days Cash to Cash = Days Cash + Days A/R + Days inventory Days Payable Outstanding =AP / Avg. daily pur. = AP / [(COGS + Inventory) / 365] Sales to net fixed assets = Sales / Net fixed assets
 = (A/R) / Avg. daily sales Days Cash to Cash = Days Cash + Days A/R + Days inventory Days Payable Outstanding =AP / Avg. daily pur. = AP / [(COGS + Inventory) / 365] Sales to net fixed assets = Sales / Net fixed assets.")
123
Wades Office Furniture: Liquidity Ratios

124
Leverage ratios Debt Ratio = Debt / Total assets Debt to tangible net worth = Debt / Tang. NW Times interest earned = EBIT / Int. exp. where, EBIT = Earns before tax plus int. exp. Fixed Charge Coverage = (EBIT+lease pay) / (Int. exp.+ lease pay) Net Fixed Assets to Tangible NW Dividend Payout % = Dividends paid / Net profit
 / (Int. exp.+ lease pay) Net Fixed Assets to Tangible NW Dividend Payout % = Dividends paid / Net profit.")
125
Wades Office Furniture: Leverage Ratios

126
Profitability ratios Return on Equity (ROE) = Net income / Total equity Profit before taxes to net worth = Profit before taxes / Tangible net worth Return on Assets (ROA) = Net income / Total assets Profit before taxes to total assets = Profit before taxes / Total assets Asset utilization (AU)= Sales / Total assets sometimes referred to as asset turnover Profit margin (PM) = Net income / Sales Sales growth = Sales / Last period’s sales Income taxes to profit before taxes = Reported income tax / Profit before taxes
 = Net income / Total equity Profit before taxes to net worth = Profit before taxes / Tangible net worth Return on Assets (ROA) = Net income / Total assets Profit before taxes to total assets = Profit before taxes / Total assets Asset utilization (AU)= Sales / Total assets sometimes referred to as asset turnover Profit margin (PM) = Net income / Sales Sales growth = Sales / Last period’s sales Income taxes to profit before taxes = Reported income tax / Profit before taxes")
127
Wades Office Furniture: Profitability Ratios

129
Cash flow analysis: Cash pays a loan not net income Cash Assets Let A1 = Cash, then: Let NW = stock + surplus + NI - DIV Let NI = Revenues - Expenses - Taxes

130
Sources and uses of cash Sources of cash are: Increase in any liability Decrease in any non-cash asset New issues of stock Additions to surplus Revenues Uses of cash are: Decrease in any liability Increases in any non-cash assets Repayment / refunding of stock Deductions from surplus Cash expenses, taxes, dividends

131
Understanding sources and uses Assets are a use of cash: = -(At - At-1) Liabilities are a source of cash: = +(Lt - Lt-1) Revenues are a source of cash: = +Revenues Expenses are a use of cash: = -Expenses Sum up each part
 Liabilities are a source of cash: = +(Lt - Lt-1) Revenues are a source of cash: = +Revenues Expenses are a use of cash: = -Expenses Sum up each part")
132
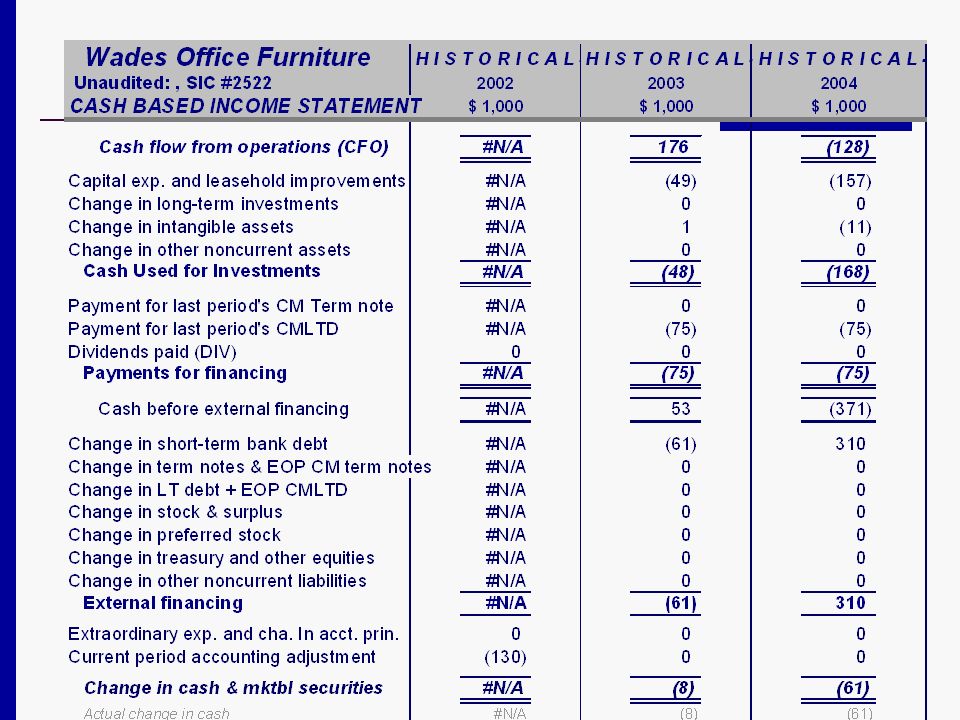
There are two types of cash flow statements 1. Direct Converts the income statement into a “cash based income statement.” Begins with net sales and adjusts for changes in balance sheet items. 2. Indirect Adjusts net income for non-cash charges and changes in balance sheet items. Since most financial statements use the indirect method, we will focus on it.

133
Four sections in either cash flow statement. 1. Operations Includes income statement items and all current assets and current liabilities. 2. Investing Includes all long term assets 3. Financing Includes all long term liabilities and equity (except retained earnings) plus cash dividends paid. 4. Cash Total of the above, but must equal the actual change in cash and marketable securities.
 plus cash dividends paid. 4. Cash Total of the above, but must equal the actual change in cash and marketable securities..")
134
Converting the income statement into a cash based income statement 1. Operating: Cash sales: + Net Sales - Accounts receivables = Cash sales Cash purchases (negative value): - COGS - Inventory + Accounts payable = Cash purchases = Cash gross margin
: - COGS - Inventory + Accounts payable = Cash purchases = Cash gross margin.")
135
Converting the income statement into a cash based income statement (continued) Operating (continued): Cash operating expenses (negative value): - Operating expenses + Non-cash charges (dep. and amortization.) - Prepaid expenses + Accruals = Cash operating expenses Other expenses and taxes: - Other expenses + Other income - Reported taxes + Income tax payables and deferred inc. tax = Other expenses and taxes = Cash flow from operations (CFO)
 - Prepaid expenses + Accruals = Cash operating expenses Other expenses and taxes: - Other expenses + Other income - Reported taxes + Income tax payables and deferred inc. tax = Other expenses and taxes = Cash flow from operations (CFO).")
136
Cash based income statement (cont.) 2. Investing: - Capital Exps. = Net fixed assets + depreciation - Other long term assets = Cash used for Investing. 3. Financing: - Payments for last periods current maturity debt - Payments for dividends = Payments for financing + Debt + EOP CM L-T debt + New stock issues = External Financing 4. = Change in cash and marketable securities

139
Projections of financial condition Pro Forma projections of the borrower’s condition reveal: How much financing is required. When the loan will be repaid. Use of the loan. Pro Forma Projections Determine critical and non critical assumptions. Use industry projections, internal projections and judgment to determine sales projections. In general, grow revenue and trace through the financial statements.

140
Pro Forma: Income Statement Sales 2005 = Sales 2004 x (1 + g sales ) = $12,430 x (1 + 0.20) = $14,916 COGS 2005 = Sales 2005 x COGS % of Sales = $14,916 x 0.68 = $10,143 Sell. Exp 2005 = Sales 2005 x Selling Exp. % of Sales = $14,916 x 0.13 = $1,939 G&A Exp 2005 = Sales 2005 x G&A Exp. % of Sales = $14,916 x 0.122 = $1,820 Int. Exp 2005 = (Bank debt 2005 x rate on bank debt) + (L.T. debt 2005 x rate on L.T. debt) = $697 x 0.145 + [($75 + $50 + $350 + $225) x 0.09] = $186
 + (L.T. debt 2005 x rate on L.T. debt) = $697 x [($75 + $50 + $350 + $225) x 0.09] = $186.")
141
Pro Forma: Balance Sheet (Assets) Associate balance sheet items with sales. AR 2005 = Days A/R x Average Daily Sales 2005 = 50 x ($14,916 / 365) = $2,043 Inventory 2005 = COGS 2005 / Inventory turnover = $10,143 / 4.9 = $2,070 Capital expenditures from the capital budget: Gross fixed (GFA) 2005 = GFA 2004 + Cap. Exp. 2005 = $791 + $400 = $1,191 Accumulated depreciation 2005 =Acc. Dep. 2004 + depreciation exp. 2005 = $346 + $110 = $973 Determine appropriate turnover rates from historical trends or industry averages.
 = $2,043 Inventory 2005 = COGS 2005 / Inventory turnover = $10,143 / 4.9 = $2,070 Capital expenditures from the capital budget: Gross fixed (GFA) 2005 = GFA Cap. Exp = $791 + $400 = $1,191 Accumulated depreciation 2005 =Acc. Dep depreciation exp = $346 + $110 = $973 Determine appropriate turnover rates from historical trends or industry averages..")
142
Pro Forma: Balance Sheet (Liabilities) Trade credit may be tied to inventory growth, thus accounts payable tied to inventory growth: AP 2005 = Days AP x Avg. Daily purchases 2005 = Days AP x ((COGS 2005 + Inv. 2005 ) / 365) = 53 x ($10,143 + ($2,070 – $1,764) / 365) = $1,517 Principal payments on debt can be obtained from the capital budget: LTD 2005 = LTD 2004 + New LTD 2005 – CM LTD 2005 = $300 + $0 – $75 = $225 Term notes (TN) 2005 = TN 2004 + New TN 2005 – CM TN 2005 = $0 + $400 – $50 = $350 Note: CM = Current maturity
 / 365) = 53 x ($10,143 + ($2,070 – $1,764) / 365) = $1,517 Principal payments on debt can be obtained from the capital budget: LTD 2005 = LTD New LTD 2005 – CM LTD 2005 = $300 + $0 – $75 = $225 Term notes (TN) 2005 = TN New TN 2005 – CM TN 2005 = $0 + $400 – $50 = $350 Note: CM = Current maturity.")
143
Pro Forma: Balance Sheet (Equity) Balance sheet definitions: Retained earnings (RE) 2005 = RE 2004 + (NI 2005 – Div. 2005 ) + Acct Adjust. = $804 + ($339 – $0) + 0 = $1,893 Stock 2005 = Stock 2004 + New stock issues Note: an accounting adjustment is only needed when adjustments have been made to retained earnings.
 + Acct Adjust. = $804 + ($339 – $0) + 0 = $1,893 Stock 2005 = Stock New stock issues Note: an accounting adjustment is only needed when adjustments have been made to retained earnings..")
144
Pro Forma: Determining the “Plug Figure” Sales growth will determine growth in receivables, inventory and profit. Net Income varies directly with sales in a stable environment. The difference in projected asset base and total funding without new debt determines additional credit needed or the Plug figure. When Assets 2005 > (Liabilities 2005 + Net worth 2005 ) → Additional financing is required (notes payable plug): Notes payable 2005 = A 2005 – (L 2005 + NW 2005 ) When Assets 2005 < (Liabilities 2005 + Net worth 2005 ) → Surplus cash, invest (marketable securities (plug): Mkt. securities 2005 = – (A 2005 – (L 2005 + NW 2005 ))
 → Additional financing is required (notes payable plug): Notes payable 2005 = A 2005 – (L NW 2005 ) When Assets 2005 < (Liabilities Net worth 2005 ) → Surplus cash, invest (marketable securities (plug): Mkt. securities 2005 = – (A 2005 – (L NW 2005 )).")
145
Wades financial projections assumptions: Most likely circumstances, income statement Sales increase by 20 percent annually. Cost of goods sold equals 68 percent of sales. Selling expenses average 13 percent of sales, G&A expenses average 12.2 percent of sales Depreciation equals $110,000 annually. Noninterest expense equals $110,000 in 2005 and $135,000 in 2006. Interest expense equals 14.5 percent of bank debt and 9 percent of other long-term debt. Income taxes equal 36 percent of earnings before taxes Income tax payable increases annually by the rate of change in 2004. No dividends are paid.

146
Wades financial projections assumptions: Most likely circumstances, balance sheet A/R collection improves to: 50 in 2005 and 46 in 2006. Inventory turnover increases to: 4.9 in 2005 and 5.1 times in 2006. Days AP outstanding remains constant at 53. Prepaid expenses increase by $5,000 Accruals increase by $20,000 annually. $400,000 is loaned to purchase new equipment, with the principal repaid in 8 equal annual installments. depreciation on the new equip. $40,000, while depreciation on old will be $70,000 per year. The minimum cash required is $120,000. Other assets remain constant at $50,000.

148
Pro forma Projections: Wades Office Furniture Balance Sheet (Assets)
")
149
Pro forma Projections: Wades Balance Sheet (Liabilities and Equities)
")
150
Pro forma Projections: Wades Office Furniture Liquidity and Leverage Ratios

151
Pro forma Projections: Wades Profitability, Cash Flow and Growth Ratios

154
Evaluating Consumer Loans Chapter 12 Bank Management 6th edition. Timothy W. Koch and S. Scott MacDonald Bank Management, 6th edition. Timothy W. Koch and S. Scott MacDonald Copyright © 2006 by South-Western, a division of Thomson Learning

155
Consumer Loans Consumer loans in the aggregate currently produce greater percentage profits for banks than commercial loans This is true despite the higher default rates on consumer loans Not surprisingly, consumer loan rates typically exceed commercial loan rates

156
Profitability Measures for FDIC-Insured Banks with Different Asset Concentrations Performance Ratios By Asset Concentration Group Return on Assets (YTD) December 31, 2004 Net Interest Margin (YTD) December 31, 2004
 December 31, 2004 Net Interest Margin (YTD) December 31, 2004")
157
Net Charge-Offs of FDIC-Insured Banks with Different Asset Concentrations Net Charge-offs to Loans and Leases (YTD) December 31, 2004
 December 31, 2004")
158
Consumer Loans Evaluating Consumer Loans An analyst should addresses the same issues discussed with commercial loans: The use of loan proceeds The amount needed The primary and secondary source of repayment However, consumer loans differ so much in design that no comprehensive analytical format applies to all loans

159
Types of Consumer Loans Installment Loans Require the periodic payment of principal and interest Can be extremely profitable Direct Negotiated between the bank and the ultimate user of the funds Indirect Funded by a bank through a separate retailer that sells merchandise to a customer

160
Types of Consumer Loans Credit Cards and Other Revolving Credit Credit cards and overlines tied to checking accounts are the two most popular forms of revolving credit agreements In 2004 consumers charged approximately $2.5 trillion on credit cards Most banks operate as franchises of MasterCard and/or Visa Bank pays a one-time membership fee plus an annual charge determined by the number of its customers actively using the cards

161
Types of Consumer Loans Credit Cards and Other Revolving Credit Credit cards are attractive because they provide higher risk-adjusted returns than do other types of loans Card issuers earn income from three sources: Cardholders’ annual fees Interest on outstanding loan balances Discounting the charges that merchants accept on purchases.

162
Credit Card Loss Rates and Personal Bankruptcy Filings: 1984-2004 Personal Bankruptcy Filings Credit-Card Charge-Off Rates Net Charge-Off % Personal Bankruptcy Filings $000

163
Types of Consumer Loans Credit Card Systems and Profitability Returns depend on the specific role the bank plays A bank is called a card bank if it administers its own credit card plan or serves as the primary regional agent of a major credit card operation A non-card bank does not issue its own card

164
Credit Card Transaction Process Individual Card-Issuing Bank Clearing Network Local Merchant Bank Retail Outlet 1 4 2 33 2

165
Debit Cards and Smart Card Debit Cards Widely available When an individual uses the card, their balance is immediately debited They have lower processing costs to the bank

166
Debit Cards and Smart Card Smart Card An extension of debit and credit cards Contains a memory chip which can manipulate information It is programmable such that users can store information and recall this information when effecting transactions. Only modest usage in the U.S.

167
Debit Cards and Smart Card Smart Card Usage will likely increase dramatically in the U.S.: Firms can offer a much wider range of services Smart cards represent a link between the Internet and real economic activity Suppliers of smart cards are standardizing the formats so that all cards work on the same systems

168
Pre-Paid Cards Prepaid Cards A hybrid of debit cards in which customers prepay for services to be rendered and receive a card against which purchases are charged Use of phone cards, prepaid cellular, toll tags, subway, etc. are growing rapidly

169
Types of Consumer Loans Overdraft Protection and Open Credit Lines Overdraft Protection Against Checking Accounts A type of revolving credit Open Credit Lines A recent trend is to offer open credit lines to affluent individuals whether or not they have an existing account relationship Typically, the bank provides customers with special checks that activate a loan when presented for payment

170
Types of Consumer Loans Home Equity Loans Grew from virtually nothing in the mid- 1980s to over $250 billion in 2004 They meet the tax deductibility requirements of the Tax Reform Act of 1986, which limits deductions for consumer loan interest paid by individuals, because they are secured by equity in an individual's home Some allow access to credit line by using a credit card

171
Types of Consumer Loans Non-Installment Loans Often require a single principal and interest payment Bridge loans are representative of single payment consumer loans. Bridge loans often arise when an individual borrows funds for the down payment on a new house The loan is repaid when the borrower sells the previous home

172
Subprime Loans One of the hottest growth areas during the 1990s Subprime loans are higher-risk loans labeled “B,” “C,” and “D” credits They have been especially popular in auto, home equity, and mortgage lending Typically have the same risk as loans originated through consumer finance companies

173
Subprime Loans Subprime loans have greater risk and must be priced consistently higher than prime-grade loans Example Definitions: B: Typically scores 600+ under the Fair Isaac system; has some 90-day past dues but is now current. Typical delinquencies are 2%-5%; repossessions are 2.5%-6%; and losses are 1.5%-3% C: Typically scores between 500 and 600 and has had write-offs and judgments. The borrower has made subsequent payments of some or all of the loans. Typical delinquencies are 5%-10%; repossessions, 5%-20%; and losses 3%-10% D: Typically scores between 440 and 500 and has charge- offs and judgments that have not been repaid and has not made payments on these loans. Delinquencies are 10%-20%; repossessions, 16%-40%; losses, 10%-20%

174
Subprime Loans High LTV Loans High Loan-To-Value Many lenders upped the stakes by making “high LTV” loans based on the equity in a borrower’s home Where traditional home equity loans are capped at 75 percent of appraised value minus the outstanding principal balance, high LTV loans equal as much as 125% of the value of a home

175
Consumer Credit Regulations Equal Credit Opportunity Makes it illegal for lenders to discriminate Prohibits Information Requests on: The applicant's marital status Whether alimony, child support, and public assistance are included in reported income A woman's childbearing capability and plans Whether an applicant has a telephone

176
Consumer Credit Regulations Equal Credit Opportunity Credit Scoring Systems Credit scoring systems are acceptable if they do not require prohibited information and are statistically justified Credit scoring systems can use information about age, sex, and marital status as long as these factors contribute positively to the applicant's creditworthiness

177
Consumer Credit Regulations Equal Credit Opportunity Credit Scoring Systems Credit scoring models are based on historical data obtained from applicants who actually received loans Statistical techniques assign weights to various borrower characteristics that represent each factor's contribution toward distinguishing between good loans that were repaid on time and problem loans that produced losses

178
Consumer Credit Regulations Equal Credit Opportunity Credit Reporting Lenders must report credit extended jointly to married couples in both spouses' names Whenever lenders reject a loan, they must notify applicants of the credit denial within 30 days and indicate why the request was turned down

179
Consumer Credit Regulations Truth In Lending Regulations apply to all individual loans up to $25,000 where the borrower's primary residence does not serve as collateral Requires that lenders disclose to potential borrowers both the total finance charge and an annual percentage rate (APR) The APR equals the total finance charge computed against the loan balance as a simple annual interest rate equivalent
 The APR equals the total finance charge computed against the loan balance as a simple annual interest rate equivalent")
180
Consumer Credit Regulations Truth In Lending Historically, consumer loan rates were quoted as add-on rates, discount rates, or simple interest rates Add-on Rates Applied against the entire principal of installment Gross interest is added to the principal with the total divided by the number of periodic payments to determine the size of each payment

181
Consumer Credit Regulations Add-on Rates Applied against the entire principal of installment Gross interest is added to the principal with the total divided by the number of periodic payments to determine the size of each payment

182
Consumer Credit Regulations Add-on Rates Example: Suppose that a customer borrows $3,000 for one year at a 12 percent add-on rate with the loan to be repaid in 12 equal monthly installments Total interest equals $360, monthly payment equals $280, and the effective annual interest cost is approximately 21.5%

183
Consumer Credit Regulations Discount Rate Method Quoted rate is applied against the sum of principal and interest, yet the borrower gets to use only the principal, as interest is immediately deducted from the total loan

184
Consumer Credit Regulations Discount Rate Method Example: Consider a 1-year loan with a single $3,000 payment at maturity. The borrower receives only $2,640, or the total loan minus 12% discount rate interest. The effective annual percentage rate, or APR, equals 13.64% Interest charge = 0.12 ($3,000) = $360
 = $360.")
185
Consumer Credit Regulations Simple Interest Interest is paid on only the principal sum Example: $3,000 loan at 12% simple interest per year produces $360 in interest, or a 12 percent effective rate interest (is): = $3,000(0.12)(1)= $360
: = $3,000(0.12)(1)= $360")
186
Consumer Credit Regulations Simple Interest The quoted rate (APR) is adjusted to its monthly equivalent, which is applied against the unpaid principal balance on a loan The loan is repaid in 12 monthly installments and the monthly interest rate equals 1 percent of the outstanding principal balance at each month
 is adjusted to its monthly equivalent, which is applied against the unpaid principal balance on a loan The loan is repaid in 12 monthly installments and the monthly interest rate equals 1 percent of the outstanding principal balance at each month")
187
Consumer Credit Regulations Simple Interest

188
Consumer Credit Regulations Fair Credit Reporting Act Enables individuals to examine their credit reports provided by credit bureaus If any information is incorrect, the individual can have the bureau make changes and notify all lenders who obtained the inaccurate data There are three primary credit reporting agencies: Equifax Experian Trans Union Unfortunately, the credit reports that they produce are quite often wrong

189
Sa m pl e Cr ed it Re po rt

190
Consumer Credit Regulations Fair Credit Reporting Act Credit Score Like a bond rating for individuals Based on several factors Factor Contributing to Credit Score, 10% Factor Contributing to Credit Score, 15% Factor Contributing to Credit Score, 35% Factor Contributing to Credit Score, 30.00% Factor Contributing to Credit Score, 10%

191
Consumer Credit Regulations Community Reinvestment Act CRA prohibits redlining and encourages lenders to extend credit within their immediate trade area and the markets where they collect deposits FIRREA of 1989 raised the profile of the CRA by: Mandating public disclosure of bank lending policies and regulatory ratings of bank compliance Regulators must also take lending performance into account when evaluating a bank's request to charter a new bank, acquire a bank, open a branch, or merge with another institution

192
Consumer Credit Regulations Bankruptcy Reform Individuals who cannot repay their debts on time can file for bankruptcy and receive court protection against creditors Individuals can file for bankruptcy under: Chapter 7 Individuals liquidate qualified assets and distribute the proceeds to creditors Chapter 13 An individual works out a repayment plan with court supervision. Unfortunately, individuals appear to be using bankruptcy as a financial planning tool It appears the stigma of bankruptcy is largely gone

193
Credit Analysis Objective of consumer credit analysis is to assess the risks associated with lending to individuals When evaluating loans, bankers cite the Cs of credit: Character The most important element, but difficult to assess Capital Refers to the individual's wealth position Capacity The lender often imposes maximum allowable debt- service to income ratios Conditions The impact of economic events on the borrower's capacity to pay Collateral The importance of collateral is in providing a secondary source of repayment

194
Credit Analysis Two additional Cs Customer Relationship A bank’s prior relationship with a customer reveals information about past credit and deposit experience that is useful in assessing willingness and ability to repay. Competition Has an impact by affecting the pricing of a loan. All loans should generate positive risk-adjusted returns Lenders periodically react to competitive pressures by undercutting competitors’ rates in order to attract new business Competition should not affect the accept/reject decision

195
Credit Analysis Policy Guidelines Acceptable Loans Automobile Boat Home Improvement Personal-Unsecured Single Payment Cosigned

196
Credit Analysis Policy Guidelines Unacceptable Loans Loans for speculative purposes Loans secured by a second lien Other than home improvement or home equity loans Any participation with a correspondent bank in a loan that the bank would not normally approve Loans to a poor credit risk based on the strength of the cosigner Single payment automobile or boat loans Loans secured by existing home furnishings Loans for skydiving equipment and hang gliders

197
Credit Analysis Evaluation Procedures: Judgmental and Quantitative, Credit Scoring

198
Credit Analysis: Judgmental Procedures Judgmental The loan officer subjectively interprets the information in light of the bank’s lending guidelines and accepts or rejects the loan

199
Credit Analysis: Quantitative Quantitative credit scoring / Credit scoring model The loan officer grades the loan request according to a statistically sound model that assigns points to selected characteristics of the prospective borrower In both cases, judgmental and quantitative, a lending officer collects information regarding the borrower’s character, capacity, and collateral

200
An Application: Credit Scoring a Consumer Loan You receive an application for a customer to purchase a 2003 Jeep Cherokee Do you make the loan?

203
Credit scoring system, University National Bank, applied to credit application for purchase of a 2003 Jeep

204
FICO Credit Scores $% of Population Rate of Credit Delinquencies FICO Score Range National Distribution of FICO Scores Delinquency Rates by FICO Score Up to 499500-549550-599600-649650-699700-749750-799800+ FICO Score Range Up to 499500-549550-599600-649650-699700-749750-799800+ 0 5 10 15 20 25 30 0% 20% 40% 60% 80% 100% 1% 87% 71% 51% 31% 15%5% 2% 1% 5% 8% 12% 16% 19% 28% 11%

205
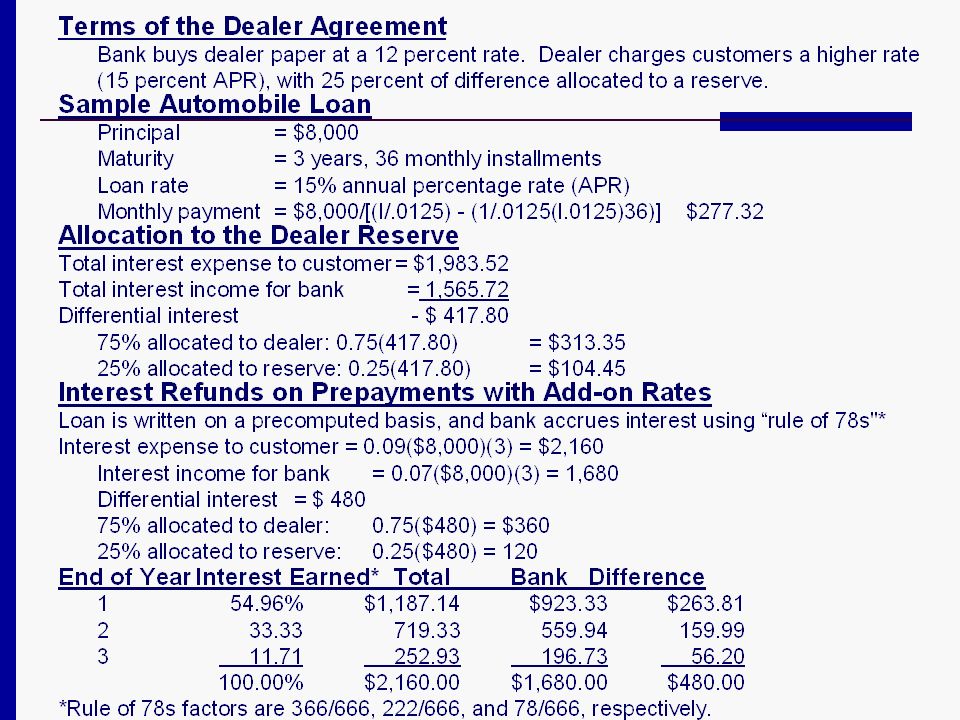
An Application: Indirect Lending A retailer sells merchandise and takes the credit application Because many firms do not have the resources to carry their receivables, they sell the loans to banks or other financial institutions These loans are collectively referred to as dealer paper Banks aggressively compete for paper originated by well-established automobile, mobile home, and furniture dealers

206
An Application: Indirect Lending Indirect lending is an attractive form of consumer lending when a bank deals with reputable retailers Dealers negotiate finance charges directly with their customers A bank, in turn, agrees to purchase the paper at predetermined rates that vary with the default risk assumed by the bank, the quality of the assets sold, and the maturity of the consumer loan A dealer normally negotiates a higher rate with the car buyer than the determined rate charged by the bank This differential varies with competitive conditions but potentially represents a significant source of dealer profit

207
An Application: Indirect Lending Most indirect loan arrangements provide for dealer reserves that reduce the risk in indirect lending The reserves are derived from the differential between the normal, or contract loan rate and the bank rate, and help protect the bank against customer defaults and refunds

209
Recent Risks and Return Characteristics of Consumer Loans Revenues from Consumer Loans The attraction is two-fold: Competition for commercial customers narrowed commercial loan yields so that returns fell relative to potential risks Developing loan and deposit relationships with individuals presumably represents a strategic response to deregulation

210
Recent Risks and Return Characteristics of Consumer Loans Revenues from Consumer Loans Consumer loan rates have been among the highest rates quoted at banks in recent years In addition to interest income, banks generate substantial non-interest revenues from consumer loans With traditional installment credit, banks often encourage borrowers to purchase credit life insurance on which the bank may earn a premium

211
Recent Risks and Return Characteristics of Consumer Loans Consumer Loan Losses Losses on consumer loans are normally the highest among all categories of bank credit Losses are anticipated because of mass marketing efforts pursued by many lenders, particularly with credit cards. Credit card fraud losses amounted to more than $2.4 billion in mid-2004

212
Recent Risks and Return Characteristics of Consumer Loans Interest Rate and Liquidity Risk with Consumer Credit The majority of consumer loans are priced at fixed rates New auto loans typically carry 4-year maturities, and credit card loans exhibit an average 15- to 18-month maturity

213
Recent Risks and Return Characteristics of Consumer Loans Interest Rate and Liquidity Risk with Consumer Credit Bankers have responded in two ways: Price more consumer loans on a floating-rate basis Commercial and investment banks have created a secondary market in consumer loans, allowing loan originators to sell a package of loans

Similar presentations