Download presentation
Presentation is loading. Please wait.

1
MICROFINANCE IN SOUTH AFRICA
Marié Kirsten DBSA Rethinking the Role of National Finance Institutions in Africa The Role of SMEs 23 November 2006 Honourable Programme Manager, distinguished guests, fellow participants, ladies and gentlemen. Thank you for the opportunity to share the South African microfinance case study you. While my paper will not address the role of Small and Micro, enterprises in the economy, rather I will focus on one of the most important needs of emerging entrepreneurs – access to capital or credit or financial services. I chose to speak about this one challenge faced by tiny businesses, in fact, I would actually prefer to divorce access to financial services from the condition of an enterprise, my paper focus more on the exclusive nature of the SA financial system, and indicates how an NGO is successfully addressing this rather shocking market failure. I start off by sharing South Africa’s eeconomic and socio economic realities, after which I will address the financial sector realities, as well as at both private sector and government efforts at addressing these market failures. The last few slides illustrate the story of South Africa’s only sustainable MICRO FINANCE NGO - SEF.

2
Socio-Economic realities in South Africa 2005
SA per capita income = $ pa = 52 wealthiest out of 177 countries HDI declined from 85/177 in 1990 to 120/177 in 2004 Gap between per capita income and HDI -68 in 2004 This means that the economy is growing but the benefits of growth is not shared > 40% of population are unemployed (wide definition) 25.2 million people live on < $2 a day (>50% of population) Highest Gini-coefficient in the world South Africa’s Economic realities are harsh READ According to the 2005 UNDR South Africa’s per capita income of $ per annum ranks it 52nd out of 177 countries in the world. BUT Our HDI human development index has declined from 85 to 120th out of the same 177 countries. This means that the gap has increased by -68 in 10 years. This means that the economy is growing but the benefits of growth is not shared
 25.2 million people live on < $2 a day (>50% of population) Highest Gini-coefficient in the world. South Africa’s Economic realities are harsh READ. According to the 2005 UNDR South Africa’s per capita income of $ per annum ranks it 52nd out of 177 countries in the world. BUT. Our HDI human development index has declined from 85 to 120th out of the same 177 countries. This means that the gap has increased by -68 in 10 years. This means that the economy is growing but the benefits of growth is not shared.")
3
So how do we segment according to the FSM or Financial Services Measure? FinMark Trust has developed FiNSCOPE, a detailed primary research tool measuring the changes in the South African financial landscape. It helps us to understand and design policy instruments to address financial exclusion. The Living Standards Measure or LSM is used to demarcate and understand each group. The annual study is now done for Namibia and Botswana and FinMark is setting up similar studies in Uganda, Zambia and Tanzania. The segmentation above indicates the South African picture – 8 of the 10 Living standard measures are shown, with 9 and 10 excluded since it is similar to LSM 8. LSM 1- 5 63% (19m) of adult population 79% of whom have monthly incomes of less than R1,000 …but of whom 21% (4m) have incomes of between R1,000 – R6,000 94% black 10,3m living in rural areas 68% unbanked; 95% uninsured, long or short 3,1m child grant recipients (total 3,6m)
 of adult population. 79% of whom have monthly incomes of less than R1,000. …but of whom 21% (4m) have incomes of between R1,000 – R6, % black. 10,3m living in rural areas. 68% unbanked; 95% uninsured, long or short. 3,1m child grant recipients (total 3,6m)")
5
Financial Access realities in South Africa 2005
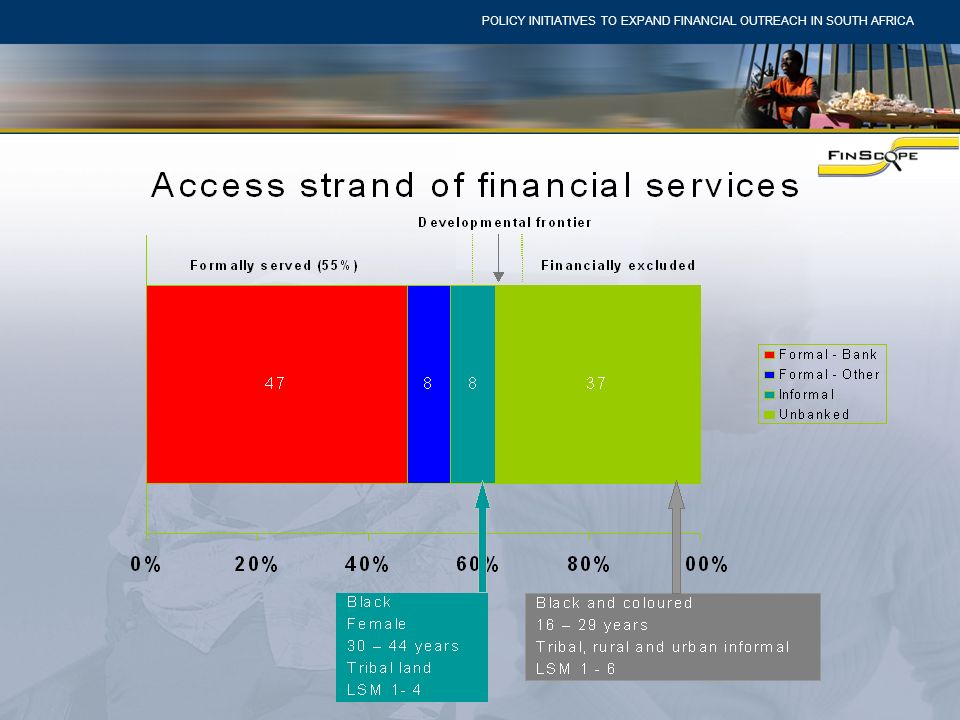
63% financially served 53% without formal bank access Formal - Other 8% Formal Banked 47% Informal – 8% Un-Banked 37% And what are the Financial access realities? Using FinScope 2005 data we know that 47% of SA adult population are formally banked. They use one or more traditional financial product from a bank. 53% ARE NOT FORMALLY BANKED. This 16.4 million adults falls into three categories: 8% have access to financial products but not from commercial banks. They use funeral policies, or store credit, or have a loan from a registered microfinance organization. The next 8% are people with access to informal forms of financial services – including burial societies, savings clubs and loan sharks. The last group are people excluded from any financial services, whether formal or informal. This unbanked group are 37% of the adult population. These people obviously makes a plan, like saving at home, or borrowing from family and friends. 0% 100% 99% Black 16-29 age group Tribal land and urban townships No property or assets

6
SA % NAMIBIA BOTSWANA Banked 47 51 43 Formally served 55 53 49
Financially included 63 56 54 Excluded 37 46 BRAZIL % COLOMBIA MEXICO Banked 43 39 32 Formally served 79 48 36 Financially included 84 51 70 Excluded 16 49 30 The same FinScope study was done for Namibia and Botswana – a very similar picture emerge If however we look at some other developing countries we can see that access to finance in the SADC countries differs specifically from that of Brazil, not so much from Columbia and Mexico.

7
What did government do about this?
1992 – Exemption of the Usury Act 1995/6 – NHFC and KHULA created 1999 – Micro Finance Regulatory Council created and new exemption makes registration compulsory 2002 – National Loans Register - database of all MFRC lenders and loans 2003 – Financial Sector Charter With 53% of the population still excluded from the formal financial sector, what did government do and what are government still doing? Looking back over the 12 years of Democracy in SA, it is clear that the government has tended to facilitate and regulate and thank fully not tried too much to intervere in the microfinance environment. There has much activity over the past four years as far as financial sector legislation is concerned, as you can see from the various pieces of legislation passed – mainly to exempt microfinance operations from the interest rate caps set for the rest of the sector. In 1999 the Micro Finance Regulatory Council was established to ensure that all organizations lending under the new unrestricted interest rate window are registered and supervised. Direct provision of financial services by the government relates only to the provision of wholesale finance in housing, agriculture and enterprise finance through Development Finance Institutions, such as NHFC, MAFISA and Khula. The Small Enterprise Development Agency (SEDA), Umsobomvu Youth Fund (UYF), But the interesting development is not what the government did, but what the private sector did. A very unique part of the SA story is the Financial Charter. Even here government has been content to accept and support the private sector’s commitment under the Financial Sector Charter to deliver broad-based access by 2008. The financial charter, launched in 2003, embodies an agreement among the major players in the financial sector – banks, insurance companies, brokers and exchanges – on a set of service provision and empowerment targets. These targets are set for achieving effective access to banking services for the low income population. This means, for instance, to ensure that a financial service point is no more than 20 km away for 80% of those in the LSM 1- 5 category. All financial services companies are expected to pursue these targets, to report periodically on their progress to a monitoring body, who will grade their performance in the form of a public scorecard. The Banking Association, the Micro Enterprise Alliance, Micro Finance South Africa
, Umsobomvu Youth Fund (UYF), But the interesting development is not what the government did, but what the private sector did. A very unique part of the SA story is the Financial Charter. Even here government has been content to accept and support the private sector’s commitment under the Financial Sector Charter to deliver broad-based access by The financial charter, launched in 2003, embodies an agreement among the major players in the financial sector – banks, insurance companies, brokers and exchanges – on a set of service provision and empowerment targets. These targets are set for achieving effective access to banking services for the low income population. This means, for instance, to ensure that a financial service point is no more than 20 km away for 80% of those in the LSM 1- 5 category. All financial services companies are expected to pursue these targets, to report periodically on their progress to a monitoring body, who will grade their performance in the form of a public scorecard. The Banking Association, the Micro Enterprise Alliance, Micro Finance South Africa.")
8
Financial Sector Charter - Access Targets
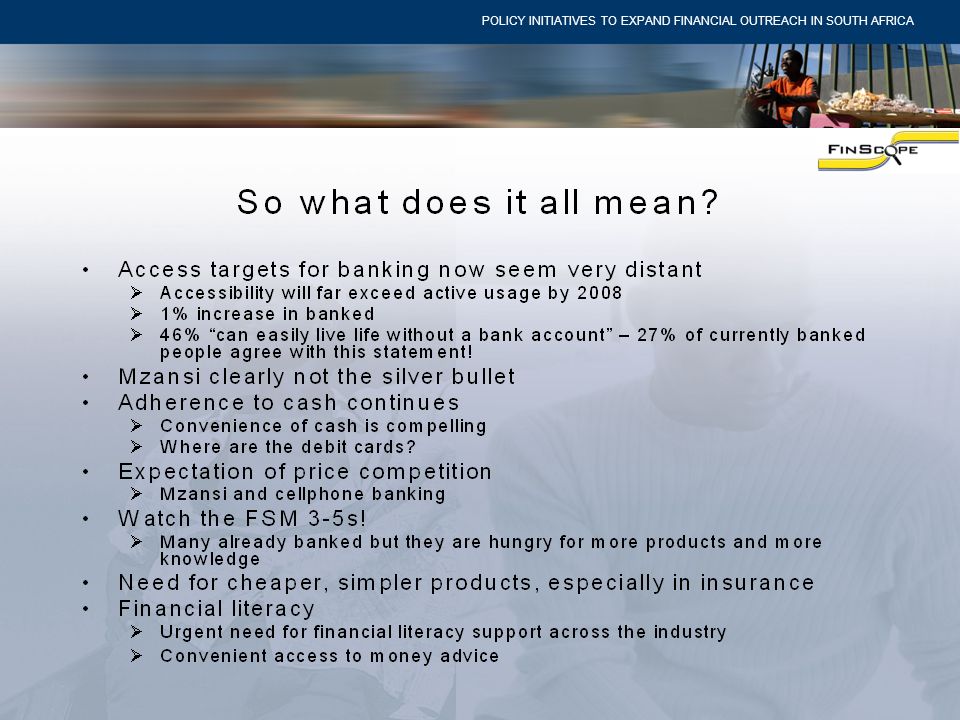
PERCENTAGE OF LSM 1 – 5 WITH EFFECTIVE ACCESS TO: 2008 ACCESS TARGET 2003 ACTUAL USAGE Transaction Accounts 80% 32% Bank Savings Products 28% Life Insurance Products 23% 5% Collective Investment Savings Products 1% plus Negligible Short Term Risk Insurance Products 6% These are some of the highly ambitious targets that the charter set. As you can see from the table, the Charter aims to achieve, by 2008, the following targets: 80% of people in the Living Standard Measure (LSM) 1 – 5 should have access to transaction and savings products. The Charter also set ambitious targets for increasing access to retail insurance services, life insurance products and short term risk insurance. Clearly these targets were very ambitious, with 16.4 million people (or 53.5% of all adults) still lacking access. To achieve the 80% access, another 8 million people will have to move from the un-banked category to the banked category over the next 12 months. But clearly progress has been made, and the fact that government did not drive or enforce this legislation, is important. One of the tools created by the charter is the Mzansi Bank Accounts.
 1 – 5 should have access to transaction and savings products. The Charter also set ambitious targets for increasing access to retail insurance services, life insurance products and short term risk insurance. Clearly these targets were very ambitious, with 16.4 million people (or 53.5% of all adults) still lacking access. To achieve the 80% access, another 8 million people will have to move from the un-banked category to the banked category over the next 12 months. But clearly progress has been made, and the fact that government did not drive or enforce this legislation, is important. One of the tools created by the charter is the Mzansi Bank Accounts.")
9
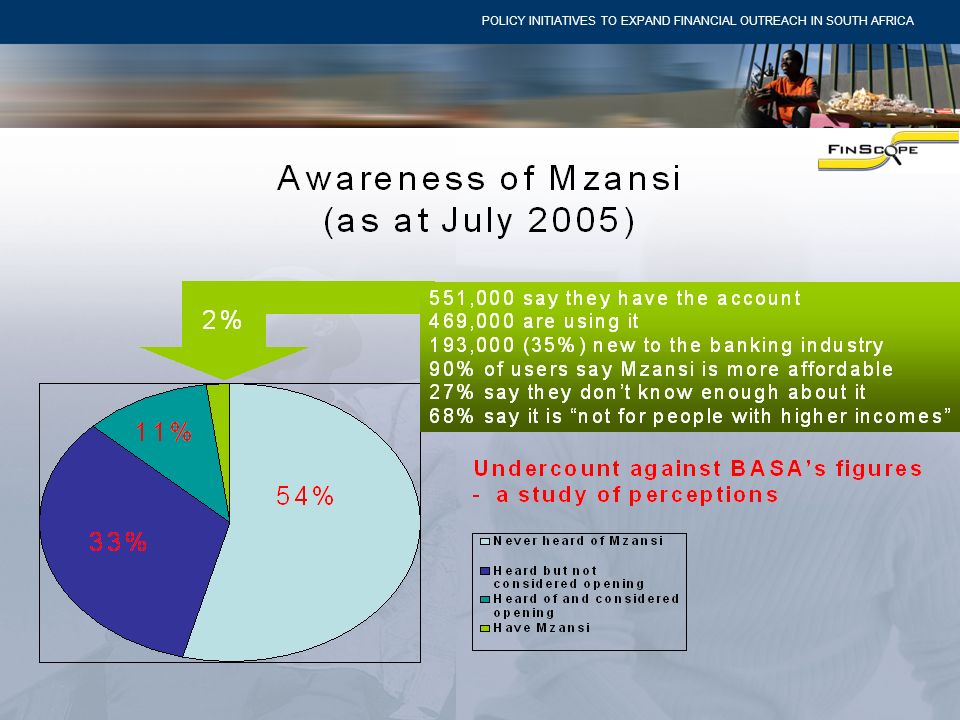
Mzansi Bank Accounts A Charter Initiative – Introduced October 2004
A valid ID the only condition Deposits, withdrawals, transfers locally, debit card payments ABSA, First National Bank, Standard Bank, Nedbank and the Post Bank 91.3% Mzansi account holders are first time banked 62% are between 25 and 54, > 50% women, average balance R300 (US$40) 1.5 million active accounts This initiative, directly flowing from the Charter is called the Mzansi account, a low cost national bank account, launched in October All that is required to open an Mzansi account is a valid ID number. Transactions are limited to deposits, withdrawals, transfers (anywhere in the country) and debit card payments. No management fees are charged, and one free cash deposit per month is allowed. Mzansi accounts, available at any of South Africa’s “big 4” banks or the Post Bank, extends banking services to low-income earners and those living beyond the reach of the banking services. The Mzansi bank account has seen a good deal of success with more than 1,5 million active accounts. Read
 1.5 million active accounts. This initiative, directly flowing from the Charter is called the Mzansi account, a low cost national bank account, launched in October All that is required to open an Mzansi account is a valid ID number. Transactions are limited to deposits, withdrawals, transfers (anywhere in the country) and debit card payments. No management fees are charged, and one free cash deposit per month is allowed. Mzansi accounts, available at any of South Africa’s big 4 banks or the Post Bank, extends banking services to low-income earners and those living beyond the reach of the banking services. The Mzansi bank account has seen a good deal of success with more than 1,5 million active accounts. Read.")
10
and new Apex institutions…
FURTHER REGULATIONS… National Credit Bill – June 2006 Dedicated Banks Bill Cooperative Banks Bill and new Apex institutions… What else did government do? As mentioned earlier, gov continues to facilitate and regulate, more recently with three new sets of legislation - read. The National Credit Act aims to regulate the granting of consumer credit by all credit providers, including microlenders, banks and retailers. The National Credit Act replaces the Usury Act (1968), the Exemption Notices thereof and the Credit Agreements Act (1980). The Dedicated Banks Bill seeks to create a second tier of commercial banks. These banks will be allowed to take deposits from the public. Treasury has proposed a banking regulatory framework that seeks to create a tiered structure, thus making way for a new class of low-cost banking institutions whose focus will be to provide retail financial services to clients currently not serviced through products provided by the commercial banks. The second tier banks would be commercial enterprises with banking licenses that allow for restricted banking services (dedicated banks) and third tier would be member-based deposit-taking financial services cooperatives and credit unions (co-operative banks). Legislation for the proposed banking institutions were drafted in 2004, and are currently reviewed - both Bills will be presented to Cabinet in August 2006. Co-operative (Village) banks are member-based financial institutions that currently operate under the exemption from the Banks Act. The Co-operatives Banks Bill would place fewer burdens on the capital and entry requirements for the industry. Governments only direct provision of financial services is through the housing, agricultural and SME type parastatals that are regularly created and revised and recreated. These parastatals are created by separate gov departments – DTI, agriculture and Housing, and it does resemble a proliferation of wholesale or apex type organisations not well coordinated. It is the governments effort to try and subsidize the provision of financial services to people completely marginalised, geographically or economically. However, the only real success story in South Africa had nothing to do with government or with target setting. It is our own story of Commercial Microfinance. South African Microfinance Apex Fund (SAMAF) – 2006 Micro Agricultural Finance Schemes SA (MAFISA)
, the Exemption Notices thereof and the Credit Agreements Act (1980). The Dedicated Banks Bill seeks to create a second tier of commercial banks. These banks will be allowed to take deposits from the public. Treasury has proposed a banking regulatory framework that seeks to create a tiered structure, thus making way for a new class of low-cost banking institutions whose focus will be to provide retail financial services to clients currently not serviced through products provided by the commercial banks. The second tier banks would be commercial enterprises with banking licenses that allow for restricted banking services (dedicated banks) and third tier would be member-based deposit-taking financial services cooperatives and credit unions (co-operative banks). Legislation for the proposed banking institutions were drafted in 2004, and are currently reviewed - both Bills will be presented to Cabinet in August Co-operative (Village) banks are member-based financial institutions that currently operate under the exemption from the Banks Act. The Co-operatives Banks Bill would place fewer burdens on the capital and entry requirements for the industry. Governments only direct provision of financial services is through the housing, agricultural and SME type parastatals that are regularly created and revised and recreated. These parastatals are created by separate gov departments – DTI, agriculture and Housing, and it does resemble a proliferation of wholesale or apex type organisations not well coordinated. It is the governments effort to try and subsidize the provision of financial services to people completely marginalised, geographically or economically. However, the only real success story in South Africa had nothing to do with government or with target setting. It is our own story of Commercial Microfinance. South African Microfinance Apex Fund (SAMAF) – Micro Agricultural Finance Schemes SA (MAFISA)")
11
The Small Enterprise Foundation
Aim of poverty alleviation through microcredit A section 21 NGO – non-profit Founded in 1991, started operations in January 1992 Inspired by Grameen Bank SEF commenced operations in 1991 to provide tiny loans to the very poor, unemployed people of rural Limpopo – the poorest province in SA where where 60% of households live below the poverty line while 40% live below half this poverty line. SEF has gained considerable international recognition for its poverty-targeting methodology and its success in reaching and ensuring positive impact on the very poor. I am sure you read the MicroBanking Bulletin report on SEF. The organisation’s poverty targeting tool, Participatory Wealth Ranking, was one of the first such tools officially recognised and promoted by the Microcredit Summit Campaign.

15
Current Performance Currently serving over 35 000 active clients
% of women clients: 99% Almost loans since inception Average loan size: $200 / R1547 Loans since inception: $45 / R330 million Loan losses since inception: 0.5% Attained full break-even in Sept 2004

16
Growth and Sustainability
Annually Quarterly Growth and Sustainability The horizontal black line shows where SEF achieved full financial sustainability in 2004

17
Empowerment Belief in people’s ability People treated as clients
Hold people 100% to their group guarantee Client must decide on the business Client solves all problems Although there is support from other clients and facilitation from staff

18
SEF vs. MFI Peers Indicator SEF MFIs by Age MFIs by Region 219 128 162
Total Active Clients / Total Staff 219 128 162 Loan Officer / Total Staff 82% 58% 56% Portfolio-at-risk > 30 days 0.5% 3.0% 2.0% These are some of the comparative stats from the MIX report

19
How SEF works … Clients form groups of 5
Each receives their own loan for their own business All group members guarantee each others loans Groups meet fortnightly in Centres of about 8 groups meeting at a time

20
Key issues…. SEF is achieving > 25% growth a year currently
SEF achieved break even 12 years after conception The profitable SEF is growing much faster than the non-profitable SEF There is absolutely no trade off between impact (reaching the very poor) and profitability Competent management made all the difference
 and profitability. Competent management made all the difference.")
22
Financial Sector Charter LSM 1-5 in summary
63% (19m) of adult population 79% of whom have monthly incomes of less than R1,000 …but of whom 21% (4m) have incomes of between R1,000 – R6,000 94% black 10,3m living in rural areas 68% unbanked; 95% uninsured, long or short 3,1m child grant recipients (total 3,6m)
 of adult population. 79% of whom have monthly incomes of less than R1,000. …but of whom 21% (4m) have incomes of between R1,000 – R6, % black. 10,3m living in rural areas. 68% unbanked; 95% uninsured, long or short. 3,1m child grant recipients (total 3,6m)")
23
New SEF initiatives IMAGE RESEARCH – HIV/AIDS and Gender Violence training combined with microfinance Substantial improvement in the financial performance at participating centres A significant decline in gender based violence amongst training recipients SEF is also pioneering life insurance for its clients

24
Sustainability Attained full break-even in Sept 2004
Now expanding from to 45 000 clients Now covering 95% of all costs

25
Current Performance … Write-off policy: 85 days
Current Portfolio at risk 0.7% Loan losses since inception 0.5%

28
“The apartheid system severely distorted the South African financial system. A handful of large financial institutions…. centralize most of the country's financial assets. But they prove unable to serve most of the black community, especially women. Nor do they contribute significantly to the development of new sectors of the economy. Small informal-sector institutions meet some of the needs of the black community and micro enterprise. They lack the resources, however, to bring about broad-scale development” (RDP, 1994).
..")
29
R R300

Similar presentations


>")


 and of the European Microfinance Centre Co-founder.>")


